Cisco Wireless Dashboards

, , ,

After support for wireless devices was added in Nectus, specific monitoring dashboards were created to track any change that can affect the wireless users, controllers or access points.
The wireless dashboards are vendor specific and this is where you can find the dashboard for Cisco wireless devices:

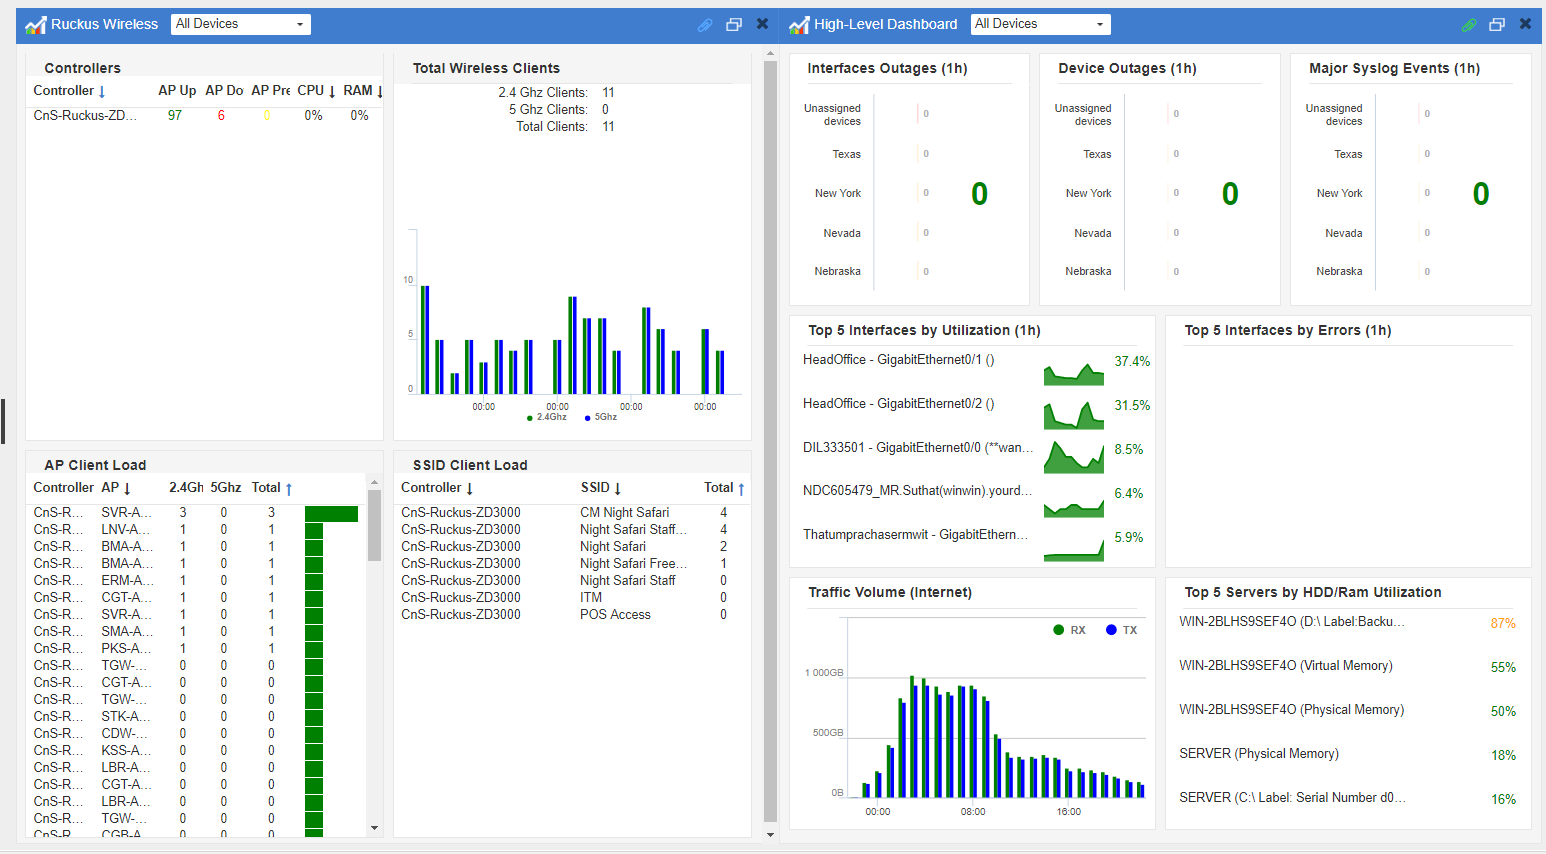
The focus of this article is on Cisco wireless devices, this is how the Cisco wireless dashboard looks like:

Wireless dashboard has multiple sections.
One of the sections covers the controllers and can provide information about the CPU usage, how many APs are Up, Down or Downloading:

As always, you can get device details by selecting the controller:

The interesting things starts when you select the counters related to the number of APs that are up, down or in process of being associated with the controller.
You get a list of APs in that state associated with that specific controller:

To get details about an AP, it is enough to select one of the APs and a window with multiple tabs will provide various information that can help the operator to understand how that specific AP operates.
The first tab provides the name of AP assigned by the operator, the model of AP, the operating system, the IP address and some other useful information about the AP.

The next tab provides technical information about the two frequencies in which the AP operates:

In the next tab, quality of service settings are covered:

The forth tab is about the load in terms of number of clients, receive and transmit utilization for the frequencies supported:

The next tab shows the rogue APs detected:

You can also see the neighbor APs and some of their characteristics:

And the last tab shows the CDP neighbor:

Another section of the wireless dashboard is the SSID Client load which shows how many clients are on each SSID:

The wireless dashboard allows to see how many clients and on which frequency each AP has:

And the last section of the wireless dashboard is the one showing how many clients are on the two frequencies, 2.4Ghz and 5Ghz, in total and you can see some history of how many clients were at some point in time.

Nectus Cisco Wireless dashboard can provide useful information about the wireless devices, controllers and access points.

Cisco Wireless client search and tracking tools

, ,

In this post we will cover some new functionality added to Nectus in latest Wireless release.

The “Wireless Client Search” allows the operator to find any wireless client by its MAC, IP address or Username.

The client search is located under main menu “Tools”:

In the menu, you have an option to search for a client based on the MAC, IP or Username. You can also restrict the scope where the search will take place:

Here is how a result of a MAC search looks like. You can search using part of a MAC address as well, but you need to provide at least 3 characters (two numbers and “:” )

You can view the client details by clicking either on MAC address or IP address and the new window will show Client’s basic info like like SSID, RSSI etc.:

The second tab will show the RSSI from various APs that detects client’s signal:

If AP name is clicked, then you will get detailed information about the AP:

Next, you can search for an IP address (again, you do not have to specify full IP address):

The last option is to search using an username:

The username is shown in the client detailed information:

Coming back to the search window, there is the possibility to track a client. You actually track the MAC address of the client to see if and where the client roamed across the wireless network. One or more clients can be tracked in the same time:

You need to specify how often Nectus should check this MAC address and for how long. If you know the client goes on and off often or it moves around the wireless network, then you might want to use an aggressive timer for frequency to get accurate data about availability:

The list of the tracked clients can be seen here:

And the list is this:

A client can be added for tracking from this menu as well:

And here is how the tracking information looks like for a client:

This shows that the client did not move to another AP, so there was no or little movement of the client.


Cisco Wireless Heat Maps

, ,

In this post, we will cover the wireless heat maps and how they are created in Nectus.

A heat map will allow to visualize the state of the wireless coverage and help to take decision in order to improve the coverage.

Using the information from APs along with a map of physical location, you can find out where are the hot and cold spots.

A heat map is a L2 topology diagram where you can add access points and optionally the controller to which the access points are associated with.

You can add the controller and the APs from the list of controllers:

If the controller and several APs are added to the topology, it will look like this:

In the topology toolbar settings option, you must check the option to see access points in the topology:

Afterwards, the topology looks like this:

You can see which channel is used on each AP and how many clients are connected to each AP.

Ruckus Wireless Antenna info SNMP OID

, ,

Ruckus “Antenna Info” SNMP OIDs
===========================

Antenna Type (0 = 802.11bg, 1 = 802.11a, 2 = 802.11ng, 3 = 802.11na, 4 = 802.11ac)

‘1.3.6.1.4.1.25053.1.2.2.1.1.2.2.1.3.[6.108.170.179.26.66.144].[0]’ => “2”
‘1.3.6.1.4.1.25053.1.2.2.1.1.2.2.1.3.[6.108.170.179.26.66.144].[1]’ => “3”

Antenna Gain (dB)
‘1.3.6.1.4.1.25053.1.2.2.1.1.2.2.1.44.[6.108.170.179.26.66.144].[0]’ => “7”
‘1.3.6.1.4.1.25053.1.2.2.1.1.2.2.1.44.[6.108.170.179.26.66.144].[1]’ => “7”

Tx Power Level (0 = Full, 1 = Half, 2 = Quarter, 3 = Eighth)
‘1.3.6.1.4.1.25053.1.2.2.1.1.2.2.1.5.[6.108.170.179.26.66.144].[0]’ => “0”
‘1.3.6.1.4.1.25053.1.2.2.1.1.2.2.1.5.[6.108.170.179.26.66.144].[1]’ => “0”

Channel Number
‘1.3.6.1.4.1.25053.1.2.2.1.1.2.2.1.4.[6.108.170.179.26.66.144].[0]’ => “1”
‘1.3.6.1.4.1.25053.1.2.2.1.1.2.2.1.4.[6.108.170.179.26.66.144].[1]’ => “36”

Number Of Current Users
‘1.3.6.1.4.1.25053.1.2.2.1.1.2.2.1.8.[6.108.170.179.26.66.144].[0]’ => “0”
‘1.3.6.1.4.1.25053.1.2.2.1.1.2.2.1.8.[6.108.170.179.26.66.144].[1]’ => “0”

Utilization (%)
‘1.3.6.1.4.1.25053.1.2.2.1.1.2.2.1.40.[6.108.170.179.26.66.144].[0]’ => “0”
‘1.3.6.1.4.1.25053.1.2.2.1.1.2.2.1.40.[6.108.170.179.26.66.144].[1]’ => “0”

Average Client RSSI (dBm)
‘1.3.6.1.4.1.25053.1.2.2.1.1.2.2.1.9.[6.108.170.179.26.66.144].[0]’ => “0”
‘1.3.6.1.4.1.25053.1.2.2.1.1.2.2.1.9.[6.108.170.179.26.66.144].[1]’ => “0”

Antenna MAC Address
‘1.3.6.1.4.1.25053.1.2.2.1.1.2.2.1.1.[6.108.170.179.26.66.144].[0]’ => “lª³B”
‘1.3.6.1.4.1.25053.1.2.2.1.1.2.2.1.1.[6.108.170.179.26.66.144].[1]’ => “lª³B”

Antenna Mesh Enabled (1 – Yes, 2 = No)
‘1.3.6.1.4.1.25053.1.2.2.1.1.2.2.1.6.[6.108.170.179.26.66.144].[0]’ => “2”
‘1.3.6.1.4.1.25053.1.2.2.1.1.2.2.1.6.[6.108.170.179.26.66.144].[1]’ => “2”

Power Management Enabled (1 = Yes, 0 = No)
‘1.3.6.1.4.1.25053.1.2.2.1.1.2.2.1.18.[6.108.170.179.26.66.144].[0]’ => “1”
‘1.3.6.1.4.1.25053.1.2.2.1.1.2.2.1.18.[6.108.170.179.26.66.144].[1]’ => “1”

Max. Number of Clients Allowed
‘1.3.6.1.4.1.25053.1.2.2.1.1.2.2.1.19.[6.108.170.179.26.66.144].[0]’ => “256”
‘1.3.6.1.4.1.25053.1.2.2.1.1.2.2.1.19.[6.108.170.179.26.66.144].[1]’ => “256”

Antenna Rx Packets
‘1.3.6.1.4.1.25053.1.2.2.1.1.2.2.1.10.[6.108.170.179.26.66.144].[0]’ => “1047794”
‘1.3.6.1.4.1.25053.1.2.2.1.1.2.2.1.10.[6.108.170.179.26.66.144].[1]’ => “5447”

Antenna Rx Bytes
‘1.3.6.1.4.1.25053.1.2.2.1.1.2.2.1.11.[6.108.170.179.26.66.144].[0]’ => “223745214”
‘1.3.6.1.4.1.25053.1.2.2.1.1.2.2.1.11.[6.108.170.179.26.66.144].[1]’ => “1050697”

Antenna Tx Packets
‘1.3.6.1.4.1.25053.1.2.2.1.1.2.2.1.13.[6.108.170.179.26.66.144].[0]’ => “42252”
‘1.3.6.1.4.1.25053.1.2.2.1.1.2.2.1.13.[6.108.170.179.26.66.144].[1]’ => “6080”

Antenna Tx Bytes
‘1.3.6.1.4.1.25053.1.2.2.1.1.2.2.1.14.[6.108.170.179.26.66.144].[0]’ => “8941040”
‘1.3.6.1.4.1.25053.1.2.2.1.1.2.2.1.14.[6.108.170.179.26.66.144].[1]’ => “921628”

Number of Tx Fails
‘1.3.6.1.4.1.25053.1.2.2.1.1.2.2.1.16.[6.108.170.179.26.66.144].[0]’ => “0”
‘1.3.6.1.4.1.25053.1.2.2.1.1.2.2.1.16.[6.108.170.179.26.66.144].[1]’ => “0”

Number of Tx Retries
‘1.3.6.1.4.1.25053.1.2.2.1.1.2.2.1.17.[6.108.170.179.26.66.144].[0]’ => “2875”
‘1.3.6.1.4.1.25053.1.2.2.1.1.2.2.1.17.[6.108.170.179.26.66.144].[1]’ => “8”

Authentication Requests
‘1.3.6.1.4.1.25053.1.2.2.1.1.2.2.1.25.[6.108.170.179.26.66.144].[0]’ => “1”
‘1.3.6.1.4.1.25053.1.2.2.1.1.2.2.1.25.[6.108.170.179.26.66.144].[1]’ => “0”

Authentication Responses
‘1.3.6.1.4.1.25053.1.2.2.1.1.2.2.1.26.[6.108.170.179.26.66.144].[0]’ => “1”
‘1.3.6.1.4.1.25053.1.2.2.1.1.2.2.1.26.[6.108.170.179.26.66.144].[1]’ => “0”

Authentication Success
‘1.3.6.1.4.1.25053.1.2.2.1.1.2.2.1.27.[6.108.170.179.26.66.144].[0]’ => “1”
‘1.3.6.1.4.1.25053.1.2.2.1.1.2.2.1.27.[6.108.170.179.26.66.144].[1]’ => “0”

Authentication Failed
‘1.3.6.1.4.1.25053.1.2.2.1.1.2.2.1.28.[6.108.170.179.26.66.144].[0]’ => “0”
‘1.3.6.1.4.1.25053.1.2.2.1.1.2.2.1.28.[6.108.170.179.26.66.144].[1]’ => “0”

Support for Ruckus Wireless Controllers added to Nectus

,

Support for  Ruckus Wireless Controllers was added to Nectus.

AP Name:    1.3.6.1.4.1.25053.1.2.2.1.1.2.1.1.2

AP Name:    1.3.6.1.4.1.25053.1.2.2.1.1.2.1.1.2

AP Model:    1.3.6.1.4.1.25053.1.2.2.1.1.2.1.1.4

Operation Status: 1.3.6.1.4.1.25053.1.2.2.1.1.2.1.1.3   (0 = Down, 1 = Up,  2,3,4 = Prep)

Connected Clients:      1.3.6.1.4.1.25053.1.2.2.1.1.2.1.1.15

Coverage: 1.3.6.1.4.1.25053.1.2.2.1.1.2.1.1.59  (1 = Indoor, 2 = Indoor-Distribute, 3 = Outdoor)

Connection mode:      1.3.6.1.4.1.25053.1.2.2.1.1.2.1.1.17  (0 = Layer2, 1 = Layer3)

Serial Number:    1.3.6.1.4.1.25053.1.2.2.1.1.2.1.1.5

Software Version:    1.3.6.1.4.1.25053.1.2.2.1.1.2.1.1.7

HW Version:          1.3.6.1.4.1.25053.1.2.2.1.1.2.1.1.8

Uptime:              1.3.6.1.4.1.25053.1.2.2.1.1.2.1.1.6

CPU Utilization:    1.3.6.1.4.1.25053.1.2.2.1.1.2.1.1.29

MAC Address:    1.3.6.1.4.1.25053.1.2.2.1.1.2.1.1.1

IP Address:    1.3.6.1.4.1.25053.1.2.2.1.1.2.1.1.10

Mask:    1.3.6.1.4.1.25053.1.2.2.1.1.2.1.1.100

Gateway:    1.3.6.1.4.1.25053.1.2.2.1.1.2.1.1.101

DNS Server 1:    1.3.6.1.4.1.25053.1.2.2.1.1.2.1.1.105

DNS Server 2:    1.3.6.1.4.1.25053.1.2.2.1.1.2.1.1.106

Max Number of Clients:    1.3.6.1.4.1.25053.1.2.2.1.1.2.1.1.110

Rogue Clients:    1.3.6.1.4.1.25053.1.2.2.1.1.2.1.1.16

Wireless Bytes Rx:    1.3.6.1.4.1.25053.1.2.2.1.1.2.1.1.61

Wireless Bytes Tx:    1.3.6.1.4.1.25053.1.2.2.1.1.2.1.1.62

LAN Bytes Rx:    1.3.6.1.4.1.25053.1.2.2.1.1.2.1.1.21

LAN Bytes Tx:    1.3.6.1.4.1.25053.1.2.2.1.1.2.1.1.25

LAN Drops:    1.3.6.1.4.1.25053.1.2.2.1.1.2.1.1.53

LAN Flaps:    1.3.6.1.4.1.25053.1.2.2.1.1.2.1.1.39

Wireless Heat Map Vizualization added to Nectus starting from build 1.2.24

, ,

Nectus goes wireless. Starting from version 1.2.24  we added support for Cisco Wireless.

Powerful dashboards and RSSI heatmaps now available to all Nectus customers.    Download your copy of Nectus