In this article, we will show how to control the access rights to specific network devices visible in Nectus.
We will create a user group “Texas Admins” that have access only to specific subset of SNMP devices “Texas Network Devices” in Nectus database.
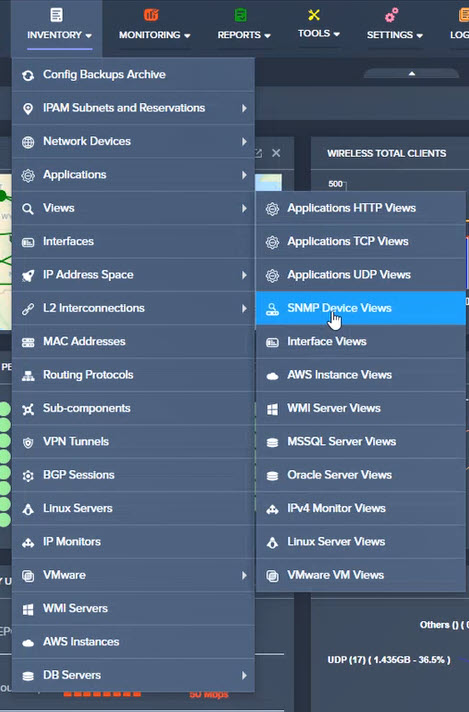
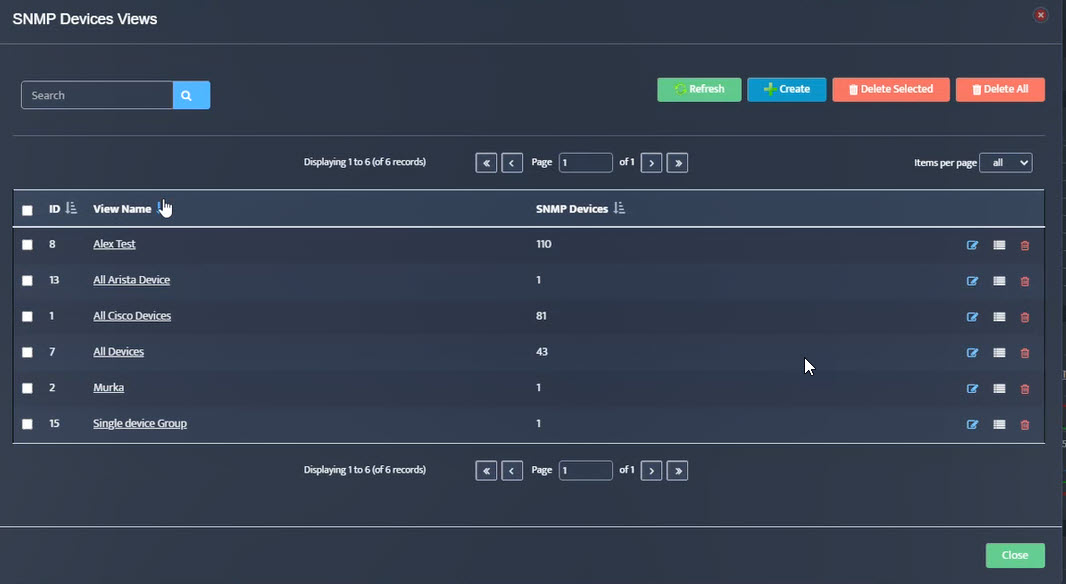
Step 1. Create a custom SNMP device view “Texas Network Devices” in Inventory -> Views -> SNMP Device Views
Step 2. The SNMP Devices Views window opens. Click on Create.
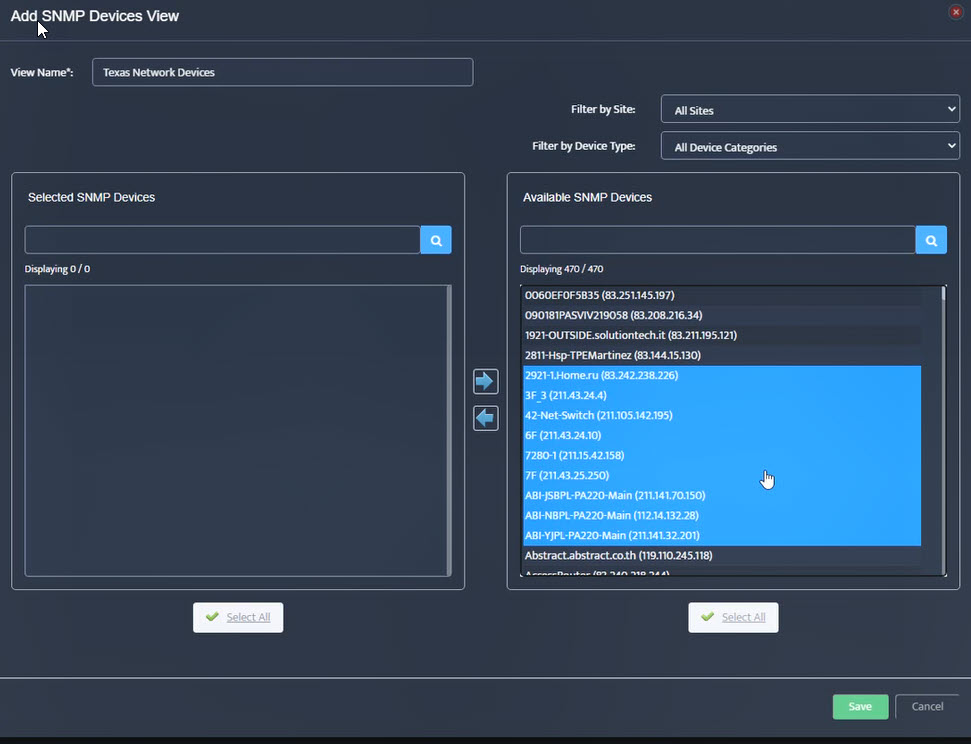
Step 3. The Add SNMP Devices View window opens. Give the view a name “Texas Network Devices”.
Select desired devices in the window on the right (Available SNMP devices).
When all are selected, click on the Left Arrow key ![]() to move the selected devices from the Available window to the Selected window.
to move the selected devices from the Available window to the Selected window.
We selected nine devices.
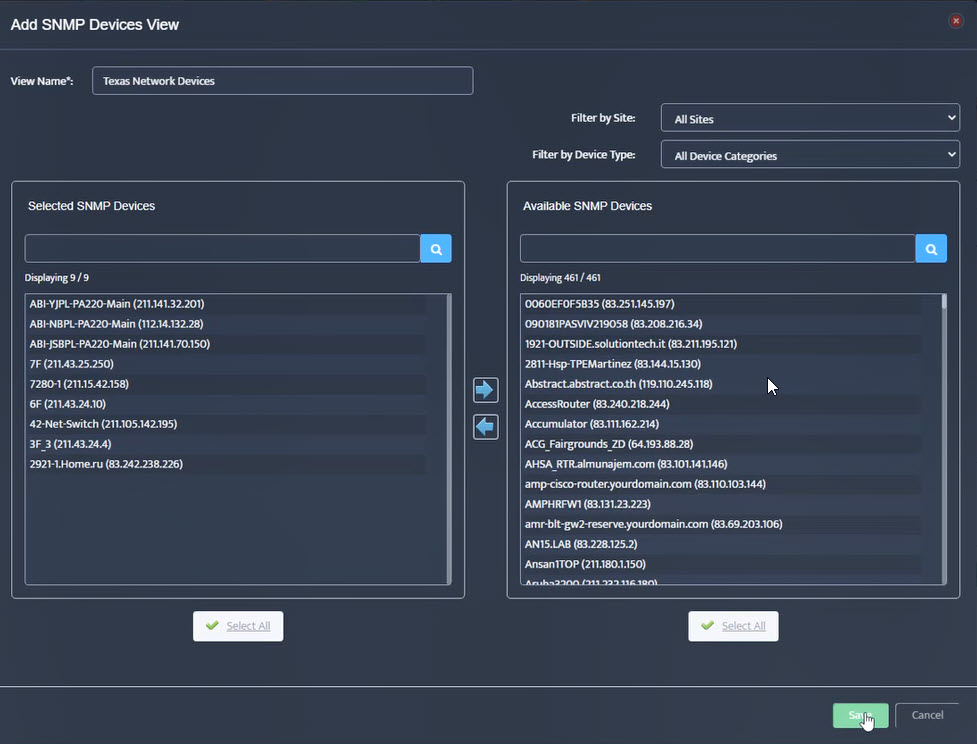
Step 4. Selected devices move into the Selected SNMP Devices window. Click Save.
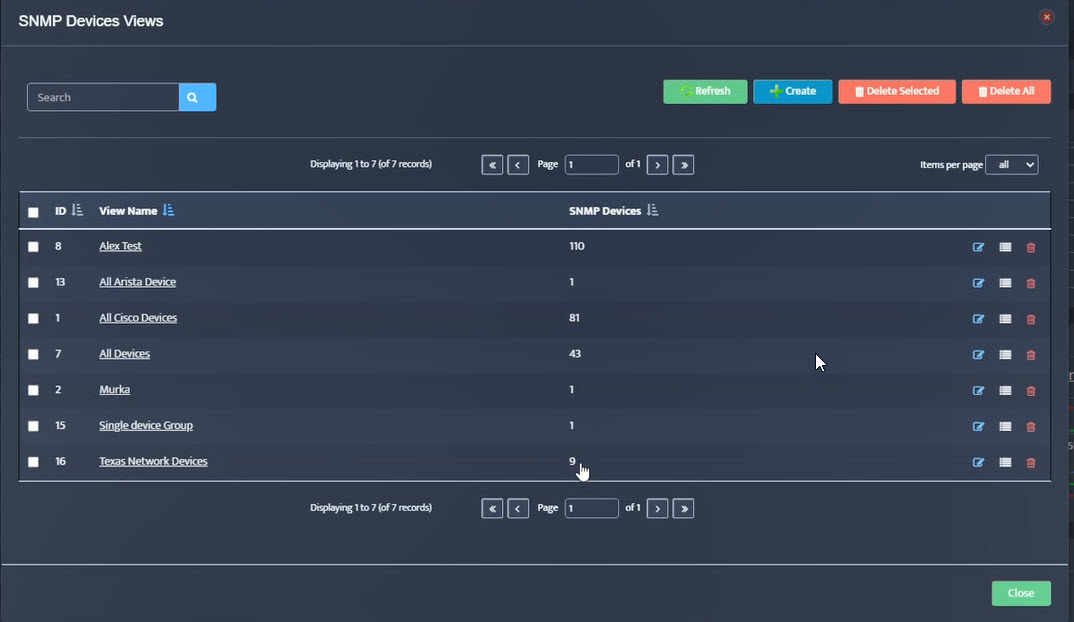
Step 5. Looking in the SNMP Devices Views window, we see that the view “Texas Network Devices” has been created and has nine devices.
Step 6. Create Admin User group “Texas Admins” in Settings-> Admin Accounts
.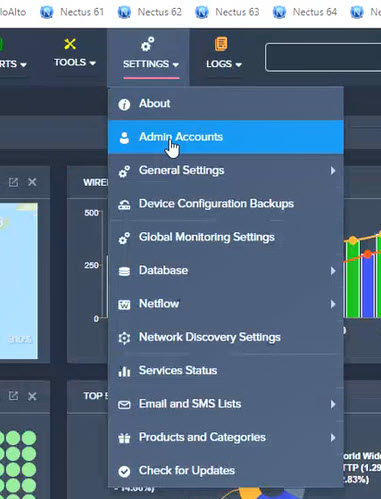
Step 7. Navigate to Settings → Admin Accounts.
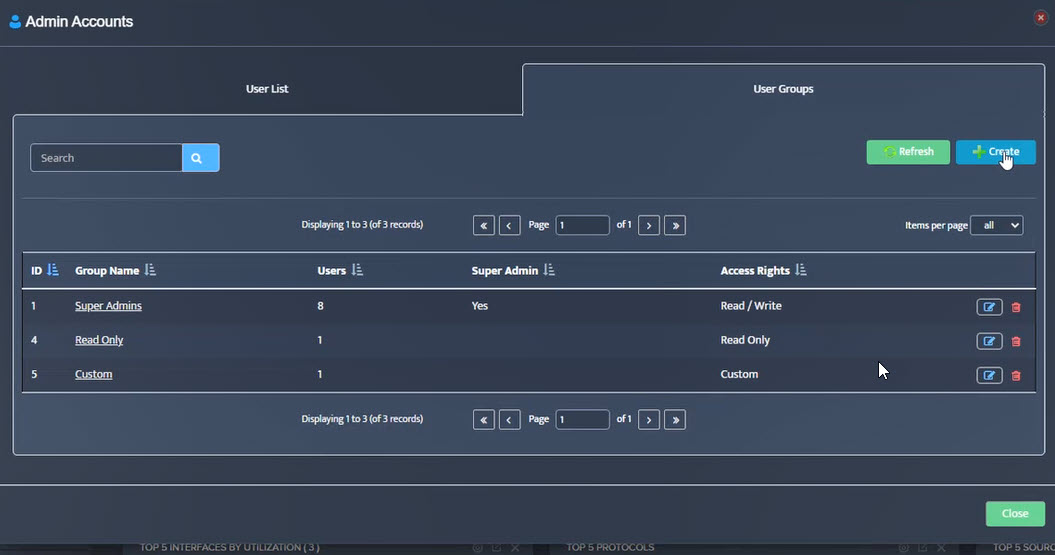
Step 8. The Admin Accounts window opens. Select User Groups, and click Create.
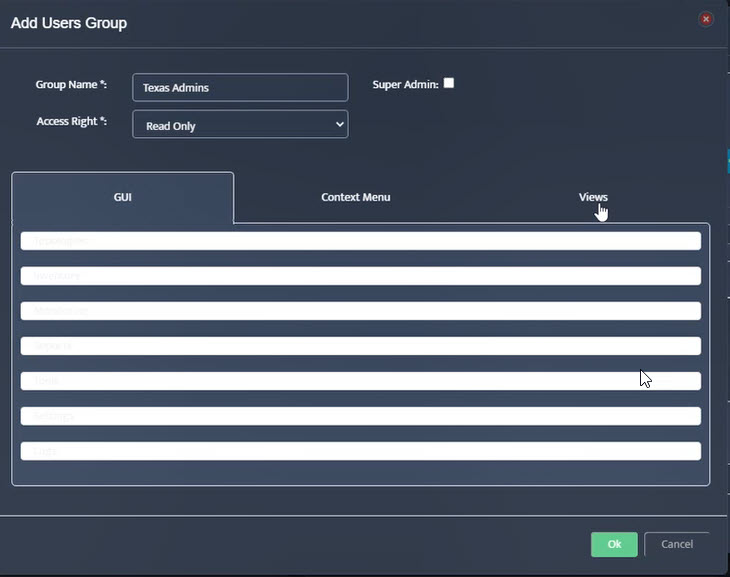
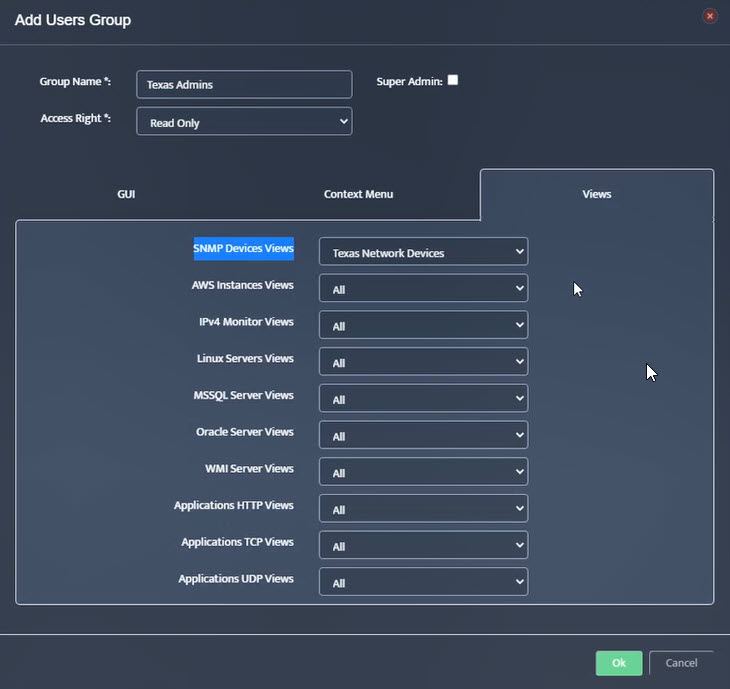
Step 9. The Add Users Group window opens. Enter the Group Name (Texas Admins), select the Access Right (Read Only), click Views.
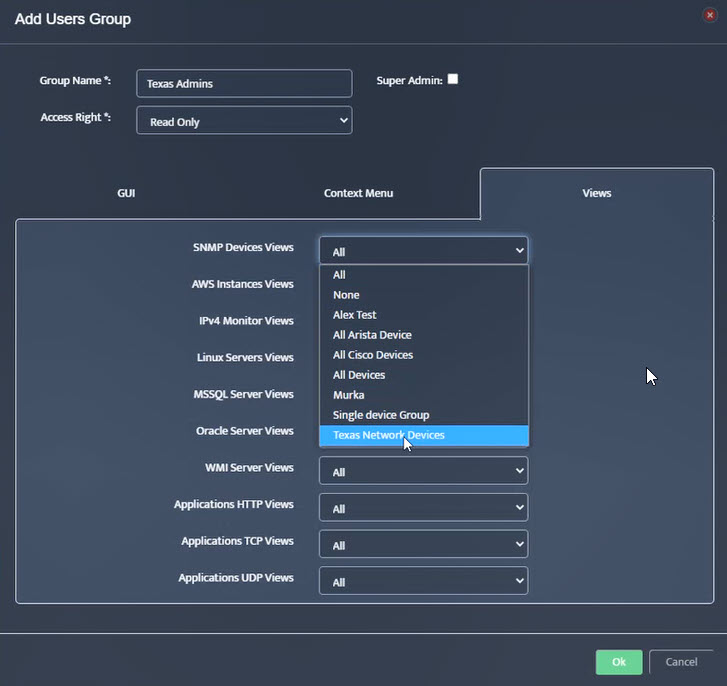
Step 10. Select desired View “Texas Network Devices” that members of this Admin group can see.
Step 11. Click OK.
Step 12. Create User in “Texas Admins” Group.
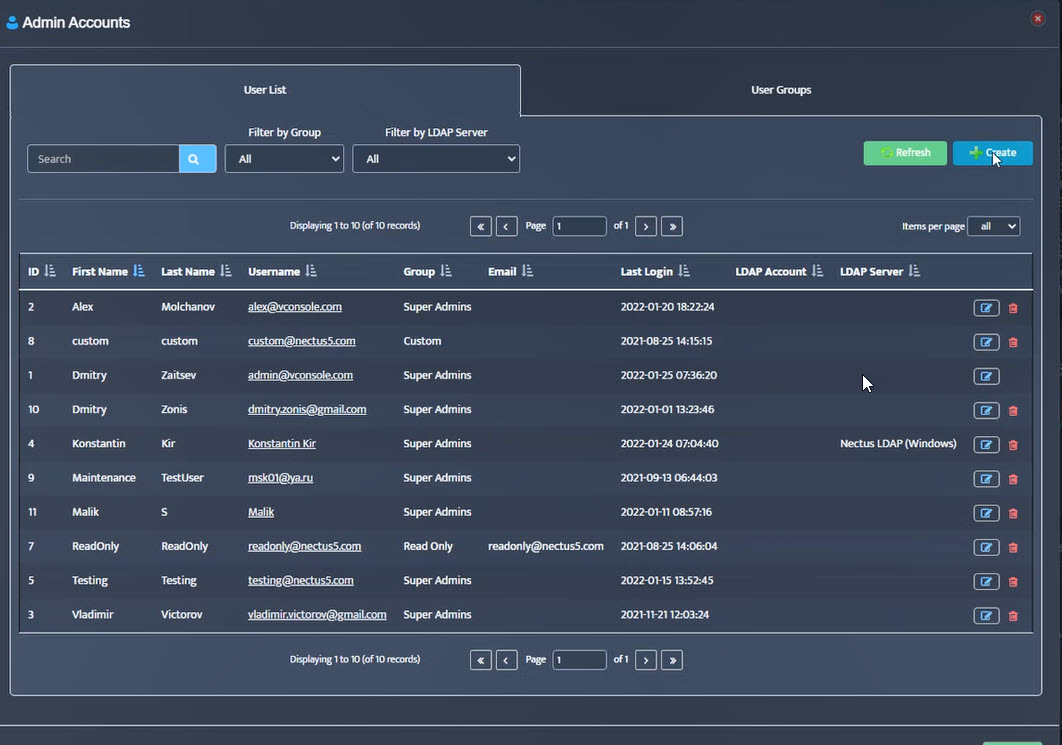
Step 13. In the Admin Accounts window, click on User List and click Create.
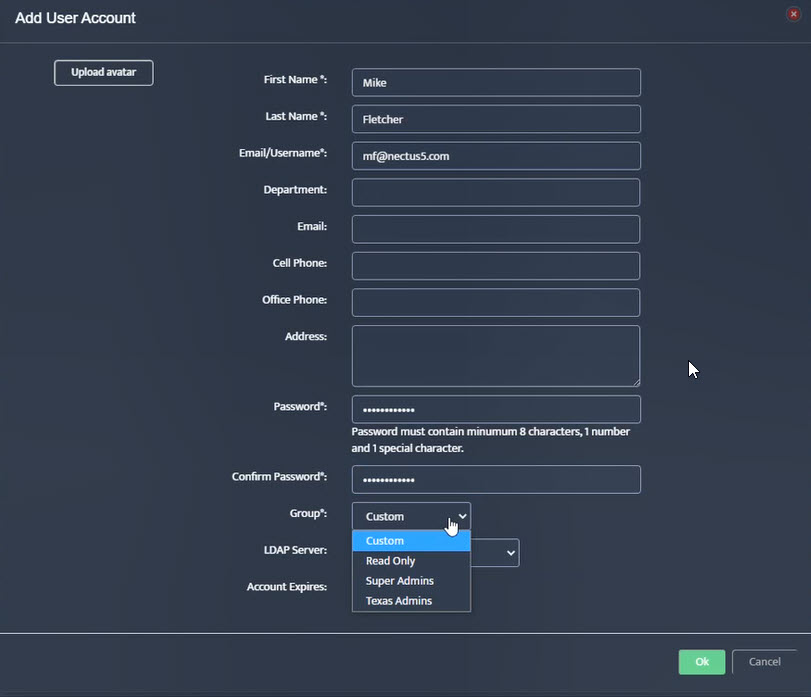
Step 14. The Add User Account window opens.
Fill in the fields (First Name, Last Name, Email/Username).
Create and confirm password. Assign to group (Texas Admins). Click OK.
Step 15. In Admin Accounts window, verify that new user (Mike Fletcher) now appears with Group Texas Admins.
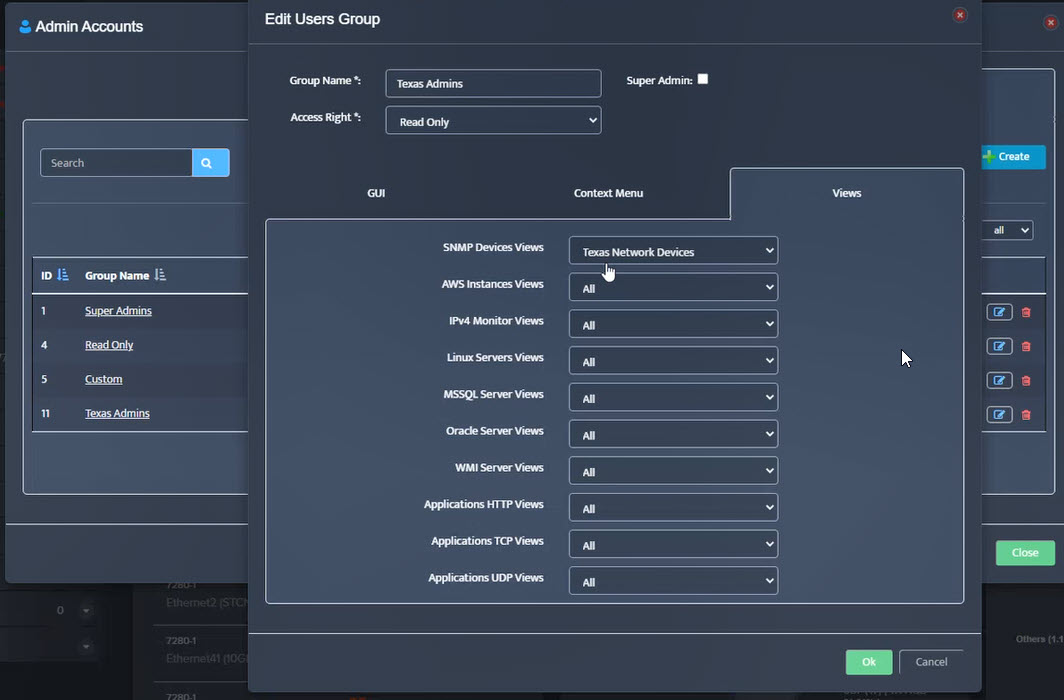
Step 16. In the Admin Accounts window, click User Groups and click on Texas Admins.
Verify the assigned view for SNMP Devices Views is Texas Network Devices.
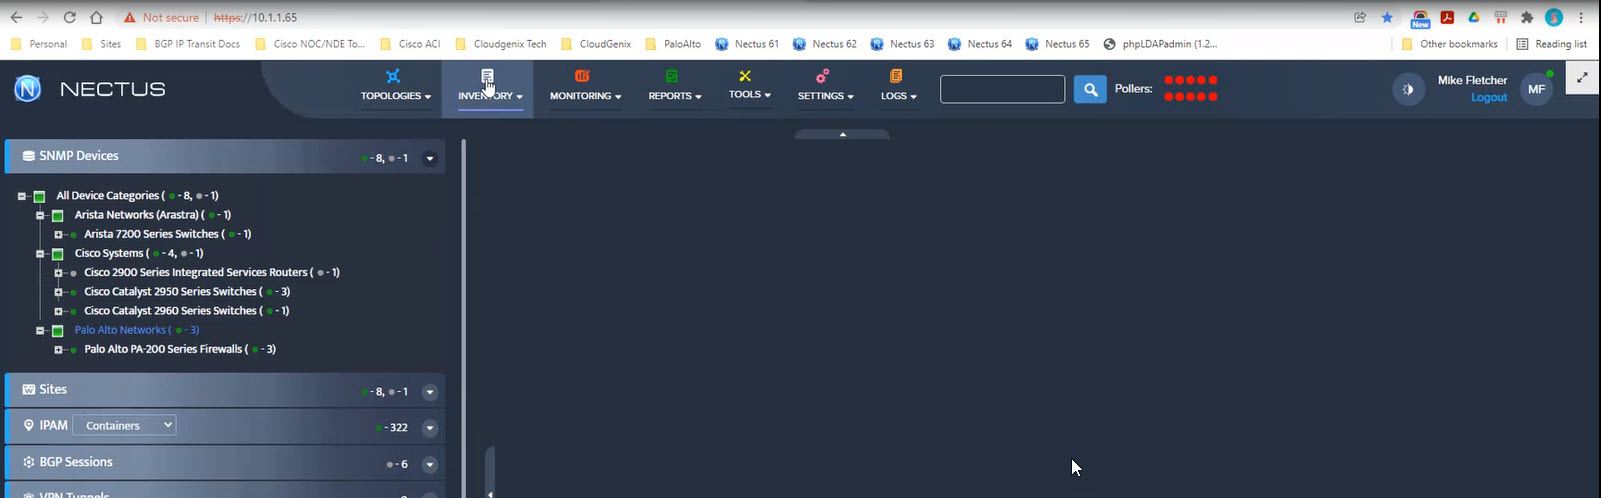
Step 17. Logout and log back in as Mike Fletcher.
In the Inventory window under SNMP Devices you should only see the 9 devices assigned to “Texas Network Devices”.