Nectus to Azure Integration: A Comprehensive Guide
Sign in to Azure Portal
Open your web browser, navigate to https://portal.azure.com, and sign in with your Azure account credentials.
Get Your Subscription ID
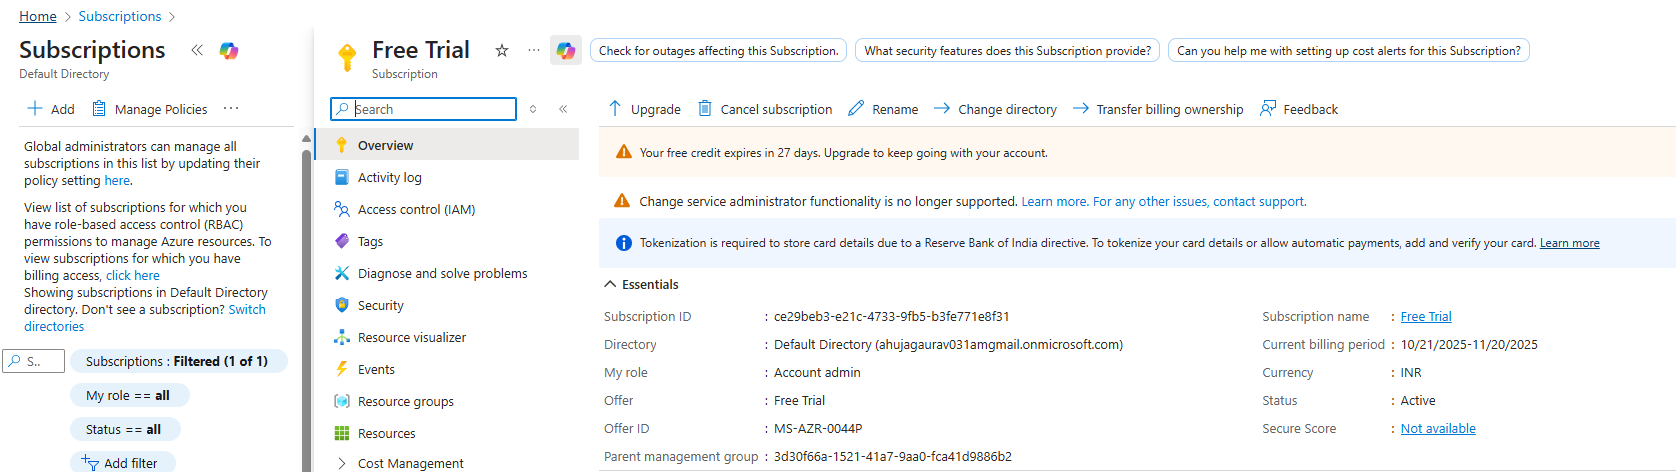
In the Azure Portal, search for “Subscriptions” in the top search bar and select your subscription. On the Overview page,
copy the Subscription ID (format: 12345678-1234-1234-1234-123456789012) – you’ll need this for Nectus configuration.
Get Your Tenant ID (Directory ID)
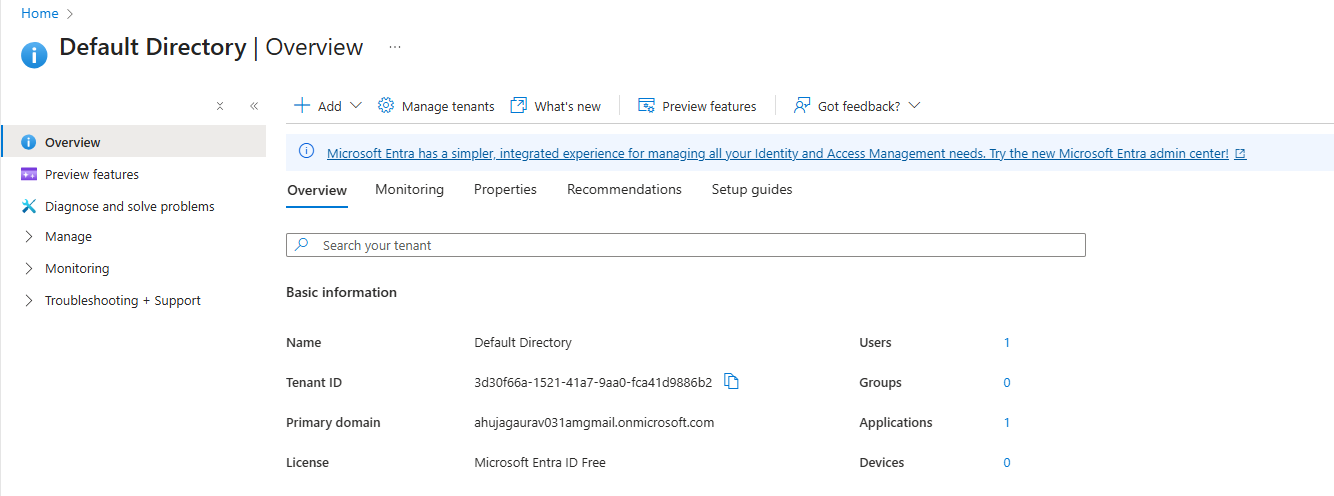
In the Azure Portal, search for “Microsoft Entra ID” in the search bar. On the overview page, locate the “Basic information”
section and copy the Tenant ID (also called Directory ID, format: 87654321-4321-4321-4321-210987654321).
Create Service Principal (App Registration)
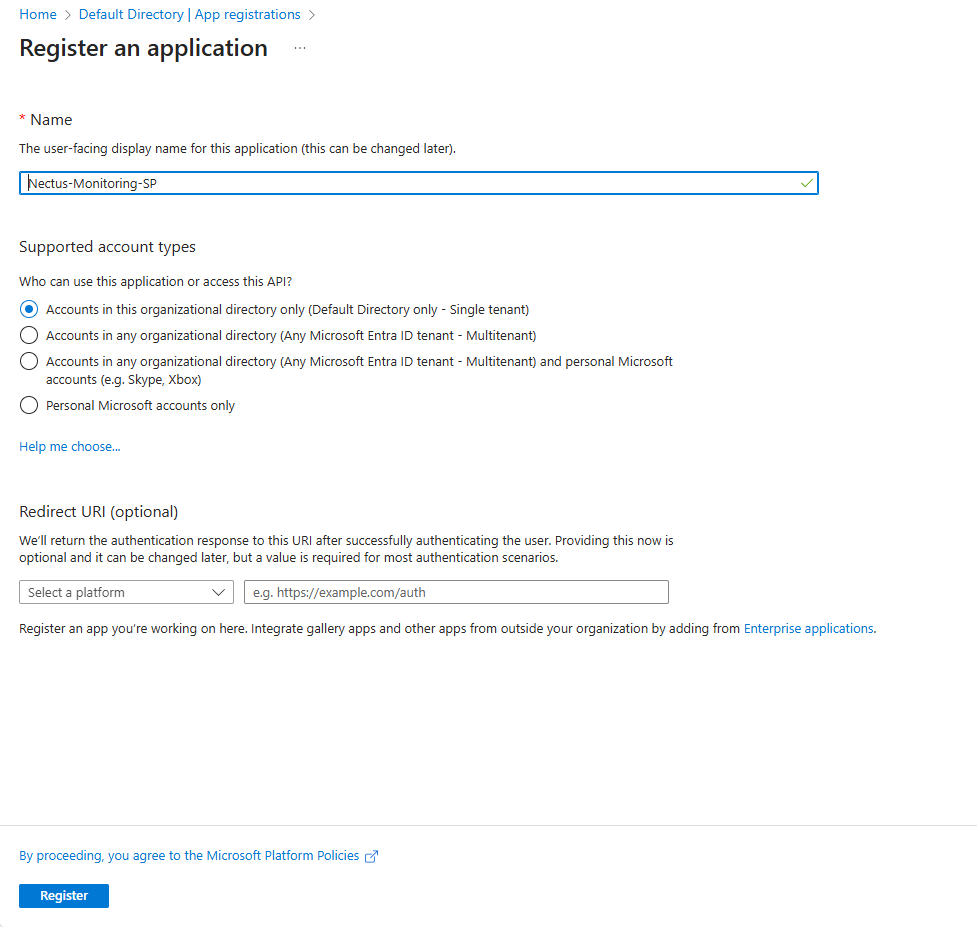
In Azure Portal, search for ” Microsoft Entra ID “, click “App registrations” under Manage, then click “+ New registration”.
Enter name “Nectus-Monitoring-SP”, select “Accounts in this organizational directory only”, leave Redirect URI blank, and click “Register”.
Get the Client ID (Application ID)
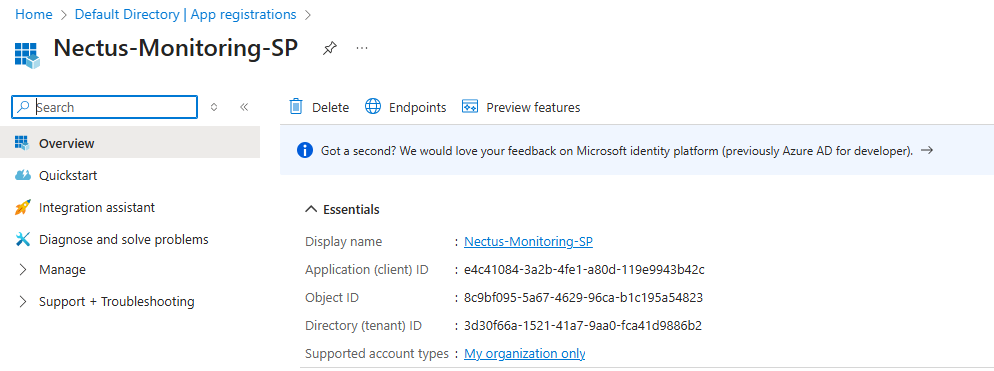
After registration, you’ll be on the app’s Overview page. Locate “Application (client) ID“,
click the copy icon to copy this value (format: abcd1234-5678-90ab-cdef-1234567890ab), and save it as your Client ID.
Create Client Secret
In the app registration page, click “Certificates & secrets” under Manage, then click “+ New client secret”.
Enter description “Nectus Integration Key”, choose expiration duration (6 months or 1 year recommended), and click “Add”.
IMPORTANT: Immediately copy the “Value” (not Secret ID) as you won’t be able to see it again
(format: 8Q8~XXXXXXXXXXXXXXXXXXXXXXXXXXXXXXXXXX), and save it securely.
Assign Reader Role to Service Principal
Navigate to Subscription IAM Go back to “Subscriptions” (search bar), click on your subscription name,
then click “Access control (IAM)” in the left menu.
Add Role Assignment Click “+ Add” button at the top, then select “Add role assignment”.
Select Reader Role In the “Role” tab, search for “Reader”, select the “Reader” role, and click “Next”.
Assign to Service Principal In the “Members” tab, select “User, group, or service principal” for “Assign access to”, click “+ Select members”,
search for “Nectus-Monitoring-SP”, click on it when it appears, click “Select”, then click “Next”.
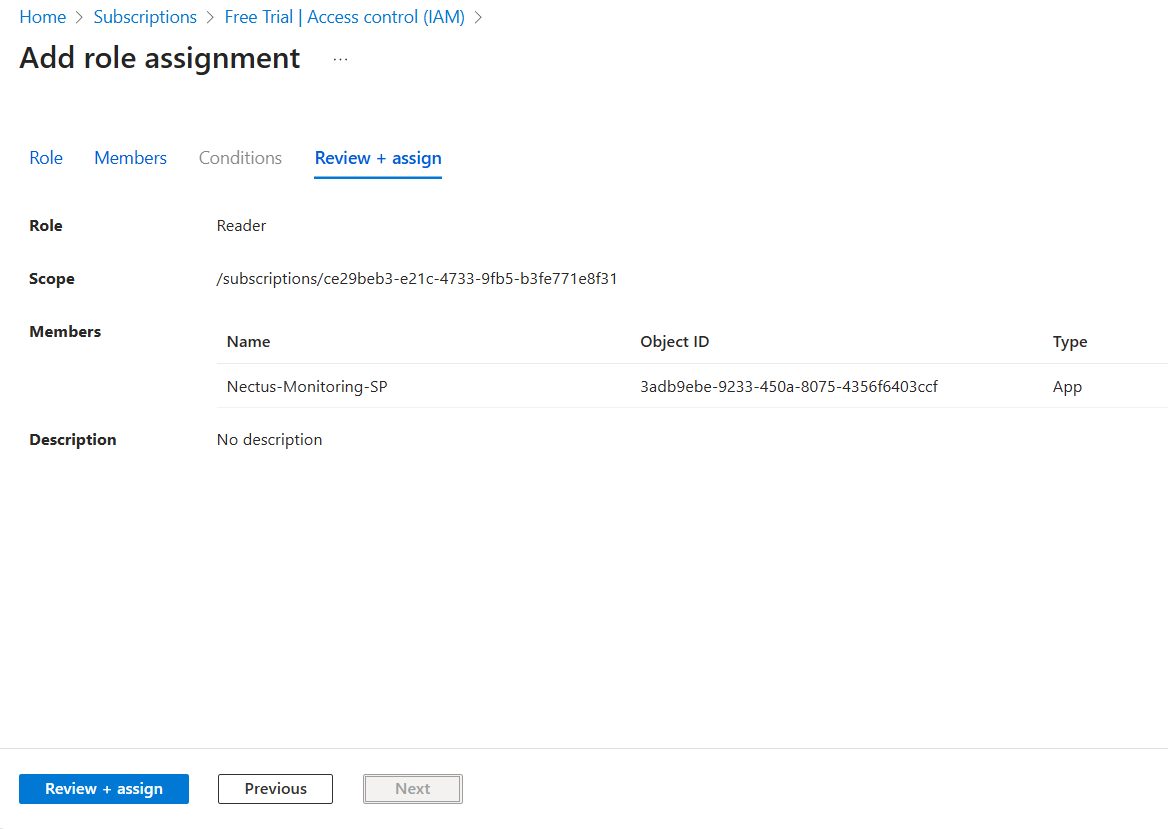
Review and Assign Review the assignment (Role: Reader, Scope: Your subscription, Members: Your service principal),
then click “Review + assign” twice to confirm.
Verify Everything is Set Up
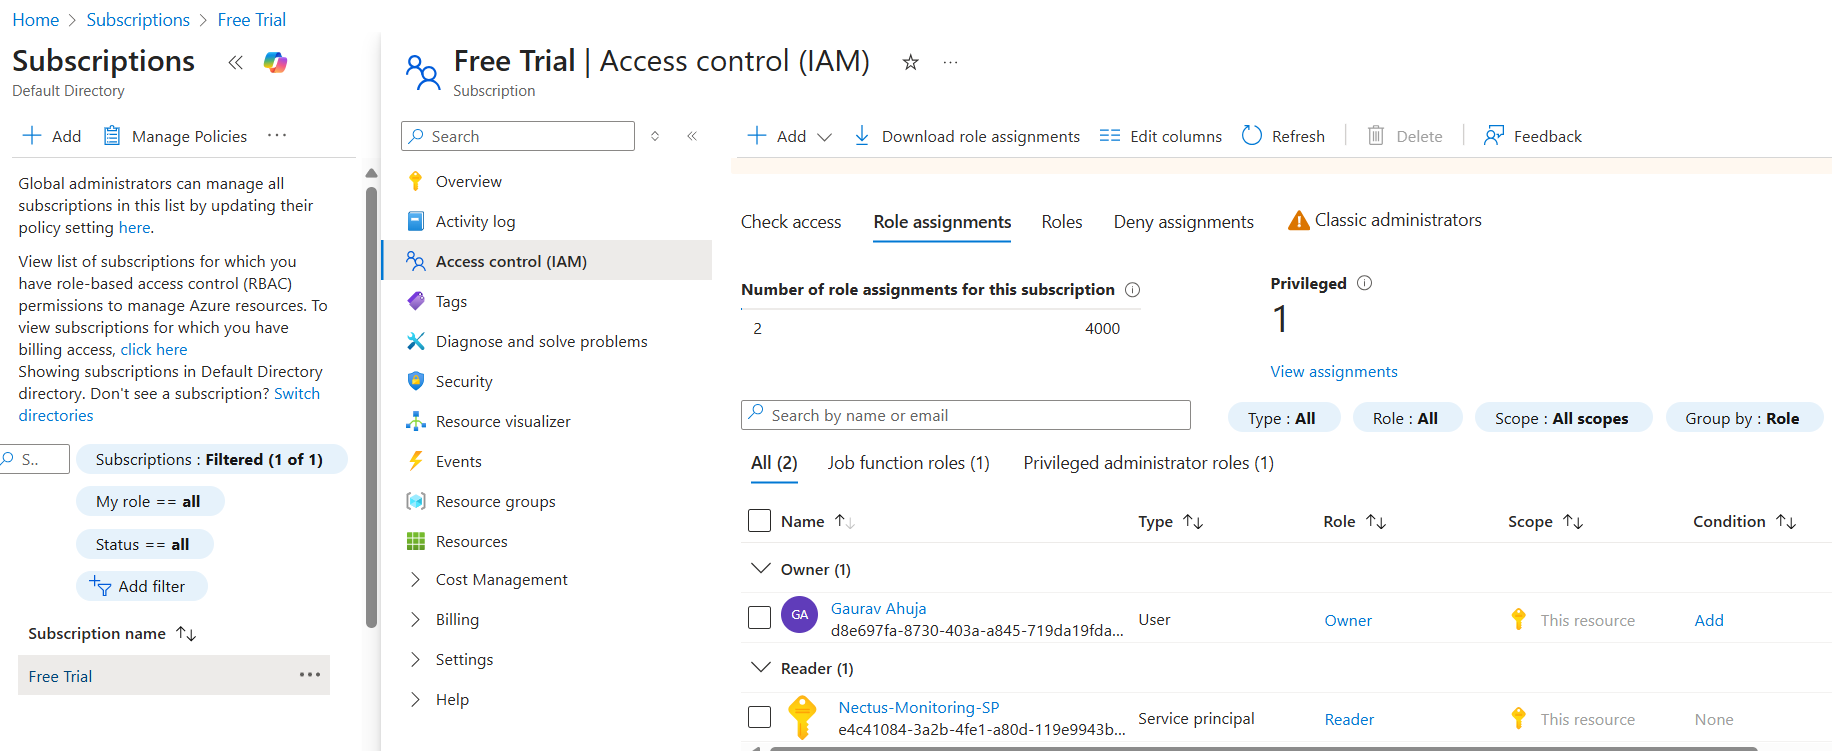
Go to Subscriptions > Your Subscription > Access control (IAM) > Role assignments tab to verify your service principal is listed with Reader role.
Access Nectus Azure Integration
Log in to the Nectus web console, click on Settings in the top navigation bar, select General Settings, then click on Azure Integration.
Add Azure Subscription in Nectus
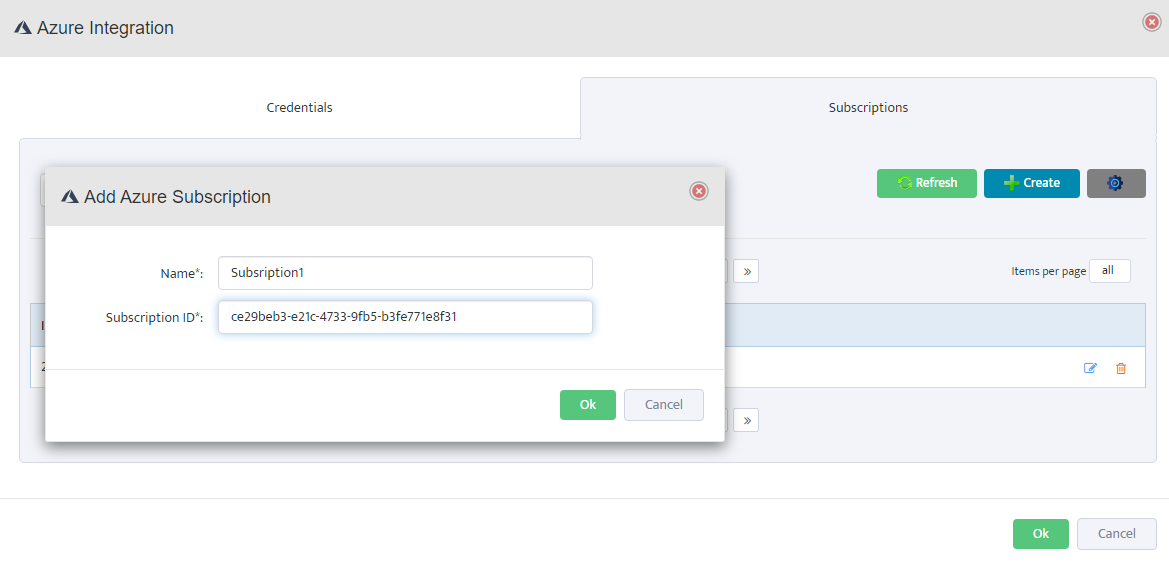
In the Azure Integration console, click on the Subscriptions tab, then click Create. Enter a descriptive name (e.g., “Subscription1”)
and your Azure Subscription ID, then click OK to save.
Add Azure Credentials in Nectus
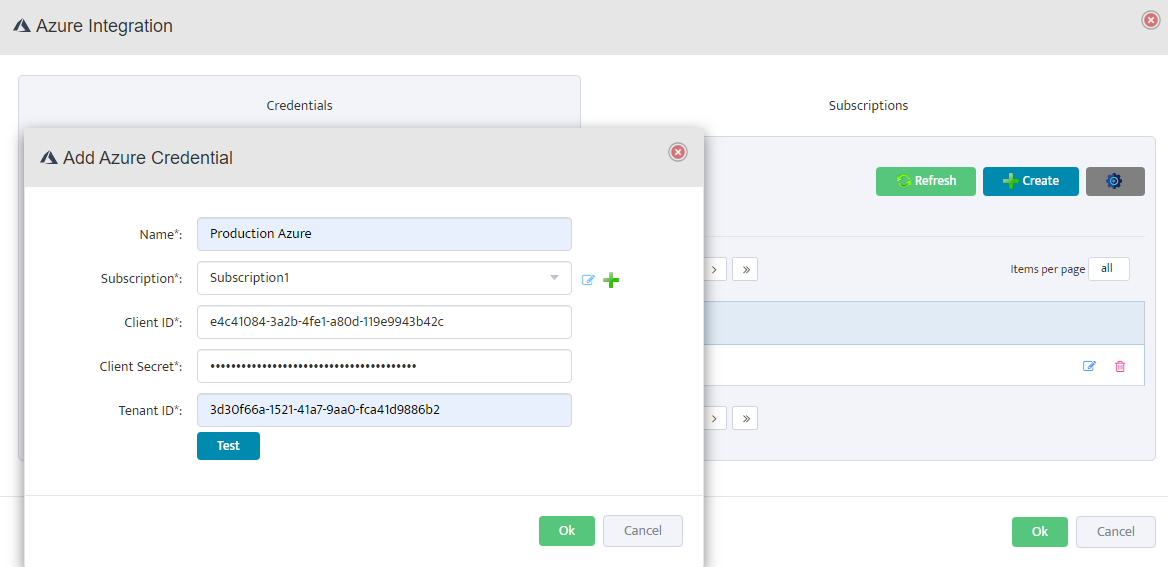
Click on the Credentials tab, then click Create. Enter a descriptive name, select the subscription from the dropdown,
and fill in the Client ID, Client Secret, and Tenant ID from the service principal created in Step 4-6.
Test and Validate Credentials
Click Test to validate the credentials. The test authenticates with Azure Active Directory, verifies subscription access, checks API connectivity,
and validates permissions. If successful, you’ll see a Test Success message. Click OK to save.
Verify Azure Resource Discovery
Navigate to Azure > Default in the left sidebar. The system will automatically discover and display your Azure resources including Virtual Machines.
Configure VM Group Properties
Right-click on Default under Azure in the left sidebar and select Properties. In the General Info tab, enter the group name,
check Enable Monitoring, select the polling agent (typically “Default”), and configure optional settings like ICMP monitoring profile and alert notifications. Click OK to save.
Configure Monitoring Settings
Click on Monitoring in the top navigation menu, then select Azure Monitoring Settings. Configure the following metrics for your Azure resources:
CPU Monitoring: Enable CPU Credits Consumed, CPU Credits Remaining, and CPU Utilization.
Configure thresholds, enable history, and set up email/SMS alerts as needed.
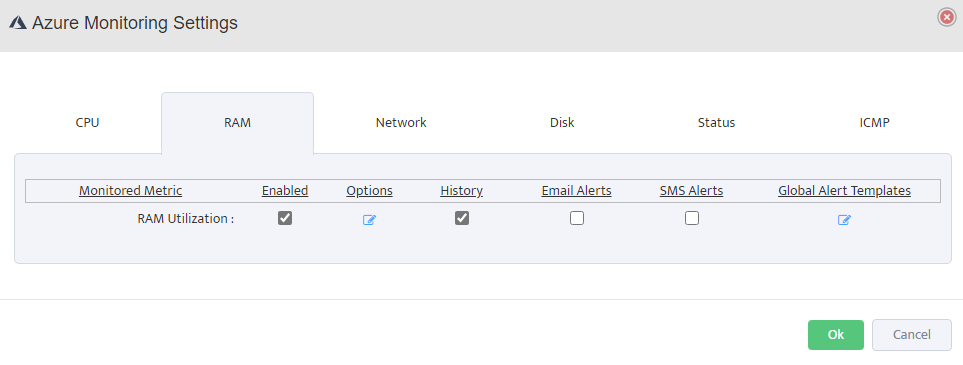
RAM Monitoring: Enable RAM Utilization monitoring, set alert thresholds (e.g., warning at 80%, critical at 90%), and configure alert destinations.
Network Monitoring: Enable Network Rx (Receive) and Network Tx (Transmit) to monitor inbound and outbound traffic.
Track bandwidth utilization and set alerts for unusual network activity.
Disk Monitoring: Enable Disk Read/Write Transactions and Disk Read/Write Rate to monitor IOPS and throughput.
Configure appropriate thresholds based on your workload requirements.
Status Monitoring: Enable VM Availability monitoring to track uptime and set alerts for VM state changes or downtime events.
ICMP Monitoring: Enable ICMP IPv4 Latency and Reachability to verify network connectivity.
Set latency thresholds and configure packet loss alerts.
Nectus Feature Overview
UncategorizedNectus Feature Overview
Nectus Integration with Palo Alto Firewall API
Nectus Installation, Network Discovery, Network Monitoring, Technical Notes, UncategorizedNectus Integration with Palo Alto Firewall API
Step-by-Step Configuration Guide
Overview
This document provides a guide for Nectus integration with Palo Alto Networks firewalls.
The integration enables automated discovery and monitoring of Palo Alto firewall devices through API connectivity.
Prerequisites
Before beginning the integration process, ensure you have your Palo Alto firewall management IP address and administrative access.
You will also need to generate an API key from the Palo Alto firewall with appropriate permissions.
Configuration Steps
1. Generate API Key from Palo Alto Firewall
To generate an API key, make a POST request to the firewall’s hostname or IP address using the administrative credentials and type=keygen:
curl -H “Content-Type: application/x-www-form-urlencoded” -X POST https://firewall/api/?type=keygen -d ‘user=<user>&password=<password>’
Replace ‘firewall’ with your Palo Alto management IP address or hostname, and provide your administrative username and password.
A successful API call returns status=”success” along with the API key within the key element:
<response status=”success”>
<result>
<key>***********************************************</key> </result>
</response>
Copy the entire API key string including any symbols such as equal signs. This key will be used for authentication in Nectus configuration.
Note that if you generate a new key for the same user, all existing sessions will end and previous API sessions will be deleted.
2. Configure Palo Alto Firewall API Keys in Nectus
Open the Nectus console and navigate to Settings → Third-Party API Integration.
Click on the Palo Alto Firewall API tab to view the list of discovered Palo Alto firewalls.
The table displays columns for ID, SNMP Hostname, IPv4 Address, Enabled status, and Key.
For each firewall you want to monitor, click the + button to open the Add Palo Alto Firewall API Key dialog.
3. Add API Key and Test Connection
In the Add Palo Alto Firewall API Key dialog, check the box for Enable API Integration.
Paste the API key generated in Step 1 into the Firewall API Key field.
Click the Test button to verify the API connection. A Success message will appear if the connection is successful.
Click OK to save the configuration.
4. Save Configuration
Repeat Step 2 and Step 3 for each firewall you want to monitor.
After configuring API keys for all required firewalls, click Save All at the bottom of the Third-Party API Integration page to save all configurations.
Nectus will now begin monitoring your Palo Alto firewalls and collecting performance metrics, security events, and configuration data through the API.
Nectus Integration with ServiceNow
Nectus Installation, Technical NotesNectus Integration with ServiceNow
Step-by-Step Configuration Guide
Overview
This document provides a comprehensive guide for Nectus integration with ServiceNow.
The integration enables Nectus to automatically open and close incidents based on Nectus alerts.
Prerequisites
Before beginning the integration process, ensure you have your ServiceNow instance ID and username.
You will also need the password with appropriate read/write permissions.
Configuration Steps
Configuring ServiceNow Connection Settings
Open the Nectus console, navigate to Settings > General Settings > ServiceNow Integration, and select the Settings tab.
Enter your ServiceNow instance ID, username, and password, then click the Test button to verify the connection before proceeding.
Configuring CMDB Synchronization Settings
In the CMDB tab, configure synchronization by enabling the options to automatically create, update,
and remove devices between Nectus and ServiceNow, and optionally enable daily synchronization at
3:00 PM to keep your CMDB current without manual intervention.
Configuring Device Matching Parameters
Configure device matching parameters by selecting how Nectus identifies devices in ServiceNow—
choose from Device Hostname, Device IP Address, or Device Serial Number.
All selected parameters must match for accurate device identification.
Mapping Device Types to ServiceNow Tables
In the device type mapping section, configure how Nectus device types correspond to ServiceNow CMDB tables.
For each device type such as Router, Switch, Firewall, Server, Printer/Copier, Wireless AP/Bridge, Wireless Controller,
UPS/Power Infrastructure, IP Telephony, Video Camera, and Load Balancer, select the appropriate ServiceNow table from the dropdown menu.
Ensure these mappings align with your ServiceNow CMDB structure and naming conventions for proper device categorization.
Saving Configuration and Initial Synchronization
After configuring all settings, click OK to save your ServiceNow integration configuration.
To perform an immediate synchronization, return to the CMDB tab and click the Force CMDB CI Synchronization button,
then wait for the confirmation message indicating the sync is complete.
Viewing and Managing Synchronized Devices
After synchronization, navigate to the CMDB tab and click the Reference Table sub-tab to view all synchronized devices.
The table displays device information including Device ID, Device Name, Device IP, ServiceNow SysID,
Created and Updated timestamps, and the ServiceNow table where each CI is stored.
Use the filter options at the top to view devices by specific sites or device types, and use action buttons like Refresh,
Create, Delete Selected, or Delete All to manage synchronized devices.
Verification Steps
To verify the integration is working correctly, log in to your ServiceNow instance and navigate to the
Assets → Hardware Assets or the appropriate CMDB table to search for synchronized devices.
Verify that device details such as hostname, IP address, and serial number match the information displayed in Nectus.
Enable Automatic Incident Creation
Navigate to the Incidents tab in the ServiceNow Integration dialog and click the settings sub-tab.
Check the box for Enable Automatic Incident Creation to allow Nectus to automatically create incidents in ServiceNow when alerts are triggered.
Create Incident Rules
Click on the Rules sub-tab within the Incidents tab, then click the Create button to add a new incident rule.
In the Add ServiceNow Incident Rule dialog, enter a Rule Name and check the Enabled box to activate the rule.
Under Alert Conditions, select the alert Category (such as SNMP Devices Alerts),
define when to Create Incident if specific conditions are met, and optionally configure Close Incident if conditions for automatic resolution.
Configure Incident Parameters including Caller, Opened by, Category, Subcategory, Business Service, Contact Type,
Priority, Impact, Urgency, Severity and Assignment Group to ensure incidents are properly categorized and routed in ServiceNow. Click OK to save the incident rule.
Verify Incident Creation in ServiceNow
To verify the integration is working correctly, trigger an alert in Nectus (such as stopping a monitored service),
then check the Incidents → Reference Table tab to see the incident number.
Log in to ServiceNow and navigate to Incident → All to confirm the incident was created with the correct details.
Configuring Azure monitoring in Nectus
Application Monitoring, AWS Monitoring, Nectus Installation, Network MonitoringNectus to Azure Integration: A Comprehensive Guide
Sign in to Azure Portal
Open your web browser, navigate to https://portal.azure.com, and sign in with your Azure account credentials.
Get Your Subscription ID
In the Azure Portal, search for “Subscriptions” in the top search bar and select your subscription. On the Overview page,
copy the Subscription ID (format: 12345678-1234-1234-1234-123456789012) – you’ll need this for Nectus configuration.
Get Your Tenant ID (Directory ID)
In the Azure Portal, search for “Microsoft Entra ID” in the search bar. On the overview page, locate the “Basic information”
section and copy the Tenant ID (also called Directory ID, format: 87654321-4321-4321-4321-210987654321).
Create Service Principal (App Registration)
In Azure Portal, search for ” Microsoft Entra ID “, click “App registrations” under Manage, then click “+ New registration”.
Enter name “Nectus-Monitoring-SP”, select “Accounts in this organizational directory only”, leave Redirect URI blank, and click “Register”.
Get the Client ID (Application ID)
After registration, you’ll be on the app’s Overview page. Locate “Application (client) ID“,
click the copy icon to copy this value (format: abcd1234-5678-90ab-cdef-1234567890ab), and save it as your Client ID.
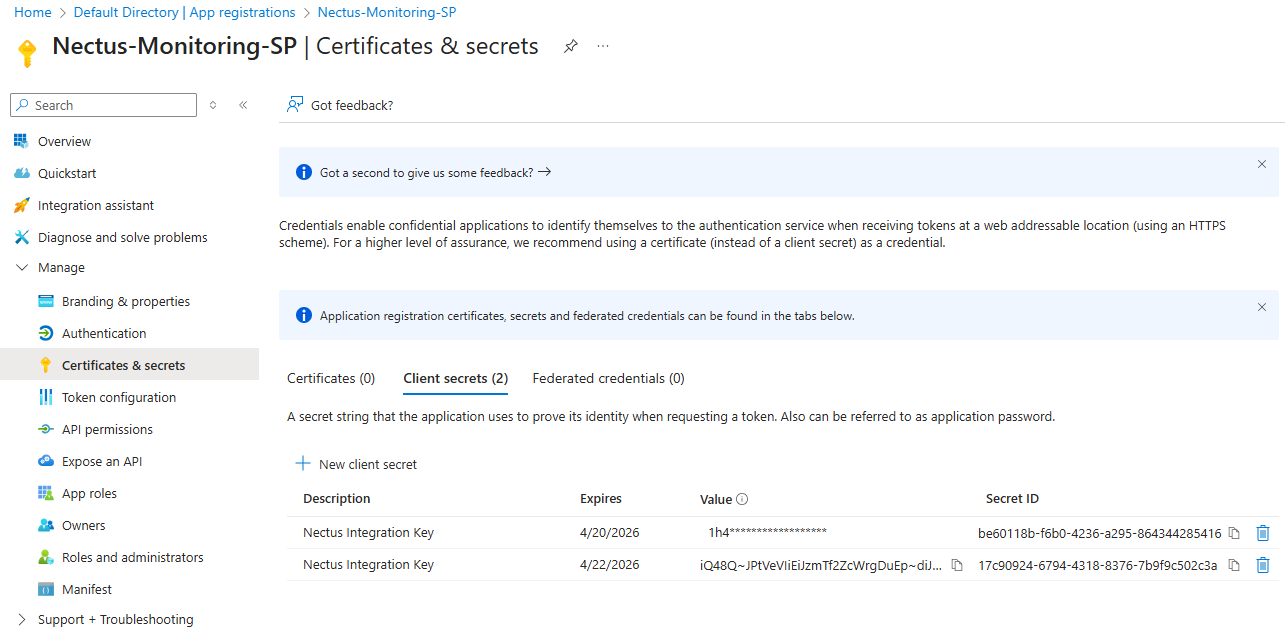
Create Client Secret
In the app registration page, click “Certificates & secrets” under Manage, then click “+ New client secret”.
Enter description “Nectus Integration Key”, choose expiration duration (6 months or 1 year recommended), and click “Add”.
IMPORTANT: Immediately copy the “Value” (not Secret ID) as you won’t be able to see it again
(format: 8Q8~XXXXXXXXXXXXXXXXXXXXXXXXXXXXXXXXXX), and save it securely.
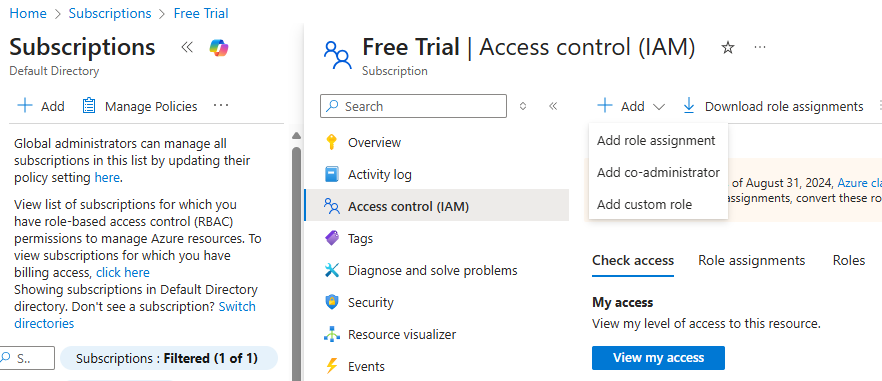
Assign Reader Role to Service Principal
Navigate to Subscription IAM Go back to “Subscriptions” (search bar), click on your subscription name,
then click “Access control (IAM)” in the left menu.
Add Role Assignment Click “+ Add” button at the top, then select “Add role assignment”.
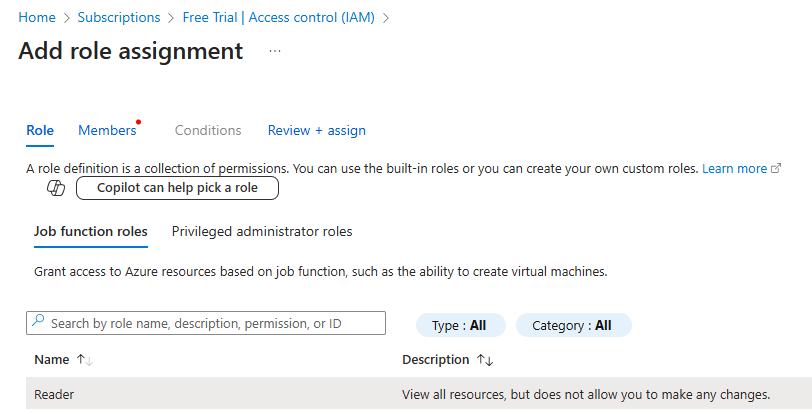
Select Reader Role In the “Role” tab, search for “Reader”, select the “Reader” role, and click “Next”.
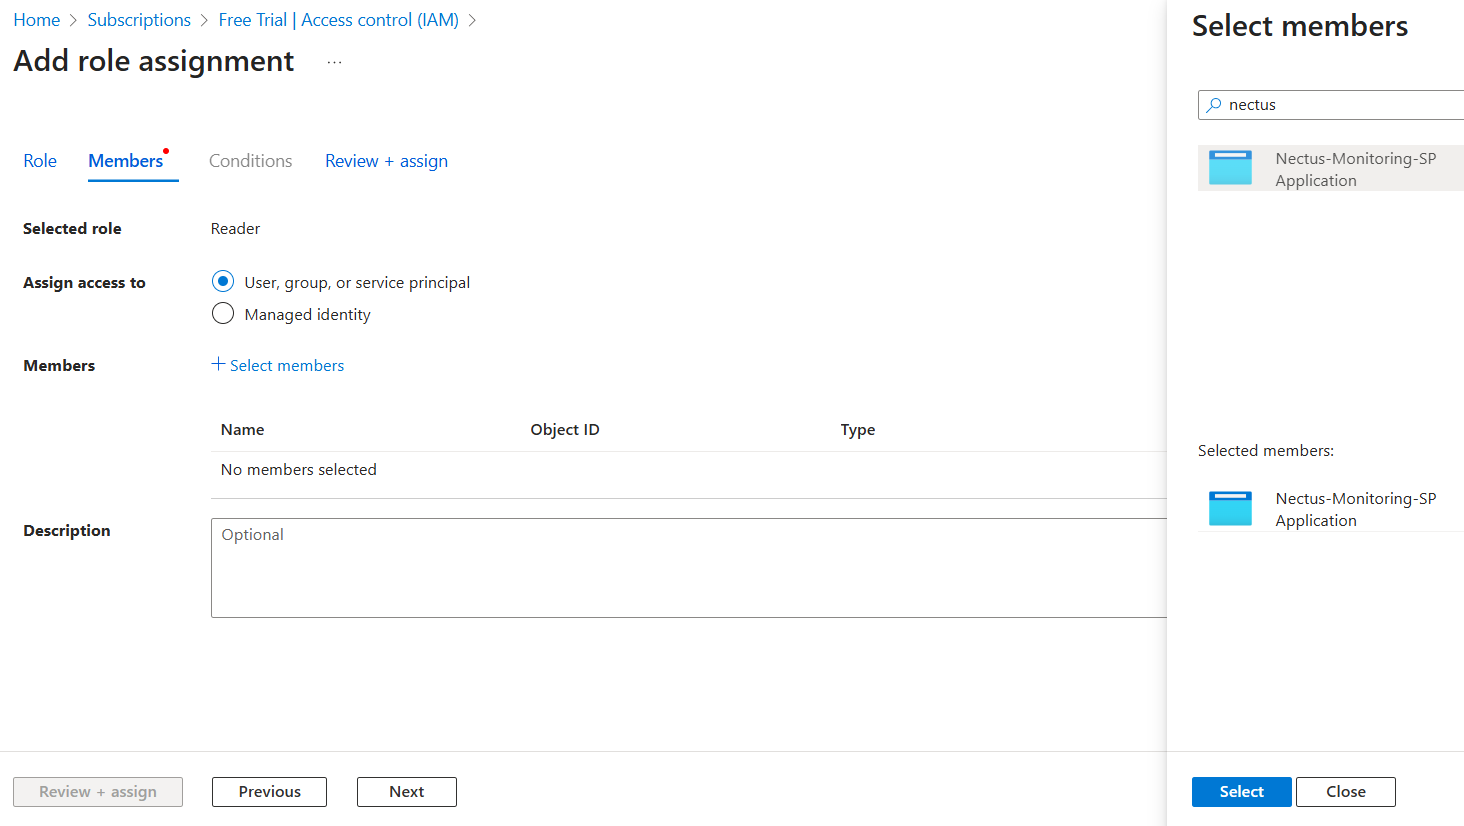
Assign to Service Principal In the “Members” tab, select “User, group, or service principal” for “Assign access to”, click “+ Select members”,
search for “Nectus-Monitoring-SP”, click on it when it appears, click “Select”, then click “Next”.
Review and Assign Review the assignment (Role: Reader, Scope: Your subscription, Members: Your service principal),
then click “Review + assign” twice to confirm.
Verify Everything is Set Up
Go to Subscriptions > Your Subscription > Access control (IAM) > Role assignments tab to verify your service principal is listed with Reader role.
Access Nectus Azure Integration
Log in to the Nectus web console, click on Settings in the top navigation bar, select General Settings, then click on Azure Integration.
Add Azure Subscription in Nectus
In the Azure Integration console, click on the Subscriptions tab, then click Create. Enter a descriptive name (e.g., “Subscription1”)
and your Azure Subscription ID, then click OK to save.
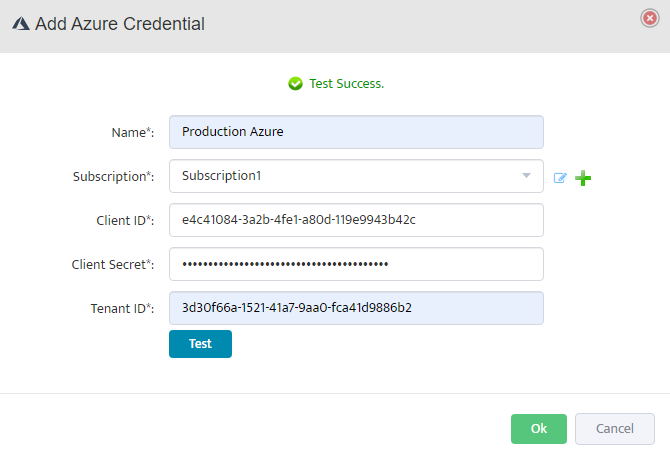
Add Azure Credentials in Nectus
Click on the Credentials tab, then click Create. Enter a descriptive name, select the subscription from the dropdown,
and fill in the Client ID, Client Secret, and Tenant ID from the service principal created in Step 4-6.
Test and Validate Credentials
Click Test to validate the credentials. The test authenticates with Azure Active Directory, verifies subscription access, checks API connectivity,
and validates permissions. If successful, you’ll see a Test Success message. Click OK to save.
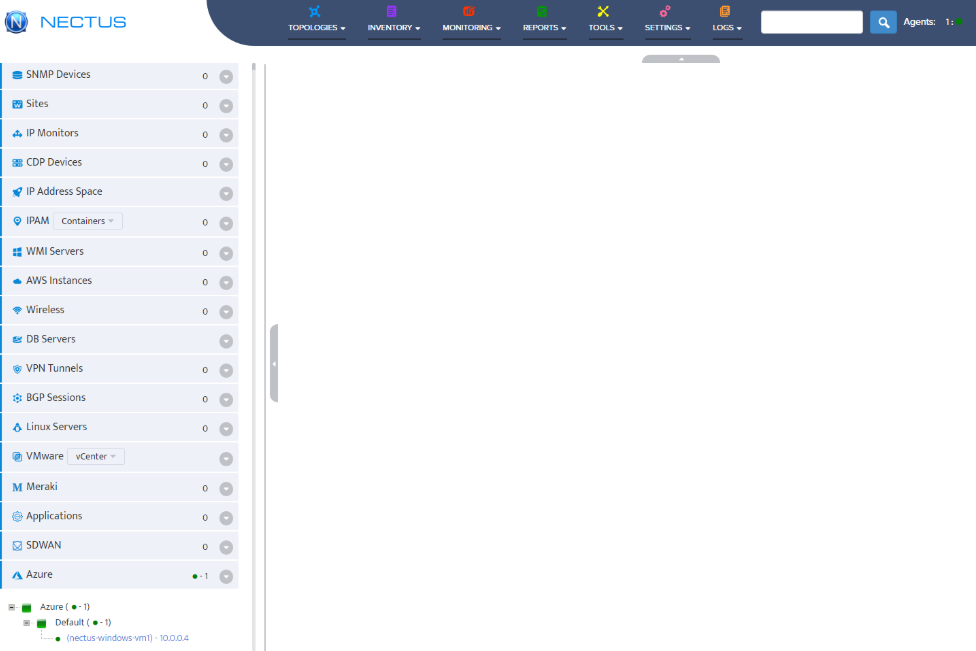
Verify Azure Resource Discovery
Navigate to Azure > Default in the left sidebar. The system will automatically discover and display your Azure resources including Virtual Machines.
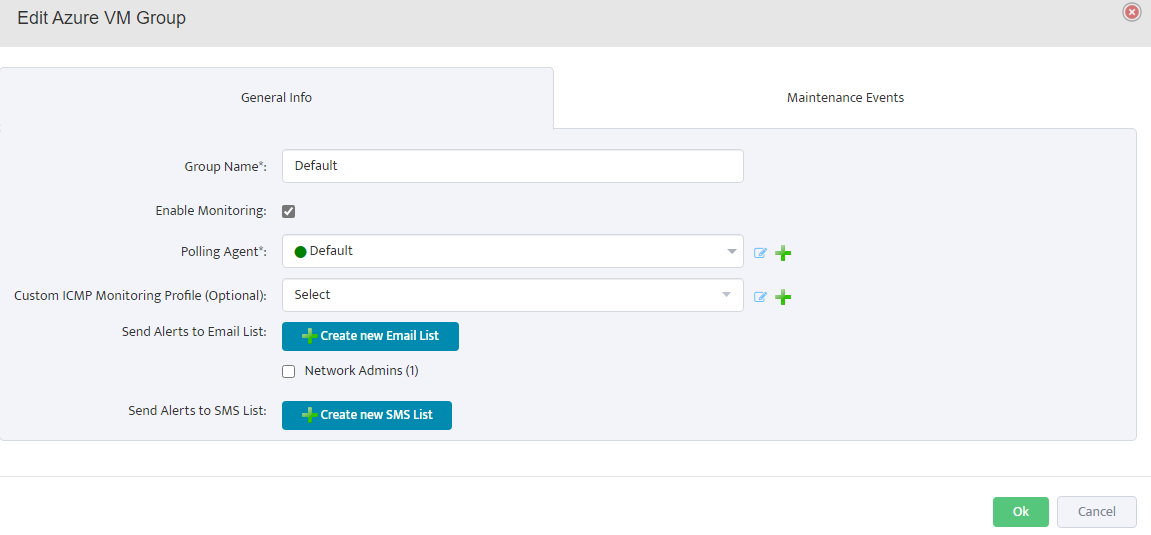
Configure VM Group Properties
Right-click on Default under Azure in the left sidebar and select Properties. In the General Info tab, enter the group name,
check Enable Monitoring, select the polling agent (typically “Default”), and configure optional settings like ICMP monitoring profile and alert notifications. Click OK to save.
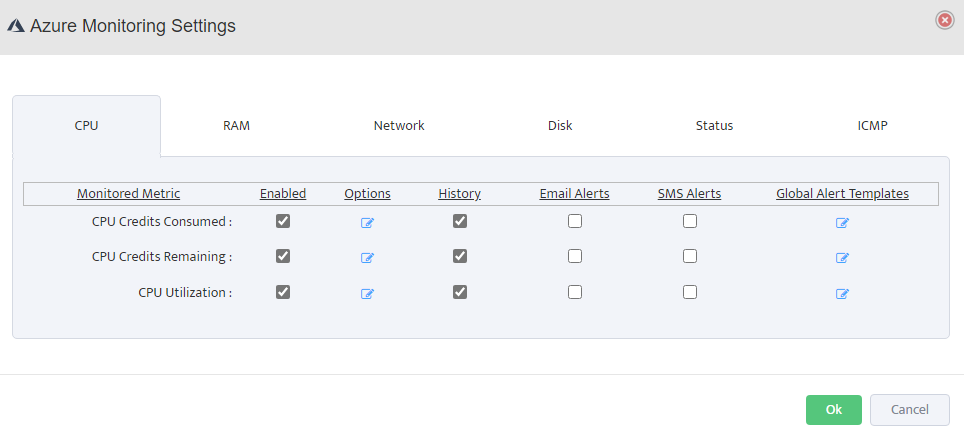
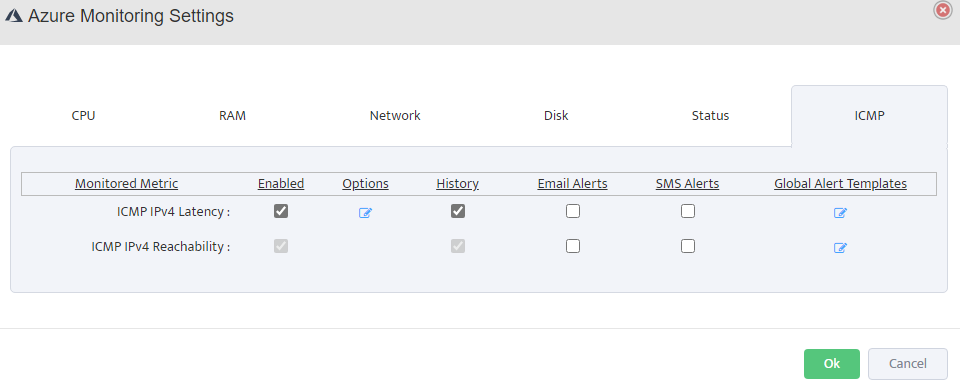
Configure Monitoring Settings
Click on Monitoring in the top navigation menu, then select Azure Monitoring Settings. Configure the following metrics for your Azure resources:
CPU Monitoring: Enable CPU Credits Consumed, CPU Credits Remaining, and CPU Utilization.
Configure thresholds, enable history, and set up email/SMS alerts as needed.
RAM Monitoring: Enable RAM Utilization monitoring, set alert thresholds (e.g., warning at 80%, critical at 90%), and configure alert destinations.
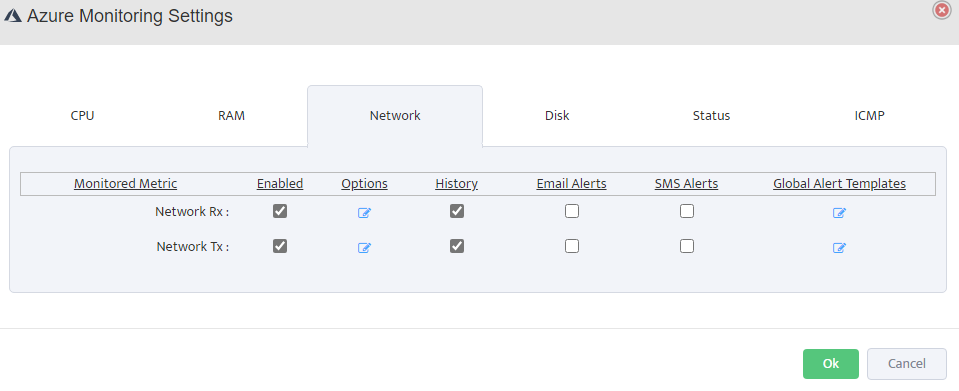
Network Monitoring: Enable Network Rx (Receive) and Network Tx (Transmit) to monitor inbound and outbound traffic.
Track bandwidth utilization and set alerts for unusual network activity.
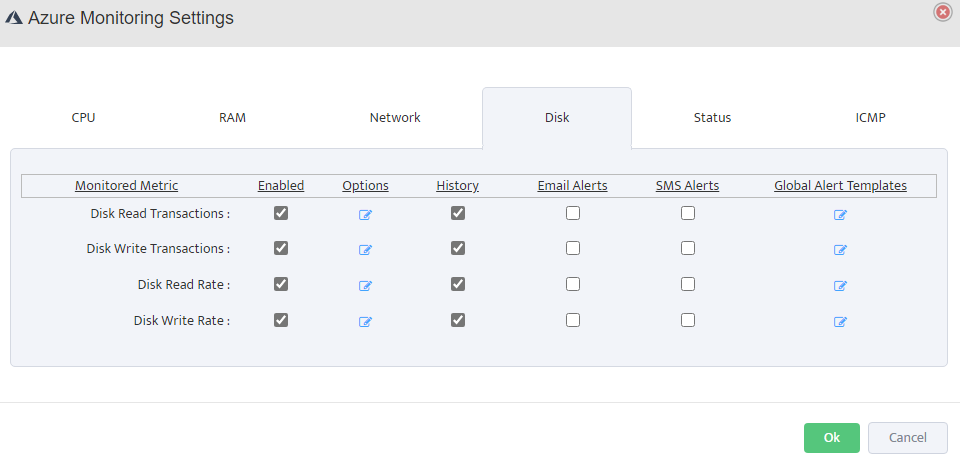
Disk Monitoring: Enable Disk Read/Write Transactions and Disk Read/Write Rate to monitor IOPS and throughput.
Configure appropriate thresholds based on your workload requirements.
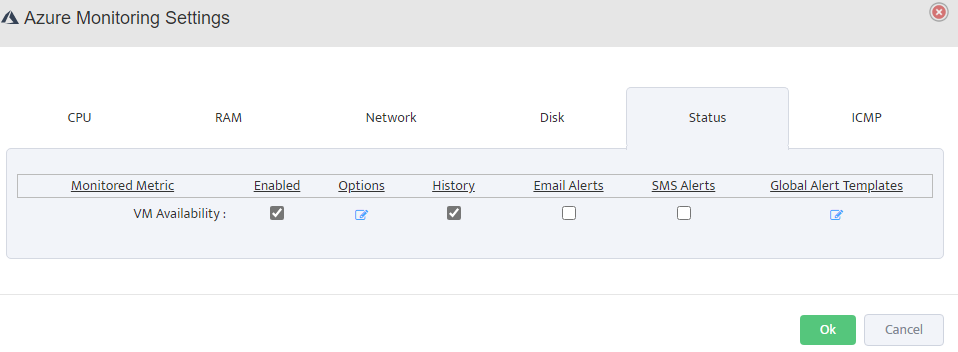
Status Monitoring: Enable VM Availability monitoring to track uptime and set alerts for VM state changes or downtime events.
ICMP Monitoring: Enable ICMP IPv4 Latency and Reachability to verify network connectivity.
Set latency thresholds and configure packet loss alerts.
Nectus MSP Server Installation Procedure
Nectus InstallationNectus MSP Server Installation Procedure
Server Requirements:
Windows Server 2019 or newer.
16GB of RAM + 4GB of RAM for each Tenant.
1TB of disk space.
4vCPU + 2 vCPU for each Tenant.
1. Start Installation
Download Nectus installer from support portal.
Start installation by launching Nectus Installer as administrator
2. Installation of MSP Server
Click Next
Accept the license agreement on the page.
Select MSP Server and Click Next
Click Next
Setup an Administrator account
MSP Server FQDN Configuration
Enter the public domain name (FQDN) for your MSP Server in the “MSP Server FQDN” field
(e.g., msp.acme.com). This domain must be publicly accessible and will be used to generate unique tenant URLs. Each tenant will access their Nectus instance at https://[tenantID].msp.acme.com.
Click install, which will automatically complete installation.
Installation is completed. Click Next
When the installation Is complete, you will see the following page.
After you click Finish, the Nectus login page will come up, where you need to provide the credentials of the admin account you created during Installation.
3. Creation of Tenant
Upon logging into Nectus, the following page will be displayed in your browser.
Navigate to Settings and then click on Tenants
Click Create
Add Tenant and Fill in the tenant details:
Click Create to finalize the tenant setup.
It will start creating tenant including database as per below screens
Click Done
The following screen will appear.
3. Creation of Tenant Agent
Click on the URL https://anfyqjgypgimyygc.msp.acme.com
Note: Ensure a DNA A record is created on your DNS server to make the tenant URL accessible.
The following page will appear. Click Generate Temporary License to continue.
Enter your Company Name and Email ID, then click Generate Temporary License. The system will connect to the license server on the internet to activate your license.
Once activated, the screen shown below will appear with the tenant login interface.
Click on Agent 1: displayed in red at the top of the page.
The default agent will be displayed as shown below. Click the Download Meta File button (blue arrow icon) to proceed.
The meta file Default.json will be saved to your Downloads folder.
You will need this file during agent installation.
4. Installation of Tenant Agent
Agent Server Requirements:
Server OS: Windows 2019 or newer.
8GB of RAM
4 vCPU
250GB of disk space.
Start the same Nectus Installer as you used for MSP installation
Click Next
Accept the license agreement on the page.
Choose Agent as the installation type.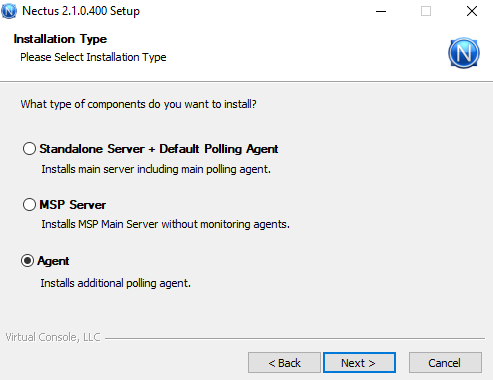
Click Next
Accept the license agreement on the page.
Click Next
The Polling Agent General Settings screen will open. Click Select File, browse to the location of the meta file you downloaded earlier.
Replace 127.0.0.1 in the meta file with the actual IP address of your MSP Server.
Ensure the MSP Server firewall permits inbound TCP traffic on port 8008 (WebSockets)
and port 5433 (PostgreSQL)
Click Next
Click Next
Click Next to complete the installation
Click Finish
After completing the agent installation, verify the status of the Default agent on the MSP tenant portal. The indicator should turn from red to green, confirming successful installation and that the agent is reporting to the console.
MSP, MSP, MSP!!!
Nectus NewsMSP, MSP, MSP!!!
Nectus has started offering an MSP version of our network monitoring suite to selected pilot users.
The MSP version can be hosted either in the cloud or on-premises, with isolated access for each individual tenant.
It is priced at a fixed cost of $2,000 per tenant per year (PTPY). Each tenant receives an isolated database
instance and a dedicated access URL, with all modules included and support for unlimited devices.
www.nectus5.com
Subscription-based SaaS access for new customers
Nectus NewsFrom October 1, Nectus starts to offer subscription-based SaaS access for new customers.
New customers can choose between a one-time license purchase with annual support fee or subscription-based SaaS access that is paid monthly.
Monthly subscription-based access will appeal to smaller customers that require more flexibility with payments.
Subscription-based SaaS cost will be calculated based on selected modules and number of devices supported by each module.
www.nectus5.com
hashtag#nectus hashtag#networkmonitoring hashtag#saas hashtag#datacenter
Creating service account for MSSQL monitoring in Nectus
Access Right Management, Technical NotesCreating MS SQL DB Monitoring Service Account for Nectus
Step 1 : Connect to MS SQL Server
Step 2 : Under “Security” tab, open “Logins” section.
Step 3 : Right-click on “Logins” section , and select “New Login”.
Step 4 : Fill in the required information for the new account.
Step 5 : In “New Login” window “General” tab specify:
Step 6: For “Server Roles” select “sysadmin” and “public”.
Step 7: for “User Mapping” select the database and also select database role as “db_datareader”.
Nectus Azure SAML Integration
Nectus Installation, Technical NotesNectus and Azure SAML Integration
Step 1: Navigate to Identity -> Enterprise Applications from within the Azure Portal:
Step 2: To add a new application, click the new application button:
Step 3: Create your own application:
Step 4: In the application panel, select Non-Gallery application and enter a name (for example, Nectus5) and Select Create
Step 5: Navigate to Manage-> Single Sign On found on the left-hand panel and select SAML for the SSO method:
Step 6: On the Set up Single Sign-On with SAML page, click the Edit icon to open the
Basic SAML configuration dialog:
Step 7: On the Basic SAML Configuration section, perform the following steps (please note these are the default values out of the box and will be different for every organization):
https://base22c/saml
https://base22c/saml/acs
https://base22c/saml
Step 8: In the User “Attributes and Claims’ section, check that Azure is passing at least the following claims: givenname, surname, emailaddress, name, and unique User Identifier (this is the default setting)
Step 9: On the “SAML Certificates” section, download the Base64 certificate and save it to your computer.
Step 10: Navigate to Nectus, and open the SAML configuration settings:
Step 11: Take the values listed for the Login URL, Azure AD Identifier, and Logout URL, and paste these to the corresponding sections in the SAML configuration settings in Nectus.
Ensure the SAML Provider selected is Azure:
In Nectus5:
The certificate value is the plaintext value of the Base64 certificate downloaded previously (rename the file with a .txt extension and copy the string from Notepad):
Step 12: Assign Users and Groups to the enterprise application in the Azure portal:
Step 13: Finish the remaining configuration on the Nectus5 application for Attribute Mapping, SAML access groups, and SAML access accounts:
Attribute Mappings: provide the SAML attributes for First Name, Last Name, Email and membership Groups. This mapping is between SAML attributes and Nectus fields.
SAML Access Groups: Click on the “+” button to add the SAML user groups from the SAML Server.
Members of the selected groups will be allowed to login to Nectus.
SAML Access Accounts: Click on the “+” button to add individual user accounts from the SAML Server.
Selected users will be allowed to login to Nectus.
How to Generate Direct Access URL for Graphs and Dashboards
Nectus DashboardsHow to Generate Direct Access URL for Graphs and Dashboards
Quick Start
Step 1: Login to the Nectus Portal, right-click on the specific device, and select the Graphs -> Availability Graph option.
Step 2: On the Availability Graph page, click on the Generate Direct Access URL button.
Step 3: Consequently, a unique URL is generated for this graph.
Nectus allows you to include additional configurations such as URL name, access control, link expiration date, etc.
Lastly, click on the Save And Copy button.
Step 4: Open the URL in the browser.
The graph page will automatically load.
Note: The same steps should be followed to generate other graphs like Latency, Lost Pings, Trace, etc.
Step 5: Likewise, Nectus also allows us to generate direct access URLs for the dashboards.
To create one, navigate to Monitoring -> Network Monitoring Dashboards -> Low Level Dashboard.
Step 6: On the Low-level Dashboard model, click on the gear icon (settings option) in the top right corner.
Step 7: In the Settings model, click on the Generate Direct URL button.
Step 8: Subsequently, a unique URL is generated for this dashboard.
Once again, Nectus allows us to add additional configurations such as name, view access control using mandatory login, link expiry dates, etc.
Finally, click on the Save And Copy button.
Step 9: To share the copied URL with relevant users/teams, paste the URL in the browser. The dashboard page will then automatically load.
Note: The same steps should be followed for other dashboards like Network Monitoring, Server Monitoring, DB Monitoring, HTTP URL Monitoring, etc.
How to Create a Maintenance Events in Nectus
Nectus Installation, Network Monitoring, Technical NotesHow to Create a Maintenance Events in Nectus
You can create maintenance events in Nectus to allow everybody to see that specific objects (Interface, Device or Site) have an active or scheduled maintenance.
During active maintenance events corresponding objects in Nectus are displayed with a blue status icon.
This article shows how to create a maintenance event for a Device.
Similar process can be used for creation of Interface or Site level maintenance events.
Step 1: Login to the Nectus Portal, Right click on the specific device and select the Properties option.
Step 2: Go to the Maintenance Events Tab and Click on Add button to create a new Maintenance Event
Step 3: Provide the suitable description and scheduling information.
Select the appropriate checkbox to disable monitoring or alerting during the activity time.
Step 4: We can also use the status, time range, objects type dropdown to filter the maintenance events to manage it.
Step 5. To See Complete list of all Maintenance events, go to Monitoring -> Global Monitoring Settings -> Maintenance Events.
How to Combine Multiple Interface Utilization Graphs Into One
Network Monitoring, Technical NotesStep 1: Login to the Nectus GUI, and go to the specific device, identify the interfaces which have to be graphed in a combined view.
Step 2: Select the multiple interfaces, Right-Click on the Selected Interfaces and go to Graphs -> Interface Utilization Graph.
Step 3: Here is the default view, where all utilization graphs are stacked vertically.
Step 4: Use superimpose option (Superimpose, Superimpose with Summary) which merges the selected multiple interface utilization graphs into a single graph.
Restricting Users From Using Specific Nectus GUI Features
Technical NotesRestricting Users From Using Specific Nectus GUI Features
Quick Start
Step 1: Let’s login to the Nectus GUI using the superadmin user credentials.
Step 2: Click on the Setting Menu and select admin accounts (Settings -> Admin Accounts).
Now the new modal opens with two tabs (Users List, User Groups).
Step 3: First, let’s create a new group by clicking the Create Button.
Provide the appropriate group name and select the features that need to be allowed or disabled for this user group.
Here, we are hiding Call Records, Network Discovery, Ping Plotter, and so on. Last, click on the OK button and create a new group.
Step 4: Now, let’s create a new user and add to newly created group.
Go to the User List tab in the Admin Account Modal and Click on Create User Button.
Complete the basic information and, under the Group dropdown option, select the appropriate group.
Step 5: Now, we can see the new user is added and mapped to appropriate group.
Step 6: Log-in with the newly created user credentials to validate the provided features restriction.
How to Override Group Based Monitoring Settings for Specific Devices
Network Monitoring, Technical NotesHow to Override Group Based Monitoring Settings for Specific Devices
By default, all the monitoring settings for each device are defined in the Monitoring Profile that is assigned to
Monitoring Group where this specific device is a member of.
Starting from 1.67.1 release Nectus adds ability to override group-based monitoring settings for each device.
Step1: Login to the Nectus Portal and go to the specific device on which you need to perform the monitoring settings override.
Right click on the device and select Properties.
Step 2: Select Metrics Tab in the properties modal and apply all the required overrides to the required metrics.
Check button “Local Override” must be selected for all the metrics that must have priority (override) over Group based monitoring settings.
Creating New Interface Monitoring Groups and Profiles
Network Monitoring, Technical NotesStep 1: Login to the Nectus Portal and go to Monitoring -> Network Monitoring Settings -> SNMP Interfaces Monitoring Settings.
Step 2: Monitoring Profile Creation – Go to the SNMP Interface Monitoring Profile Tab by clicking the Add Profile button.
Name the profile, enable the relevant options, and click the OK button.
Now, we can see that the newly created profile is shown in the table.
Step 3: Monitoring Group Creation – Next, let’s go to the SNMP Interface Monitoring Groups tab and create a new interface monitoring group by clicking Add Group.
Step 4: Assigning Interfaces to Monitoring Group – Click on the interface group name to add the appropriate device interfaces information to the group.
We can also filter the interfaces based on operational status, admin status, site and device types and lastly click on Save button.
Step 5: Assigning Monitoring Profile to Monitoring Group – Enable the monitoring and select the previously created monitoring profile from the dropdown.
Step 6: Defining Alert Recipients for Monitoring Group – Now, let’s configure recipients for alerting by clicking the email button.
It allows us to add SMS and email recipients to a list. Further, we can also select the appropriate alert templates to send alert/sms.
Done.
Creating New Device Monitoring Groups and Profiles
Network Monitoring, Technical NotesNetwork device monitoring in Nectus is controlled by device monitoring groups and associated monitoring profiles.
There are two default monitoring groups: “Default Monitoring Group” and “No Monitoring Group”
By default all devices are automatically assigned to Default Monitoring Group where all basic monitoring metric are enabled.
“No Monitoring Group” is used as a parking place for devices that do not required monitoring.
In some cases additional monitoring groups may be required and this article explains the steps required to create additional monitoring groups.
Step 1: Login to the Nectus Portal and go to Monitoring -> Network Monitoring Settings -> SNMP Devices Monitoring Settings.
Step 2: Monitoring Profile Creation – Go to the SNMP Device Monitoring Profile by clicking the Add Profile button. Name the profile, enable the relevant options, and click the OK button.
Now, we can see that the newly created profile is shown in the table.
Step 3: Monitoring Group Creation – Next, let’s go to the SNMP Device Monitoring Groups tab and create a new device monitoring group.
Step 4: Assigning Devices to Monitoring Group – Click on the device group name to add the appropriate device information to the group and lastly click on Save and Ok buttons.
Step 5: Assigning Monitoring Profile to Monitoring Group – Enable the monitoring and select the previously created monitoring profile from the dropdown.
Step 6: Defining Alert Recipients for Monitoring Group – Now, let’s configure recipients for alerting by clicking the email button. It allows us to add SMS and email recipients to a list.
Done.
Nectus Okta SAML Integration
Nectus Installation, Technical NotesStep 1: Log in to the Nectus Portal and go to Settings > General Settings > SAML Integration.
Step 2: In the SAML Integration Modal, under the General tab, provide the Entity ID, SSO URL and SLO URL, Certificate, Organization URL and API token.
Refer to SAML provider documentation on how to generate Certificate and API key.
Step 3: Under Attribute Mappings, provide the SAML attributes for First Name, Last Name, Email and membership Groups.
This mapping is between SAML attributes and Nectus fields.
Step 4: Click on the “+” button to add the SAML user groups from the SAML Server.
Members of the selected groups will be allowed to login to Nectus.
Step 5: Click on the “+” button to add individual user accounts from the SAML Server.
Selected users will be allowed to login to Nectus.
Automating Selection of Interfaces Enabled for Monitoring
Network Monitoring, Technical NotesAutomating Selection of Interfaces Enabled for Monitoring
By default, Nectus does not monitor any Interfaces and you must select which interfaces you want to be monitored.
You can select Interfaces manually by adding it to one of the Interface monitoring groups or you can build auto-population rules
that will automatically select Interfaces based on predefined rules. Rules will be executed once a day (at 2:00AM)
Step 1: Login to the Nectus portal and go to Monitoring -> Network Monitoring Settings -> SNMP Interfaces Monitoring Settings option.
Step 2: Go to the SNMP Interfaces Monitoring Groups tab and click on the Auto Population Rules under the Default Monitoring Group.
Step 3: Click on the Rule to add a new auto-population rule. Once a day, interfaces that conform to the defined rules
will be added to the corresponding monitoring group.
You can add individual rules or you can create group of rules with AND/OR logic.
How to Manually Add Device Classification for Unknown Devices
Nectus Installation, Network Discovery, Technical NotesHow to Manually Add Device Classification for Unknown Devices
Step 1:
Nectus maintains internal device classification database where each device is assigned a major platform category and a device model name.
Classification is associated with device SNMP Platform OID: (.1.3.6.1.2.1.1.2.0)
Classification database is updated daily and support for new devices included in every Nectus update. But in some rare cases Nectus might not have classification info for specific device and this device will appear under “Unknow Category” in SNMP device tree.
Nectus GUI allows customer to manually add Unknown device classification information directly into Nectus server database.
Right-click on SNMP Platform ID value and select “Add Product Definition for x.x.x.x.x.x.x” from the SNMP Devices context menu.
Step 2: As the product definition modal opens, provide the sub-category (product) name, and select a category from the drop-down menu. If there is no applicable category name in the drop-down menu, you can define a new category name.
Controlling Nectus Database Size Growth with Data Retention Rules
Nectus Installation, Network Monitoring, Technical NotesControlling Nectus Database Size with Data Retention Rules
Step 1: Login to Nectus portal and go to Monitoring 🡪 Global Monitoring Settings option.
Step 2: Go to the “Data Retention” tab in the Monitoring Settings modal. It shows retention settings in days for each monitoring metric.
Further, it also shows the current database size and the data daily growth rate.
These two options give you a good idea of how to plan your retention period and storage requirements.
Step 3: Provide the retention period in days with maximum of 3650 days (10 years) and minimum of 1 day.
Step 4: We also have two key options such as Refresh and Cleanup.
Refresh – Will fetch updated size information from the server
Cleanup – Starts removal of monitoring data from the Nectus database according to retention settings.
Note: Normally Cleanup happens automatically every day at 2:00AM.