Nectus to Azure Integration: A Comprehensive Guide
Sign in to Azure Portal
Open your web browser, navigate to https://portal.azure.com, and sign in with your Azure account credentials.
Get Your Subscription ID
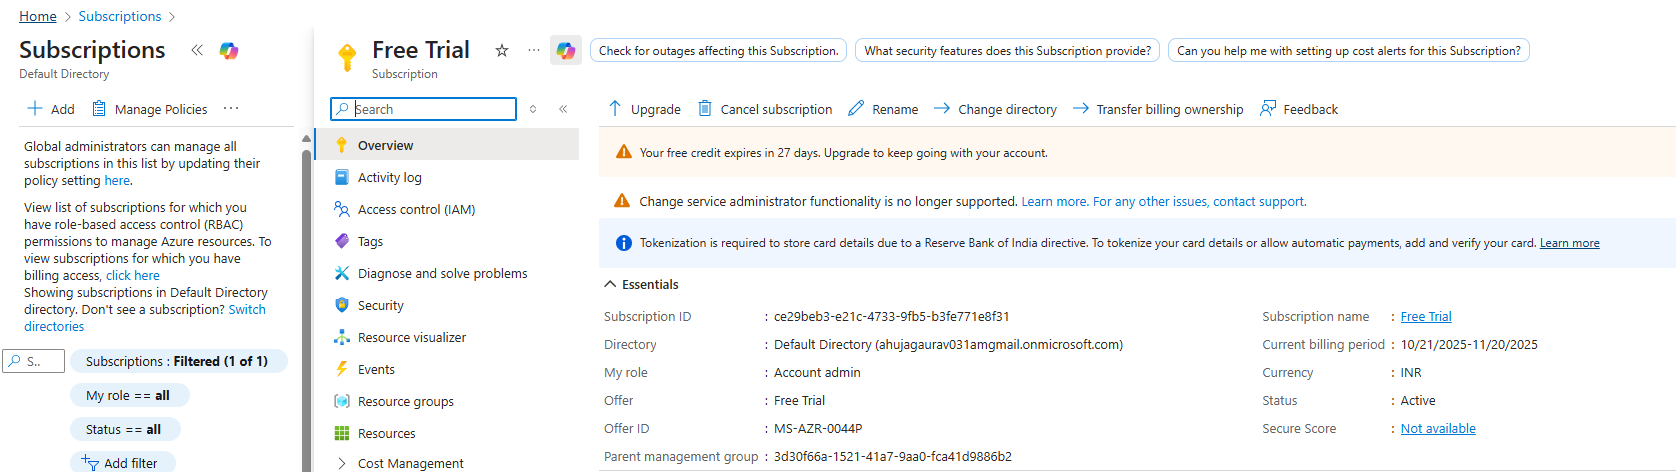
In the Azure Portal, search for “Subscriptions” in the top search bar and select your subscription. On the Overview page,
copy the Subscription ID (format: 12345678-1234-1234-1234-123456789012) – you’ll need this for Nectus configuration.
Get Your Tenant ID (Directory ID)
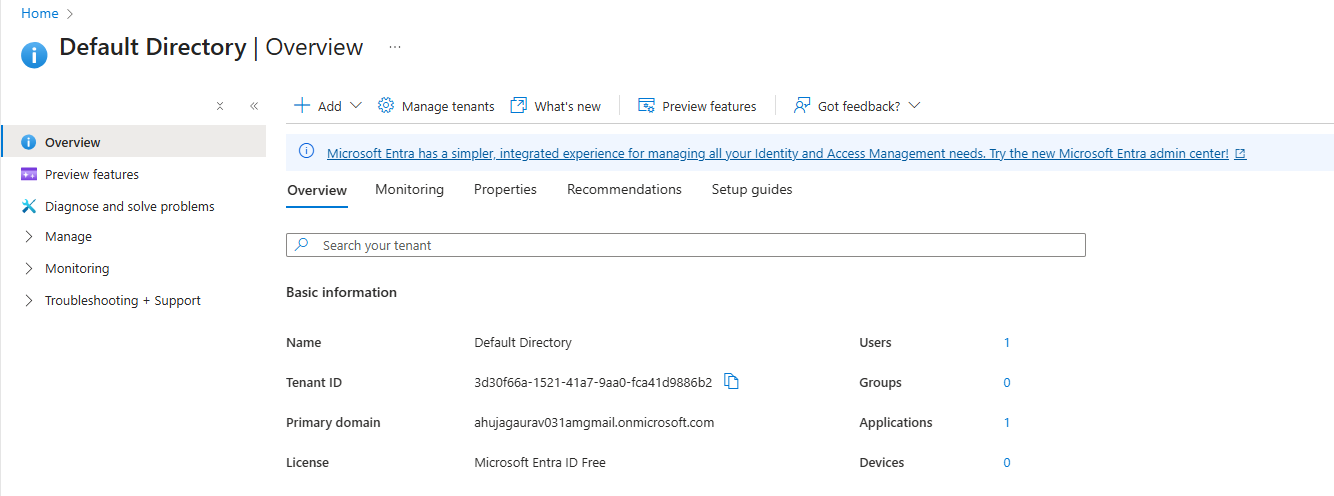
In the Azure Portal, search for “Microsoft Entra ID” in the search bar. On the overview page, locate the “Basic information”
section and copy the Tenant ID (also called Directory ID, format: 87654321-4321-4321-4321-210987654321).
Create Service Principal (App Registration)
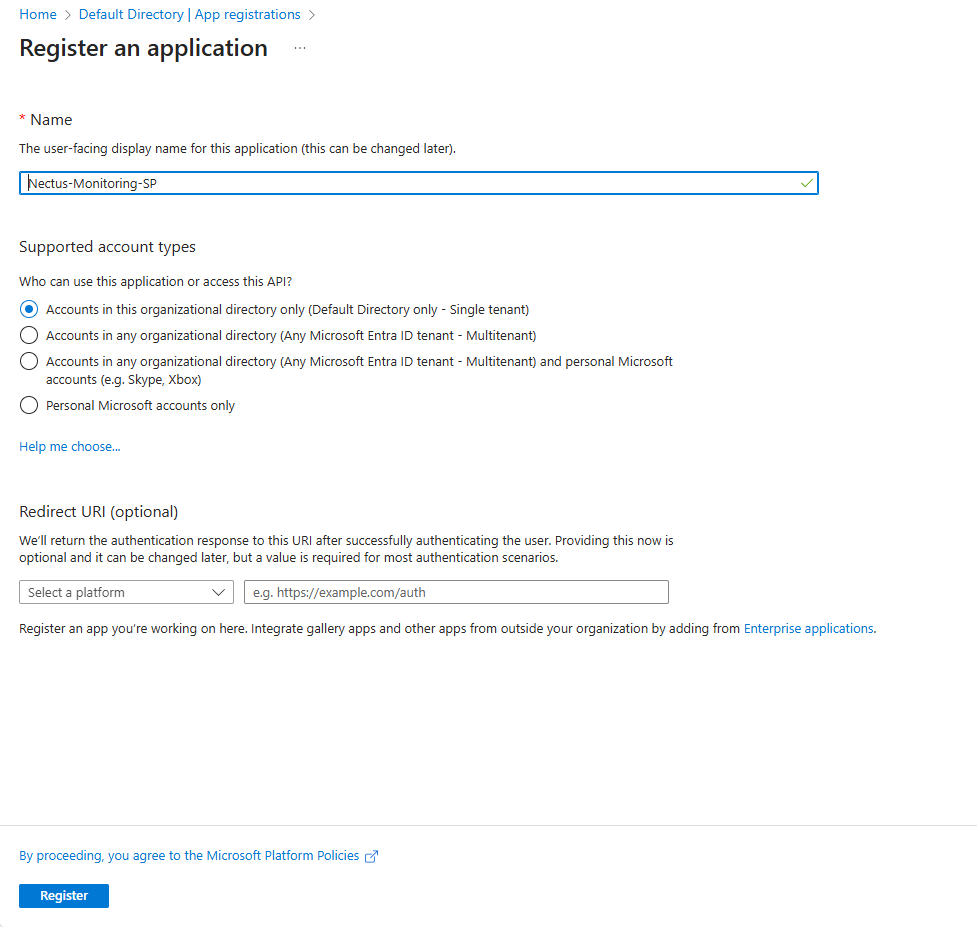
In Azure Portal, search for ” Microsoft Entra ID “, click “App registrations” under Manage, then click “+ New registration”.
Enter name “Nectus-Monitoring-SP”, select “Accounts in this organizational directory only”, leave Redirect URI blank, and click “Register”.
Get the Client ID (Application ID)
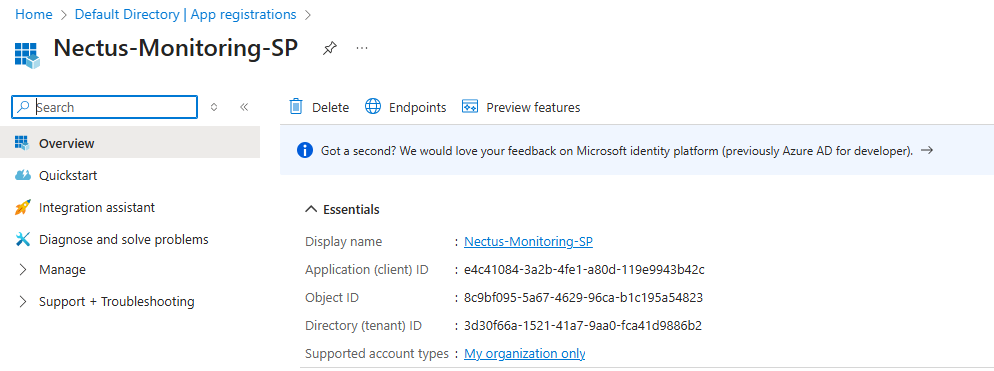
After registration, you’ll be on the app’s Overview page. Locate “Application (client) ID“,
click the copy icon to copy this value (format: abcd1234-5678-90ab-cdef-1234567890ab), and save it as your Client ID.
Create Client Secret
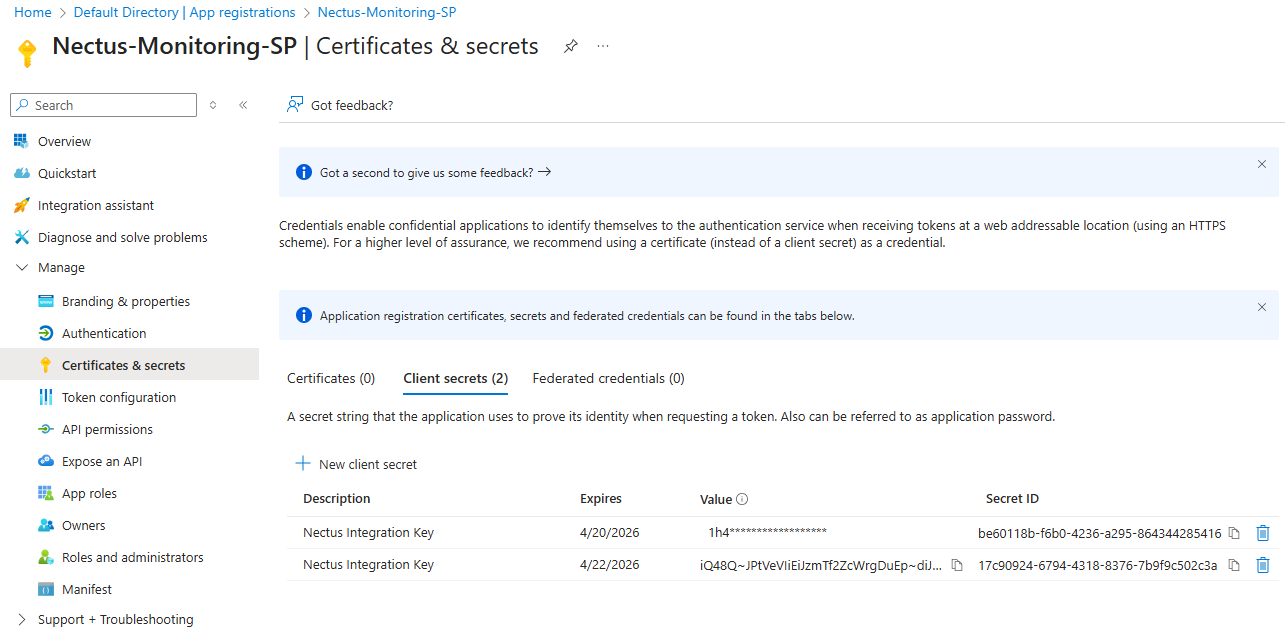
In the app registration page, click “Certificates & secrets” under Manage, then click “+ New client secret”.
Enter description “Nectus Integration Key”, choose expiration duration (6 months or 1 year recommended), and click “Add”.
IMPORTANT: Immediately copy the “Value” (not Secret ID) as you won’t be able to see it again
(format: 8Q8~XXXXXXXXXXXXXXXXXXXXXXXXXXXXXXXXXX), and save it securely.
Assign Reader Role to Service Principal
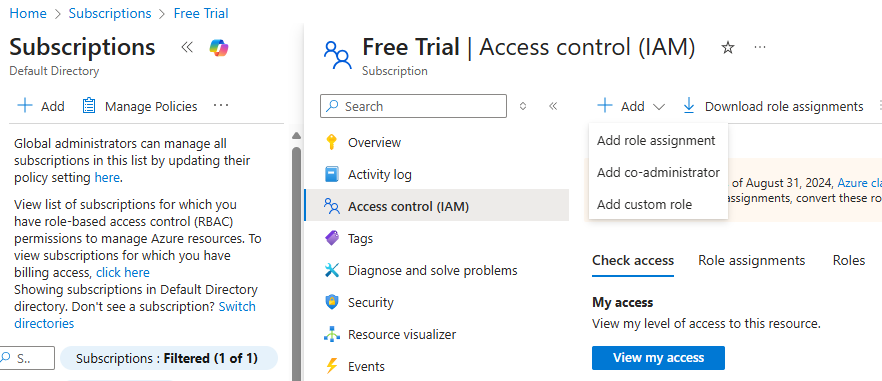
Navigate to Subscription IAM Go back to “Subscriptions” (search bar), click on your subscription name,
then click “Access control (IAM)” in the left menu.
Add Role Assignment Click “+ Add” button at the top, then select “Add role assignment”.
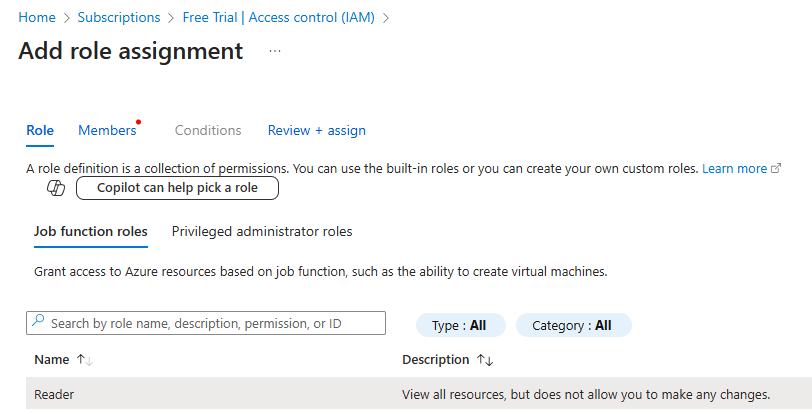
Select Reader Role In the “Role” tab, search for “Reader”, select the “Reader” role, and click “Next”.
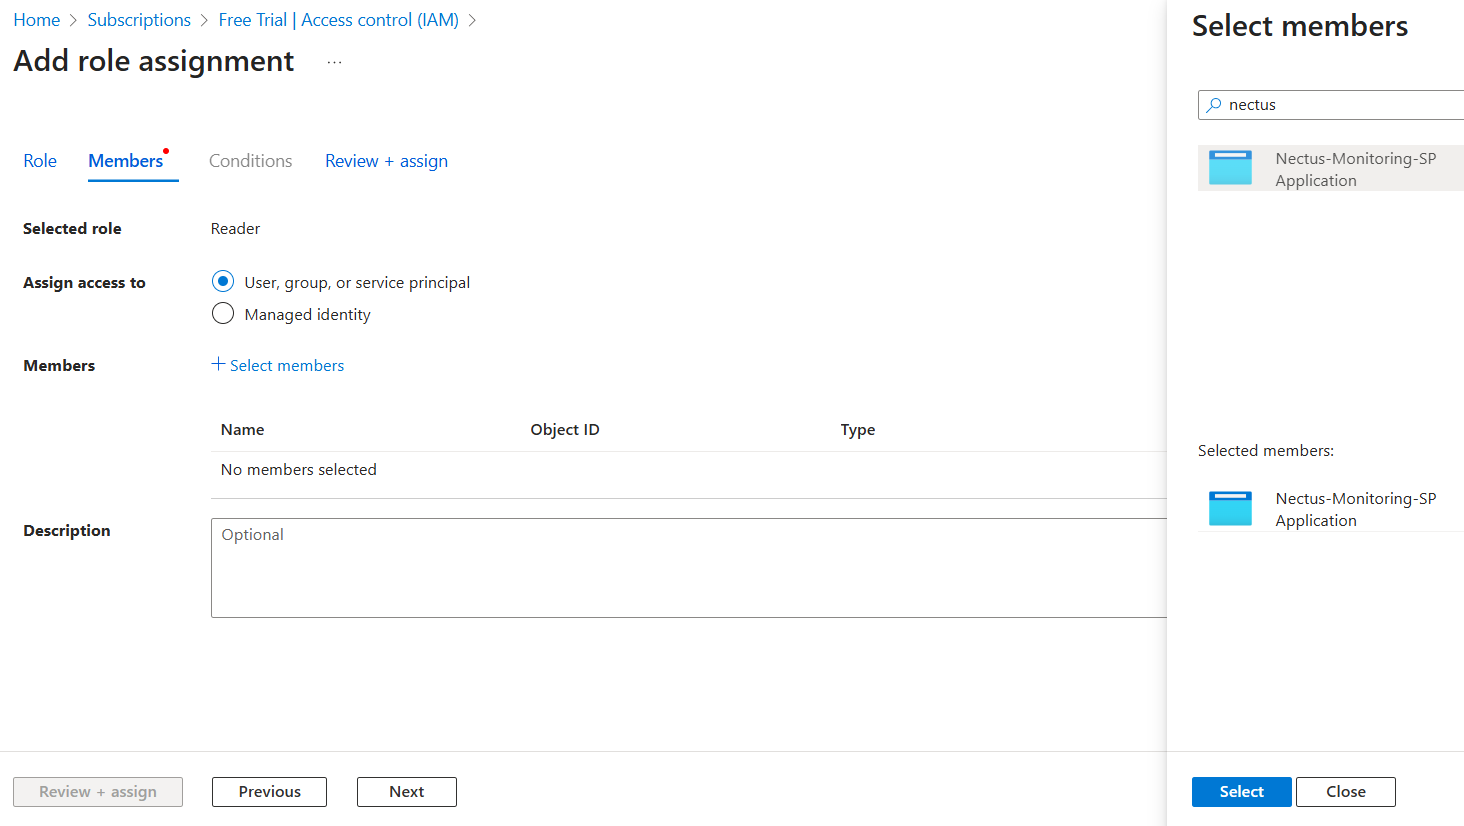
Assign to Service Principal In the “Members” tab, select “User, group, or service principal” for “Assign access to”, click “+ Select members”,
search for “Nectus-Monitoring-SP”, click on it when it appears, click “Select”, then click “Next”.
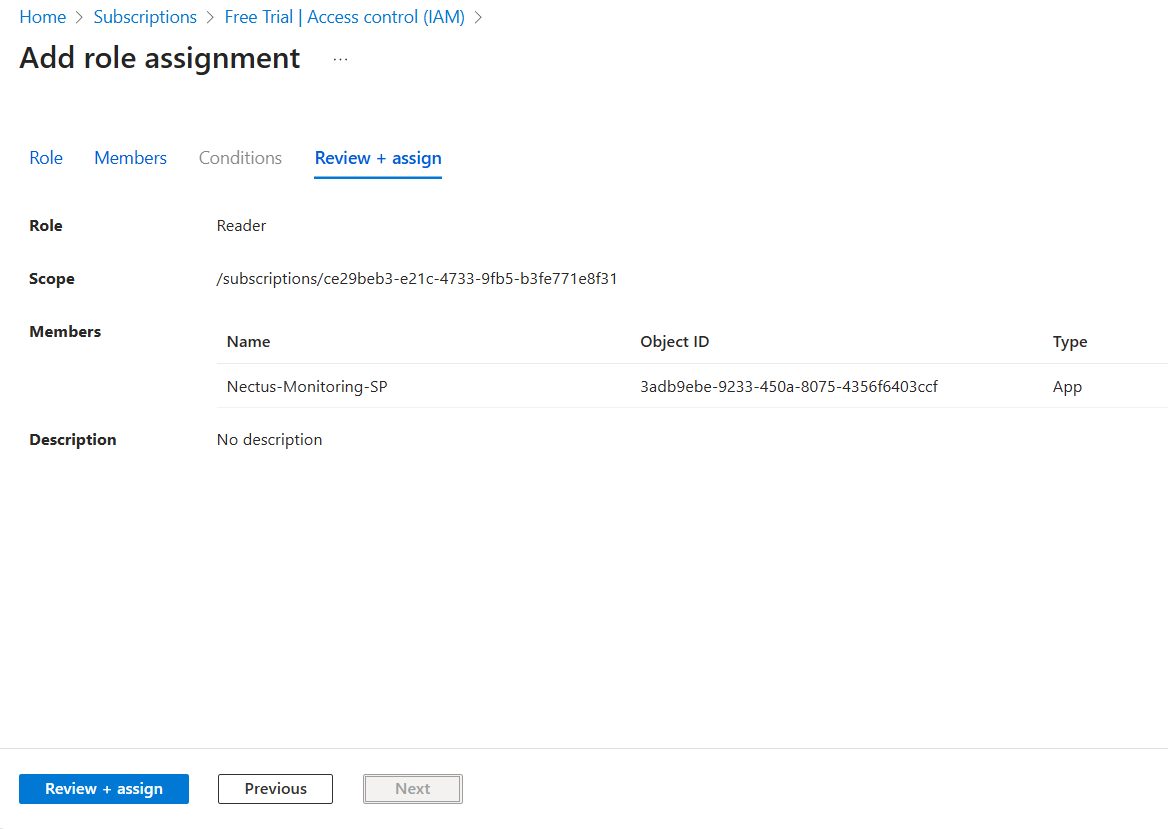
Review and Assign Review the assignment (Role: Reader, Scope: Your subscription, Members: Your service principal),
then click “Review + assign” twice to confirm.
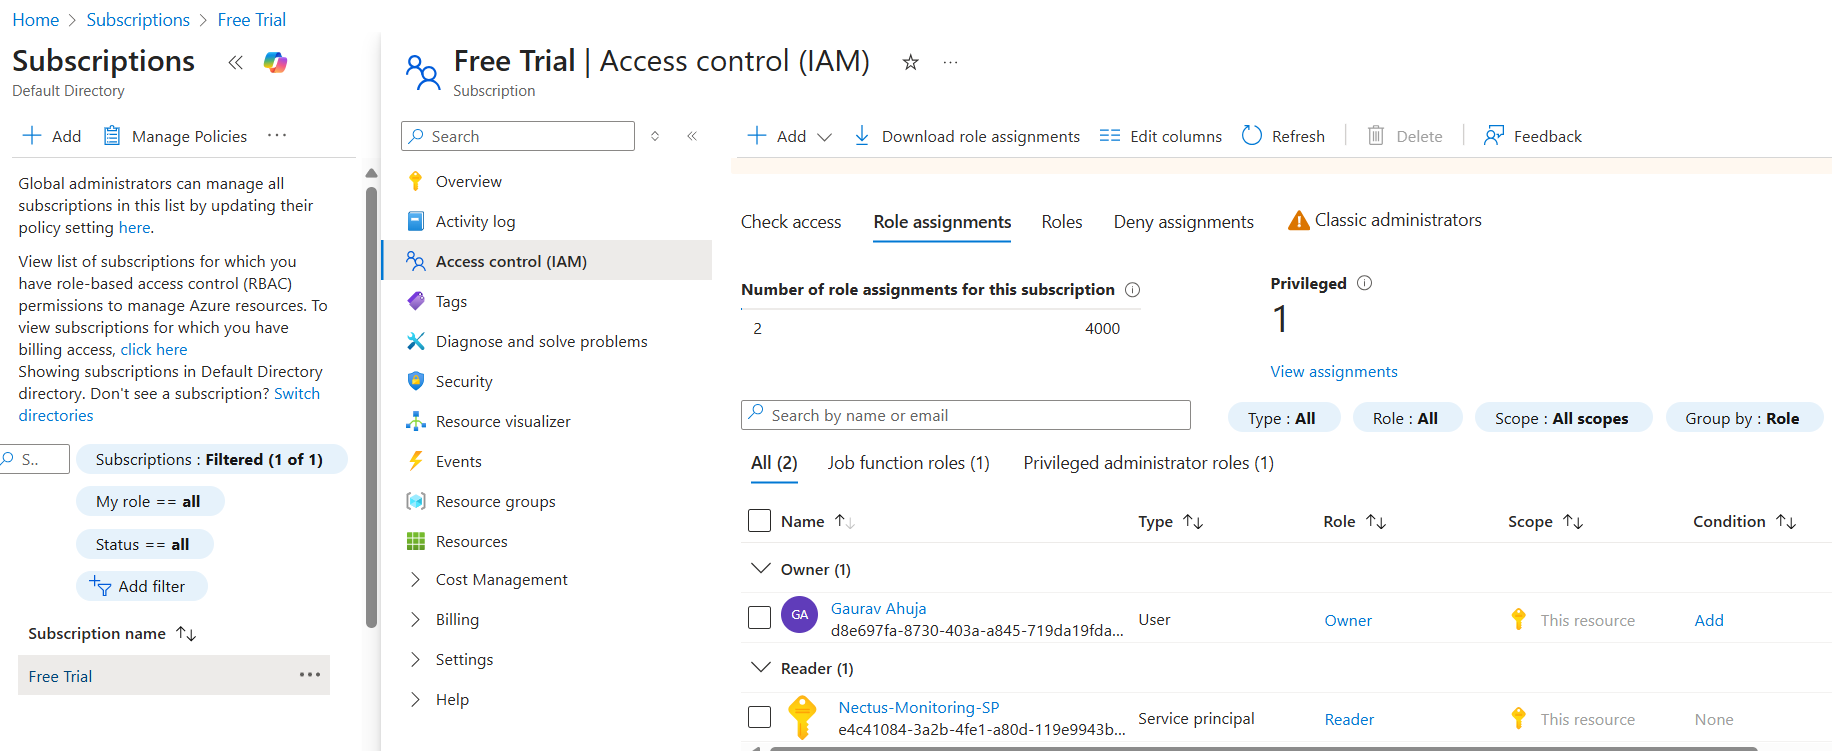
Verify Everything is Set Up
Go to Subscriptions > Your Subscription > Access control (IAM) > Role assignments tab to verify your service principal is listed with Reader role.
Access Nectus Azure Integration
Log in to the Nectus web console, click on Settings in the top navigation bar, select General Settings, then click on Azure Integration.
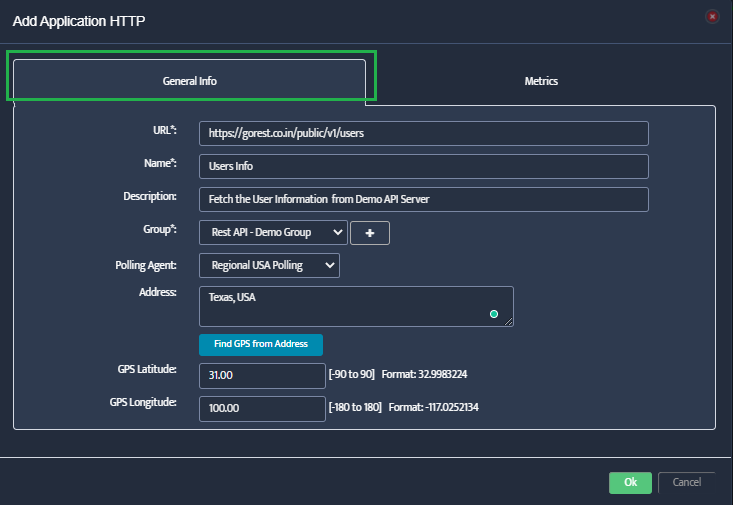
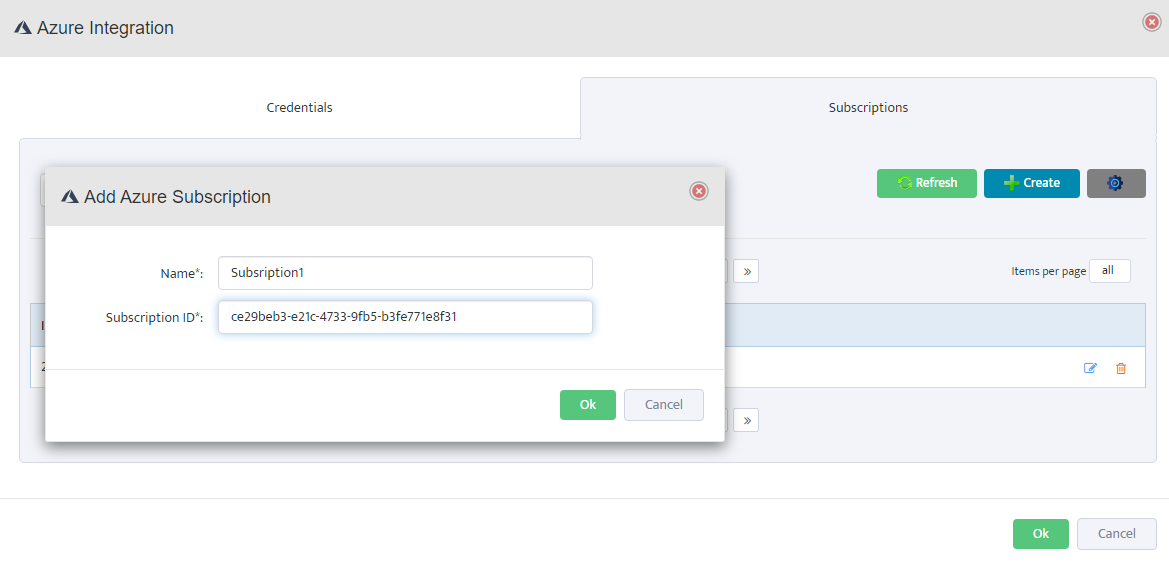
Add Azure Subscription in Nectus
In the Azure Integration console, click on the Subscriptions tab, then click Create. Enter a descriptive name (e.g., “Subscription1”)
and your Azure Subscription ID, then click OK to save.
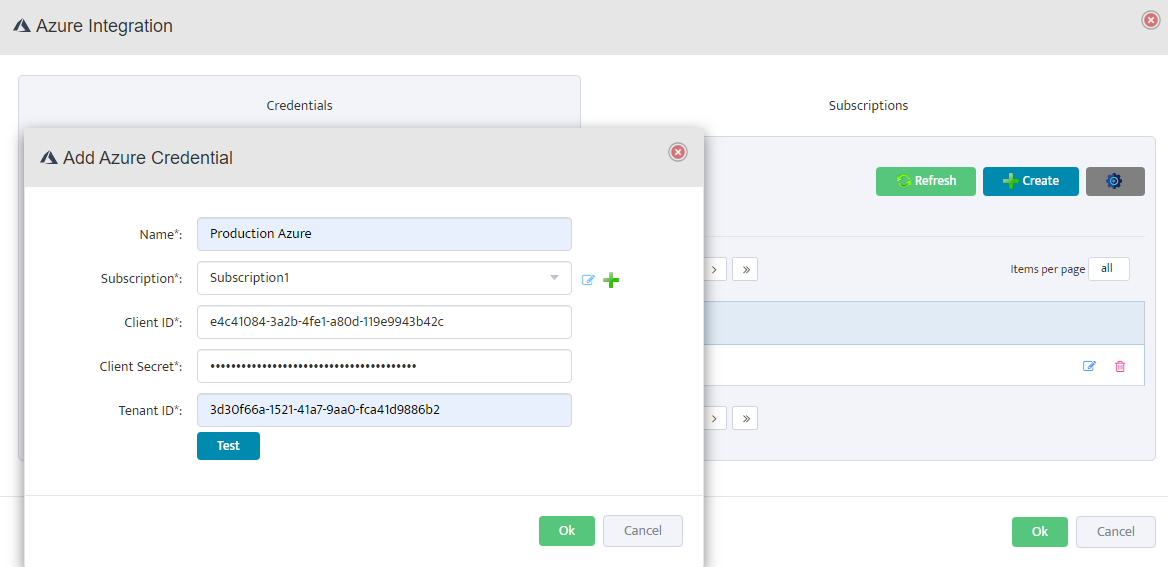
Add Azure Credentials in Nectus
Click on the Credentials tab, then click Create. Enter a descriptive name, select the subscription from the dropdown,
and fill in the Client ID, Client Secret, and Tenant ID from the service principal created in Step 4-6.
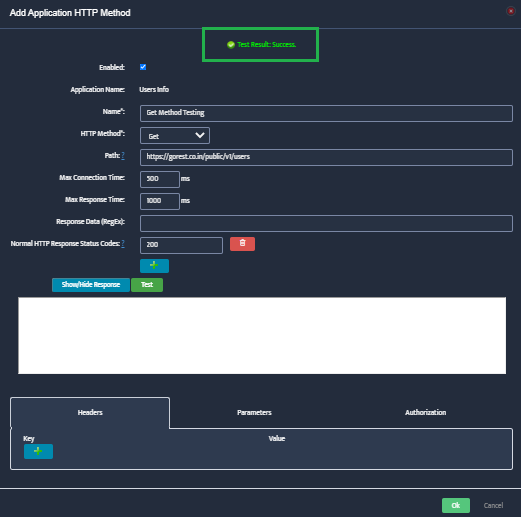
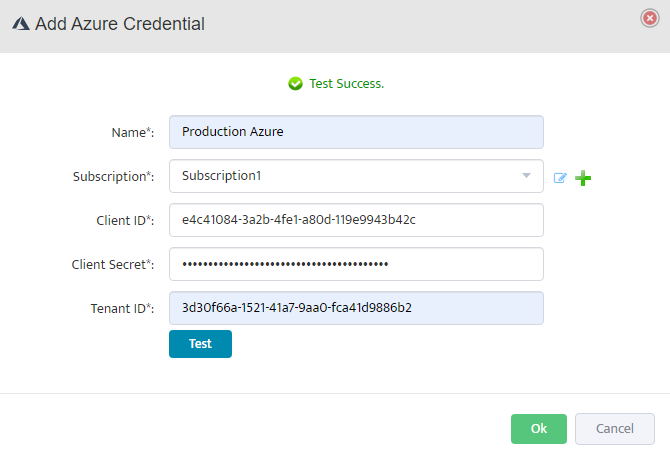
Test and Validate Credentials
Click Test to validate the credentials. The test authenticates with Azure Active Directory, verifies subscription access, checks API connectivity,
and validates permissions. If successful, you’ll see a Test Success message. Click OK to save.
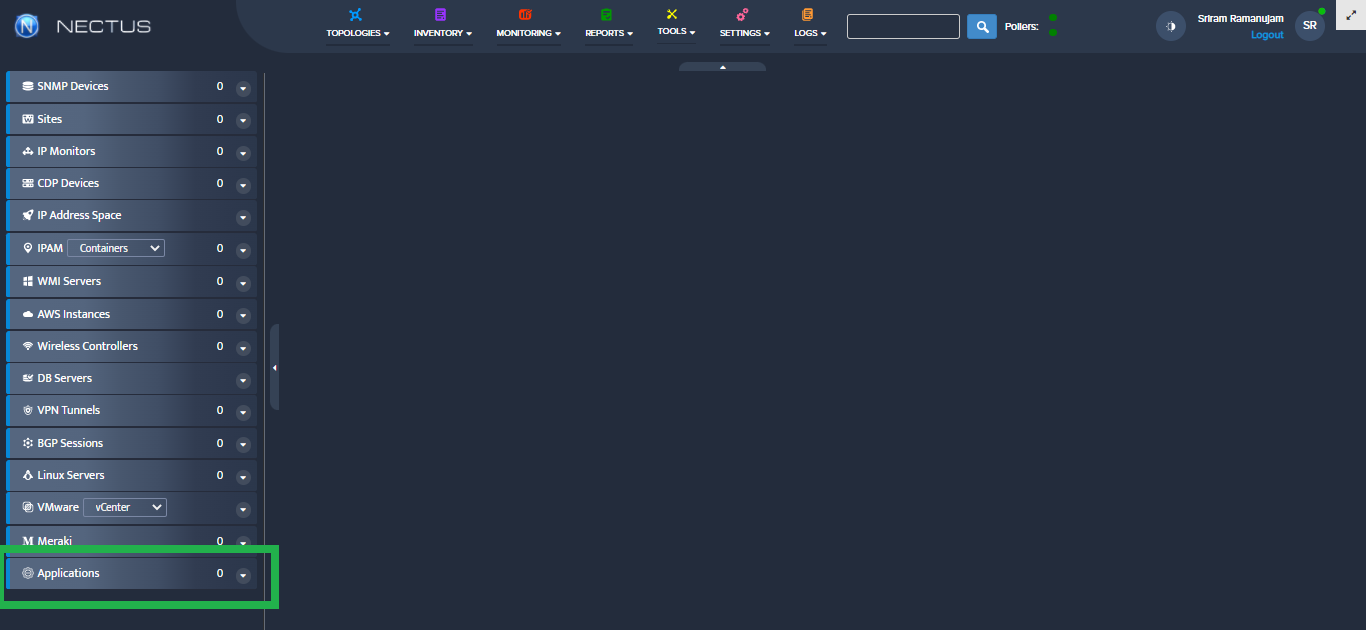
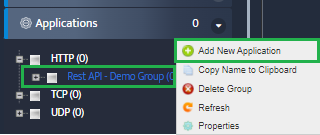
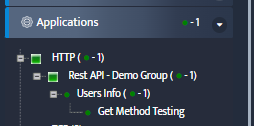
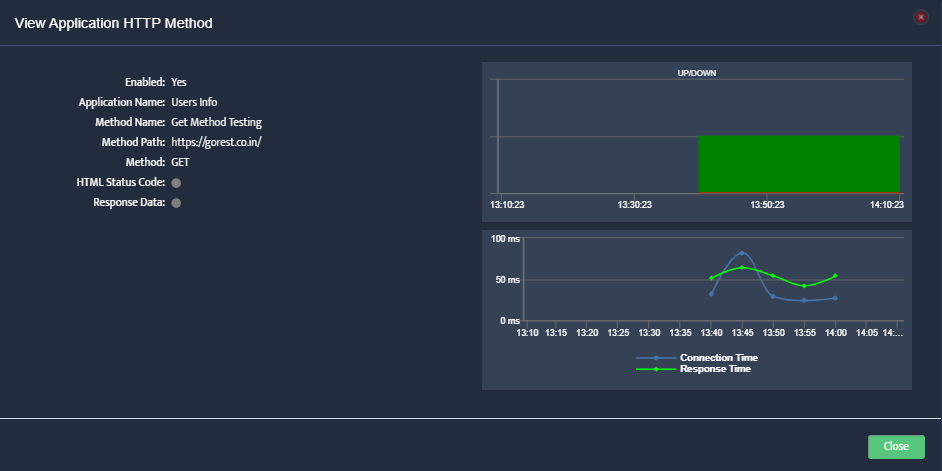
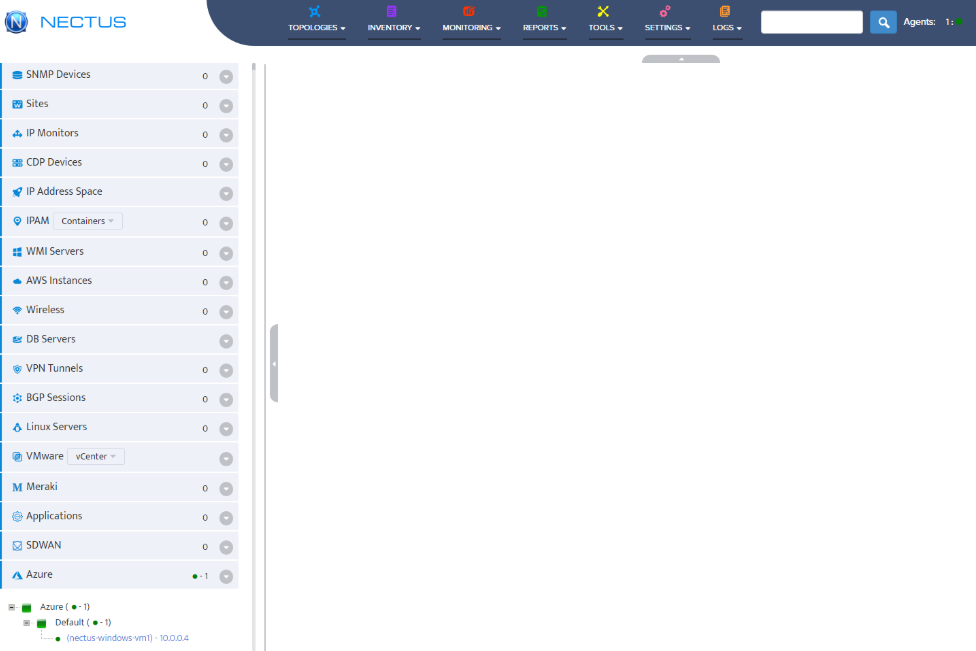
Verify Azure Resource Discovery
Navigate to Azure > Default in the left sidebar. The system will automatically discover and display your Azure resources including Virtual Machines.
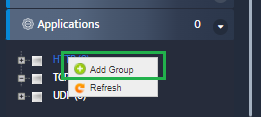
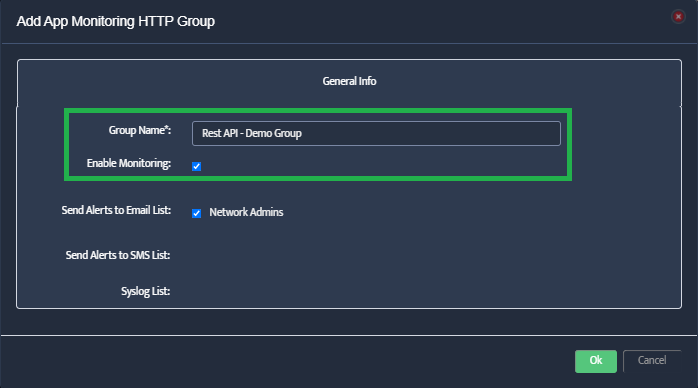
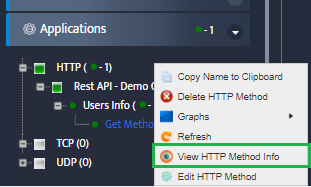
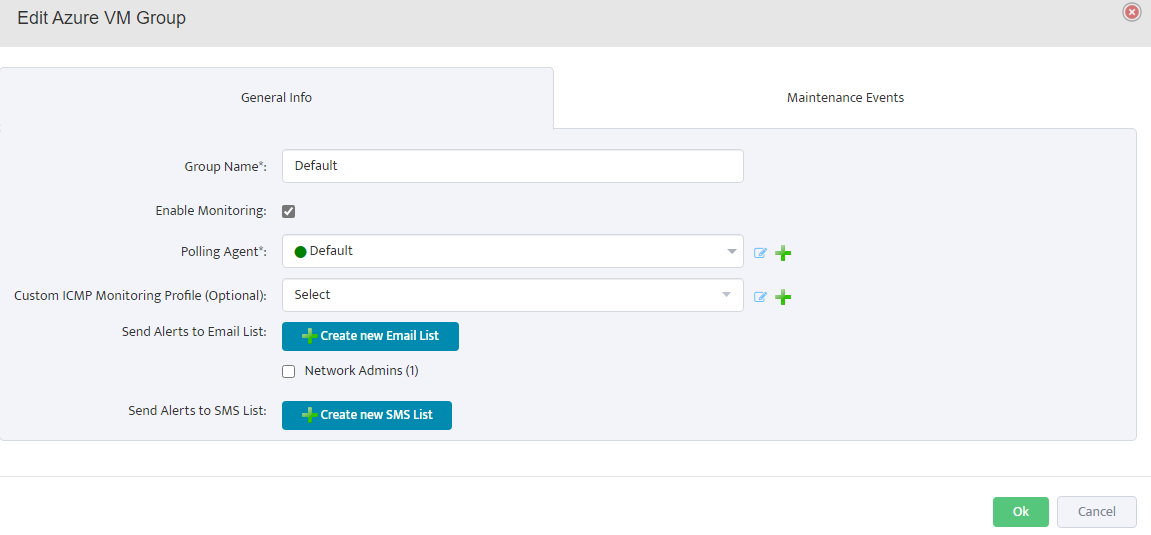
Configure VM Group Properties
Right-click on Default under Azure in the left sidebar and select Properties. In the General Info tab, enter the group name,
check Enable Monitoring, select the polling agent (typically “Default”), and configure optional settings like ICMP monitoring profile and alert notifications. Click OK to save.
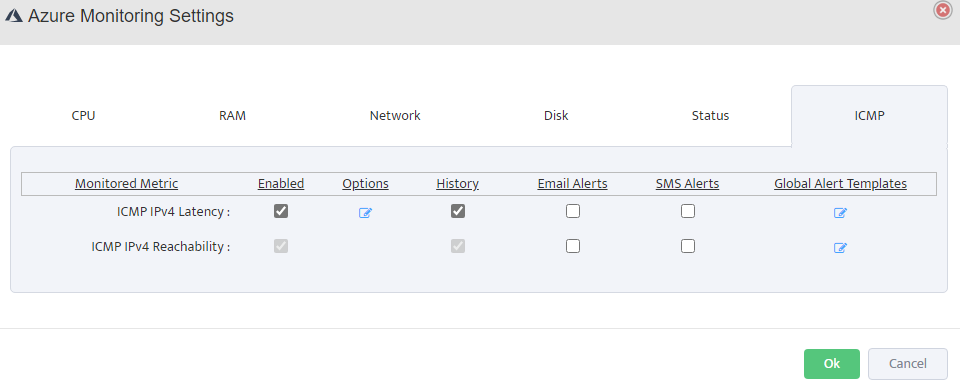
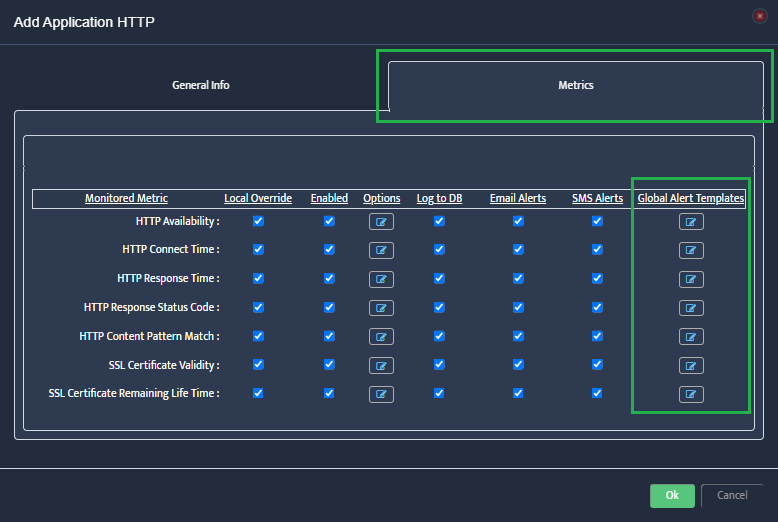
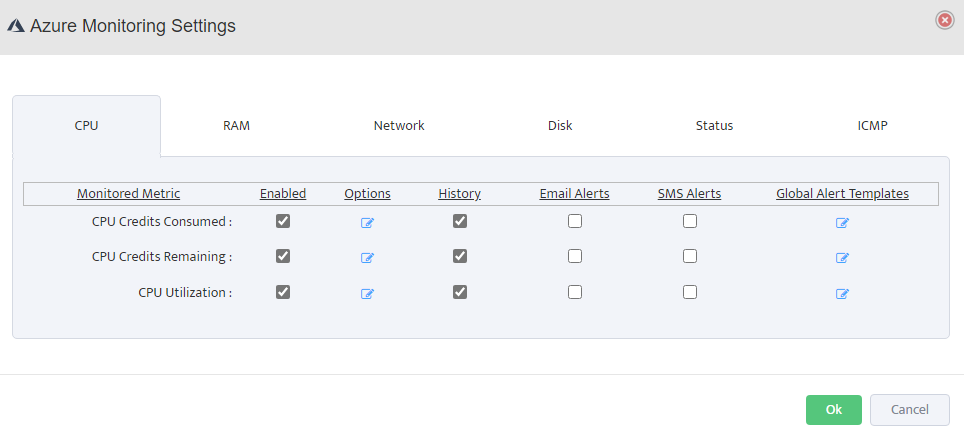
Configure Monitoring Settings
Click on Monitoring in the top navigation menu, then select Azure Monitoring Settings. Configure the following metrics for your Azure resources:
CPU Monitoring: Enable CPU Credits Consumed, CPU Credits Remaining, and CPU Utilization.
Configure thresholds, enable history, and set up email/SMS alerts as needed.
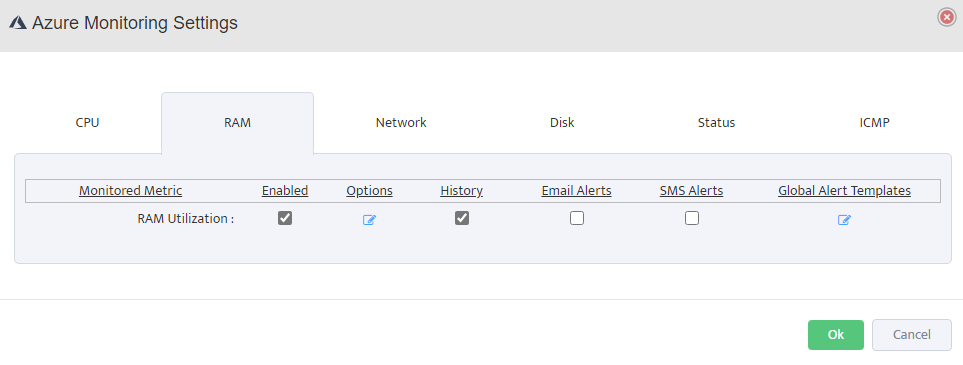
RAM Monitoring: Enable RAM Utilization monitoring, set alert thresholds (e.g., warning at 80%, critical at 90%), and configure alert destinations.
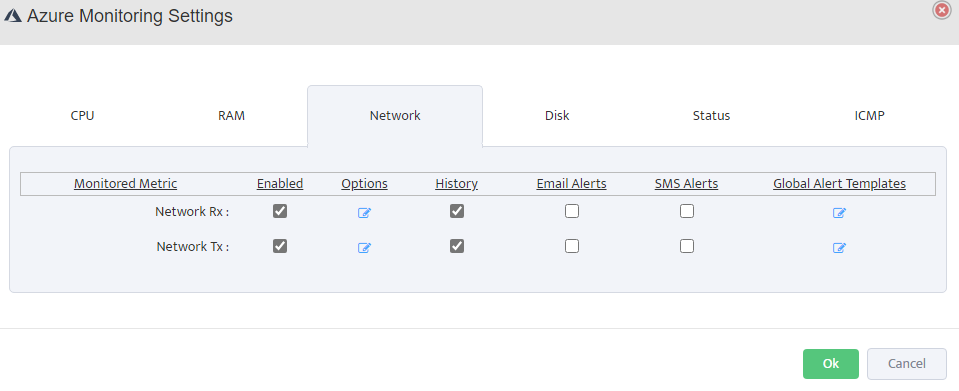
Network Monitoring: Enable Network Rx (Receive) and Network Tx (Transmit) to monitor inbound and outbound traffic.
Track bandwidth utilization and set alerts for unusual network activity.
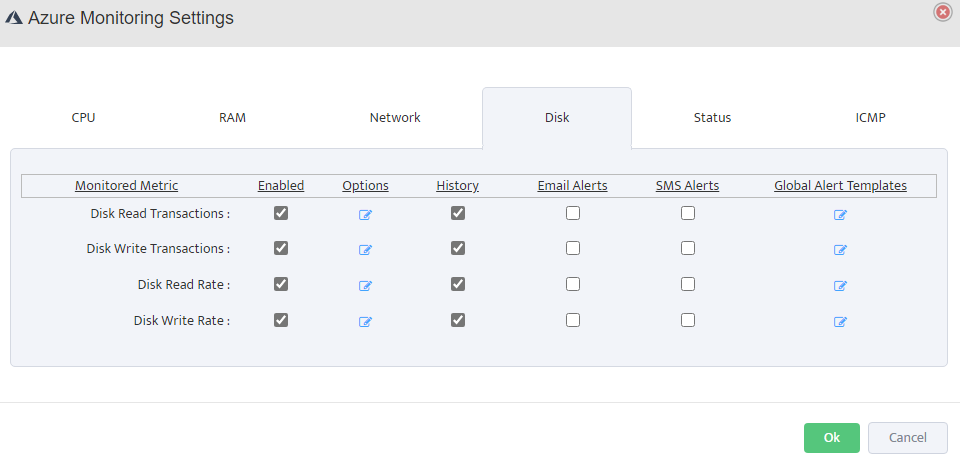
Disk Monitoring: Enable Disk Read/Write Transactions and Disk Read/Write Rate to monitor IOPS and throughput.
Configure appropriate thresholds based on your workload requirements.
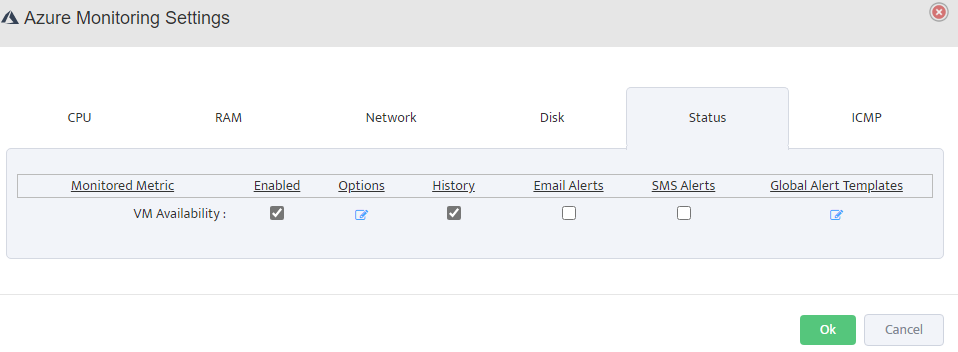
Status Monitoring: Enable VM Availability monitoring to track uptime and set alerts for VM state changes or downtime events.
ICMP Monitoring: Enable ICMP IPv4 Latency and Reachability to verify network connectivity.
Set latency thresholds and configure packet loss alerts.