Nectus Integration with Palo Alto Firewall API
Step-by-Step Configuration Guide
Overview
This document provides a guide for Nectus integration with Palo Alto Networks firewalls.
The integration enables automated discovery and monitoring of Palo Alto firewall devices through API connectivity.
Prerequisites
Before beginning the integration process, ensure you have your Palo Alto firewall management IP address and administrative access.
You will also need to generate an API key from the Palo Alto firewall with appropriate permissions.
Configuration Steps
1. Generate API Key from Palo Alto Firewall
To generate an API key, make a POST request to the firewall’s hostname or IP address using the administrative credentials and type=keygen:
curl -H “Content-Type: application/x-www-form-urlencoded” -X POST https://firewall/api/?type=keygen -d ‘user=<user>&password=<password>’
Replace ‘firewall’ with your Palo Alto management IP address or hostname, and provide your administrative username and password.
A successful API call returns status=”success” along with the API key within the key element:
<response status=”success”>
<result>
<key>***********************************************</key> </result>
</response>
Copy the entire API key string including any symbols such as equal signs. This key will be used for authentication in Nectus configuration.
Note that if you generate a new key for the same user, all existing sessions will end and previous API sessions will be deleted.
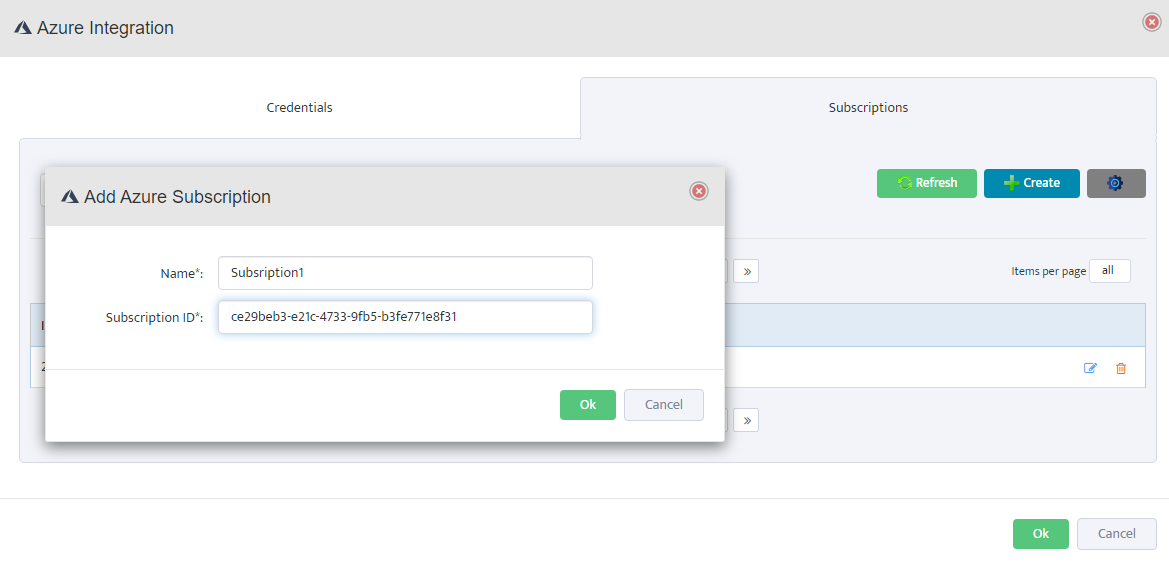
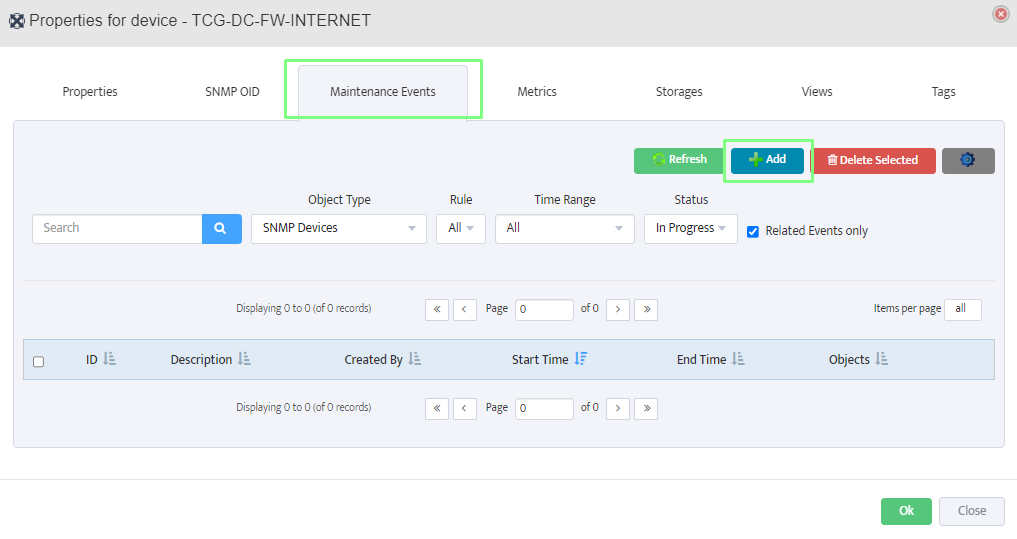
2. Configure Palo Alto Firewall API Keys in Nectus
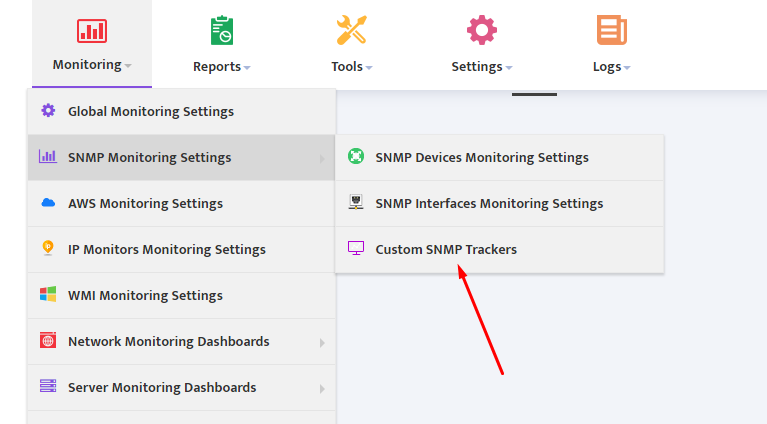
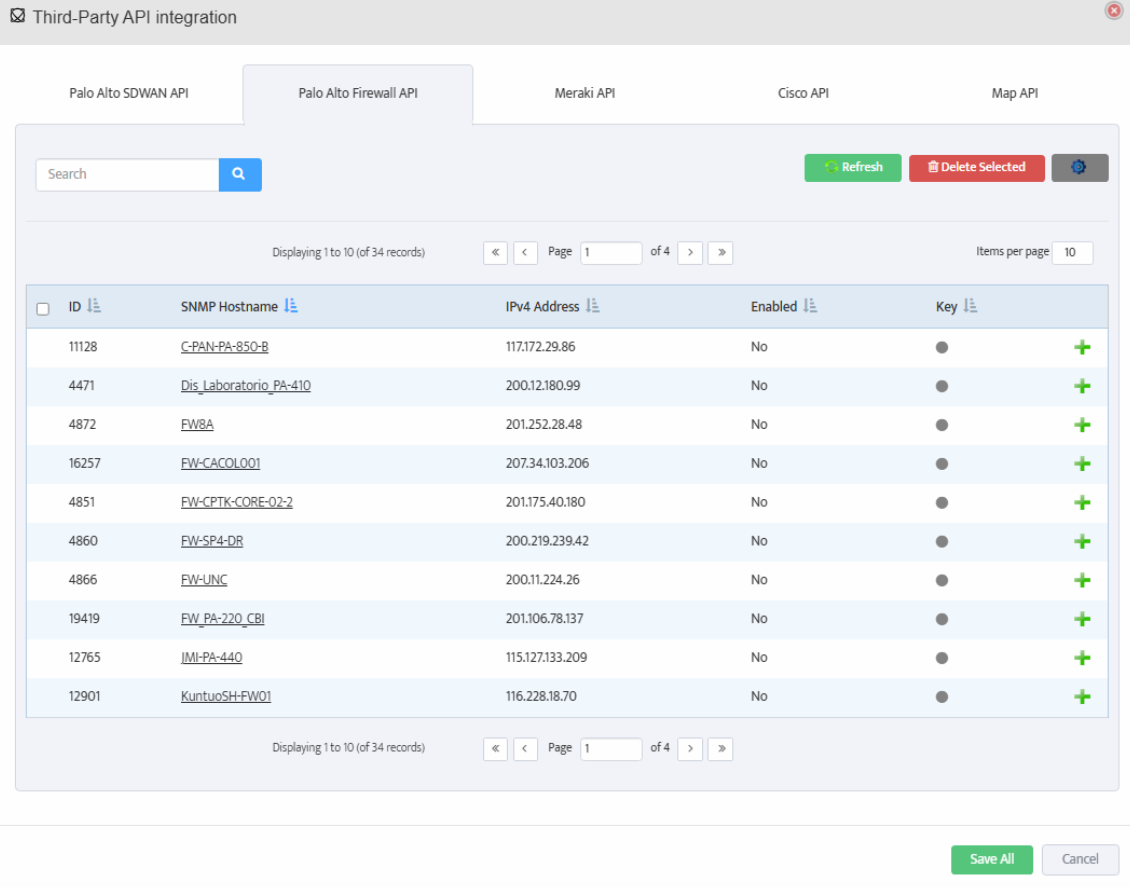
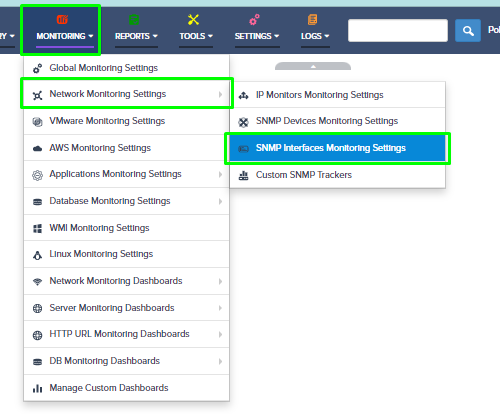
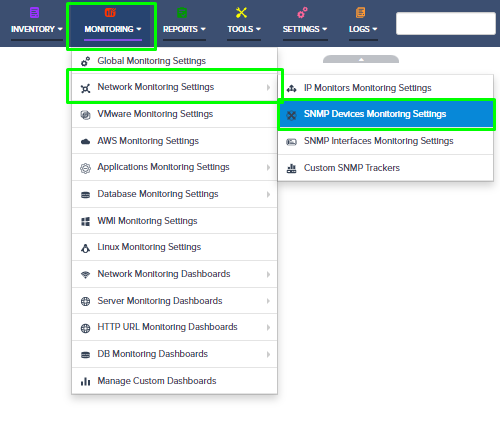
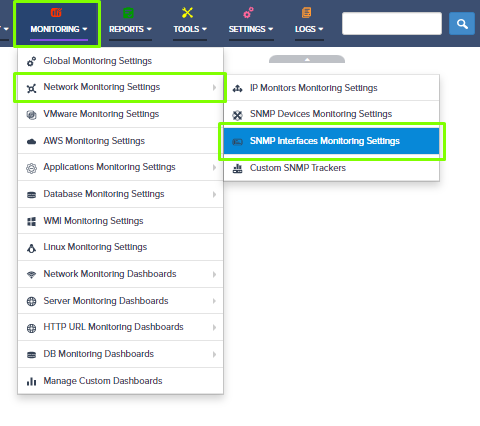
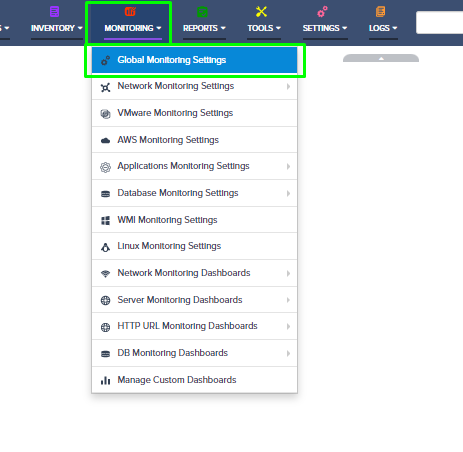
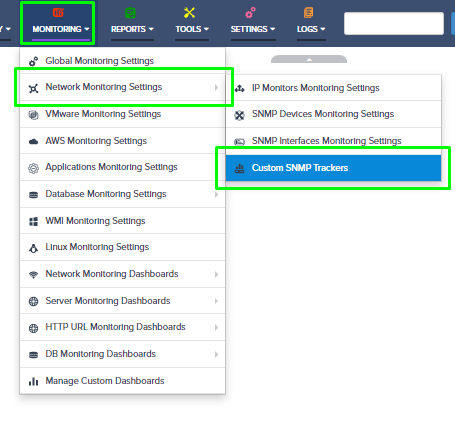
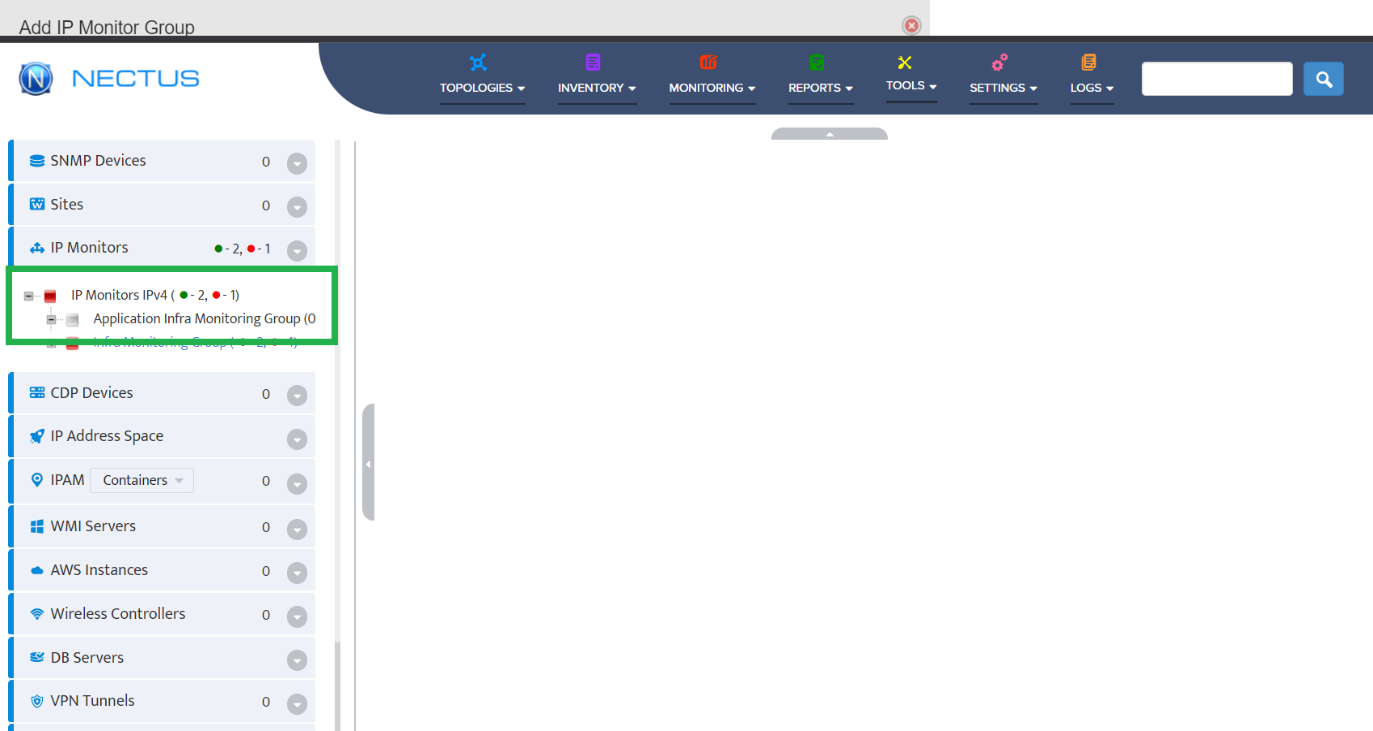
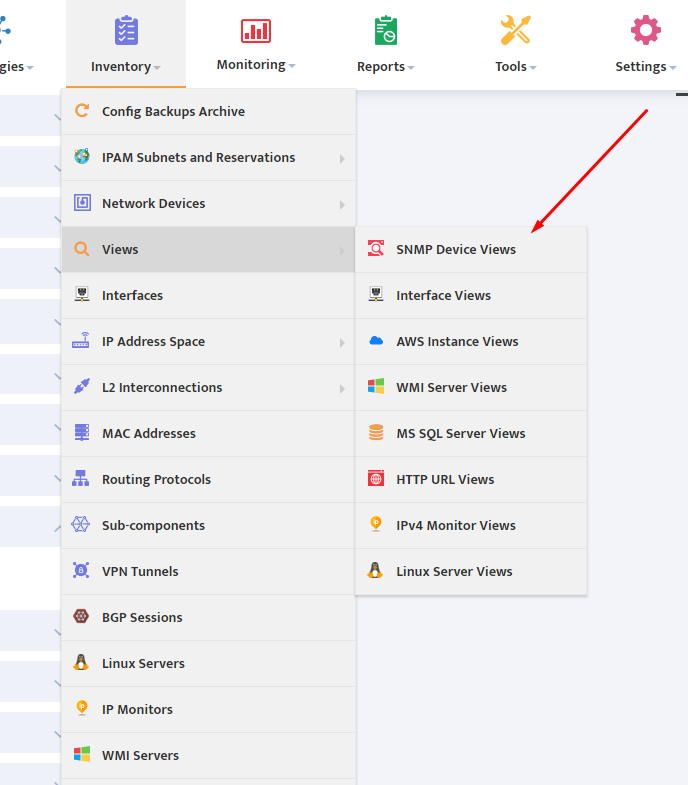
Open the Nectus console and navigate to Settings → Third-Party API Integration.
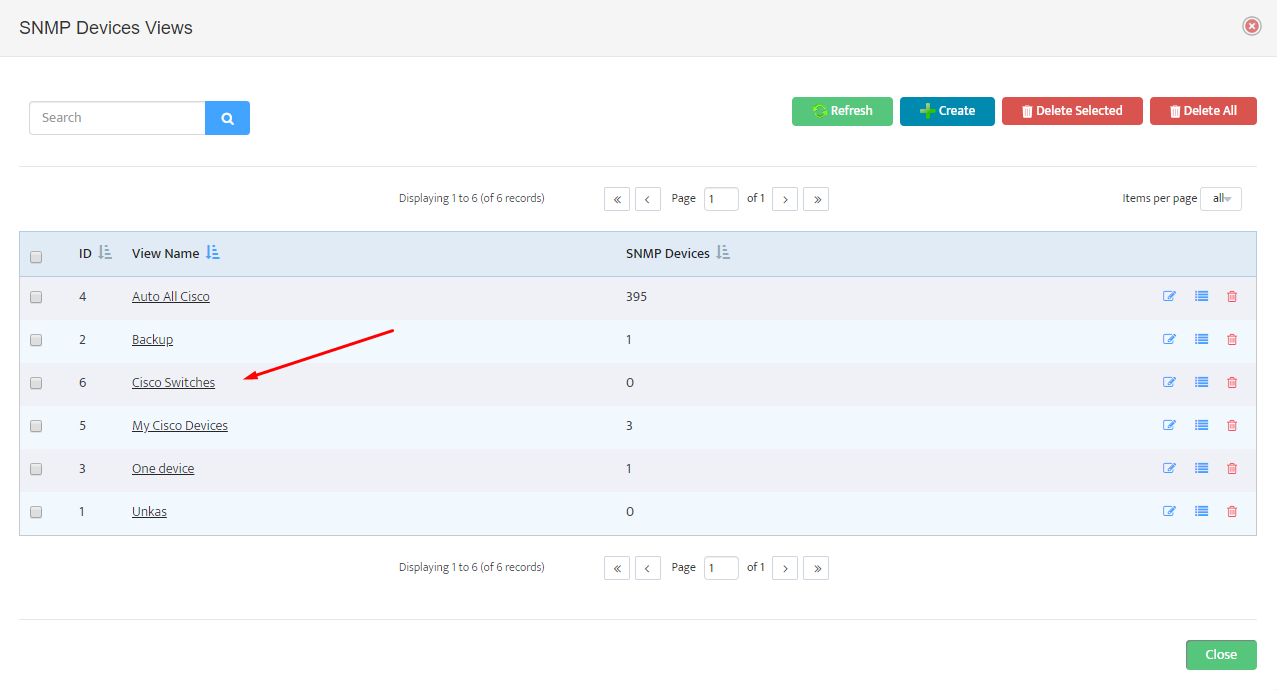
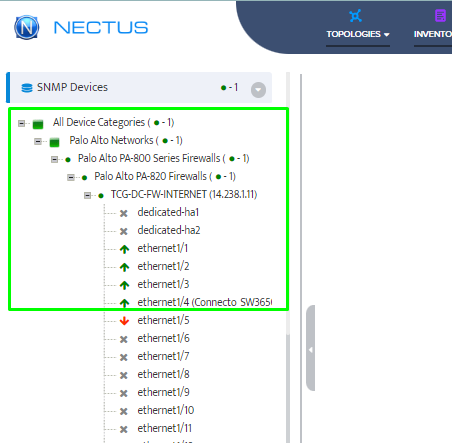
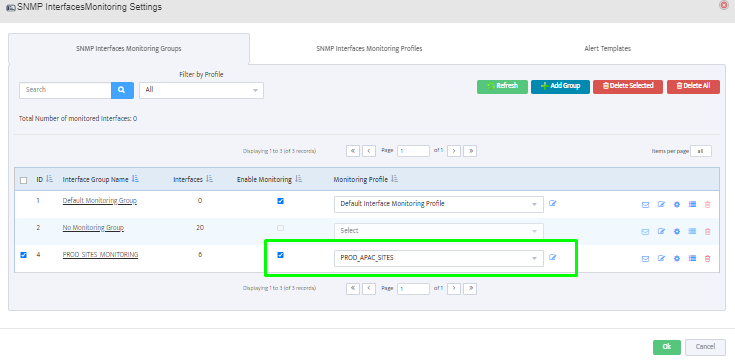
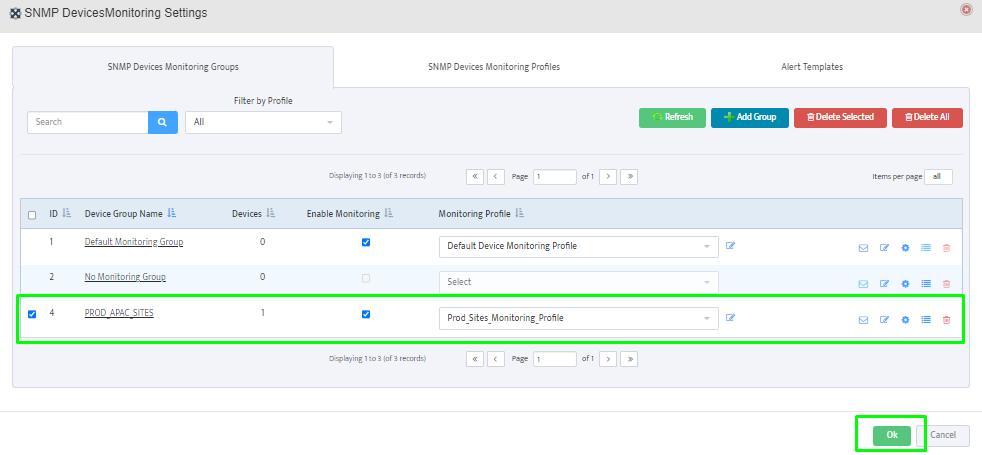
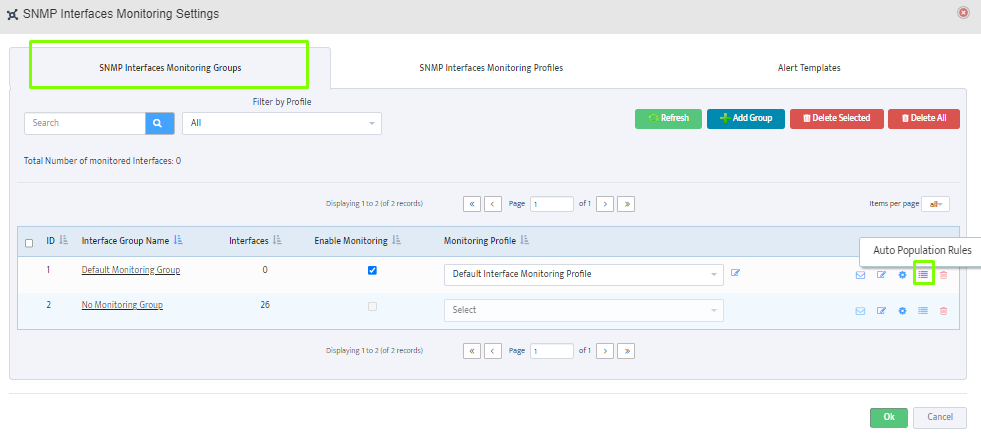
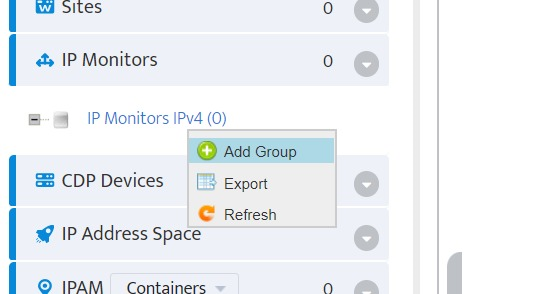
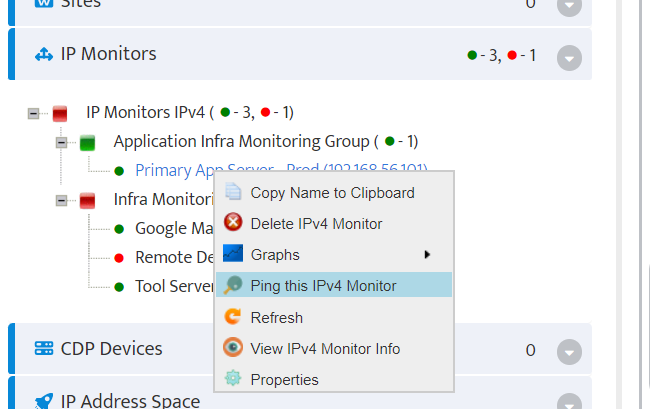
Click on the Palo Alto Firewall API tab to view the list of discovered Palo Alto firewalls.
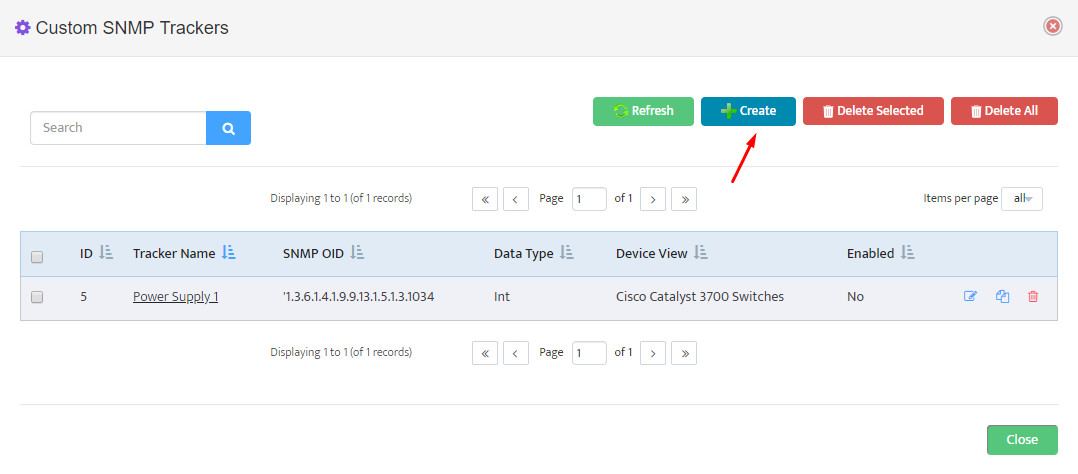
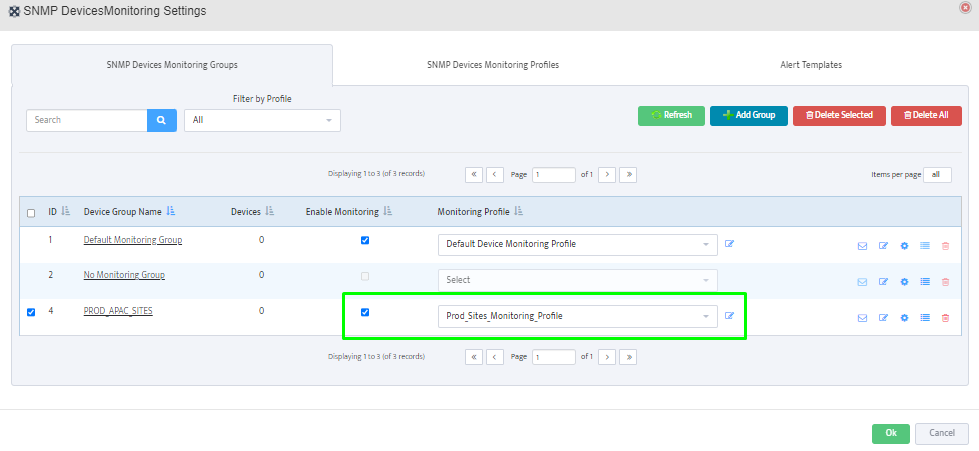
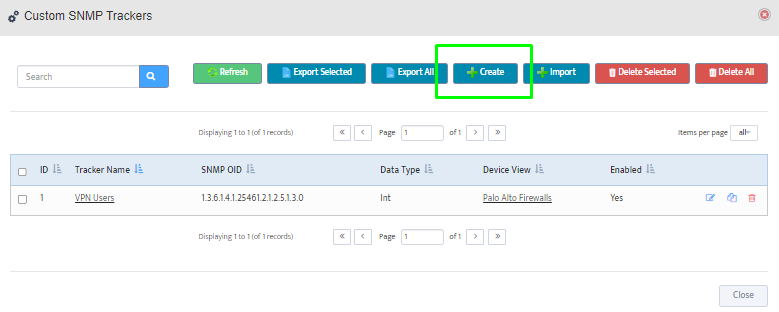
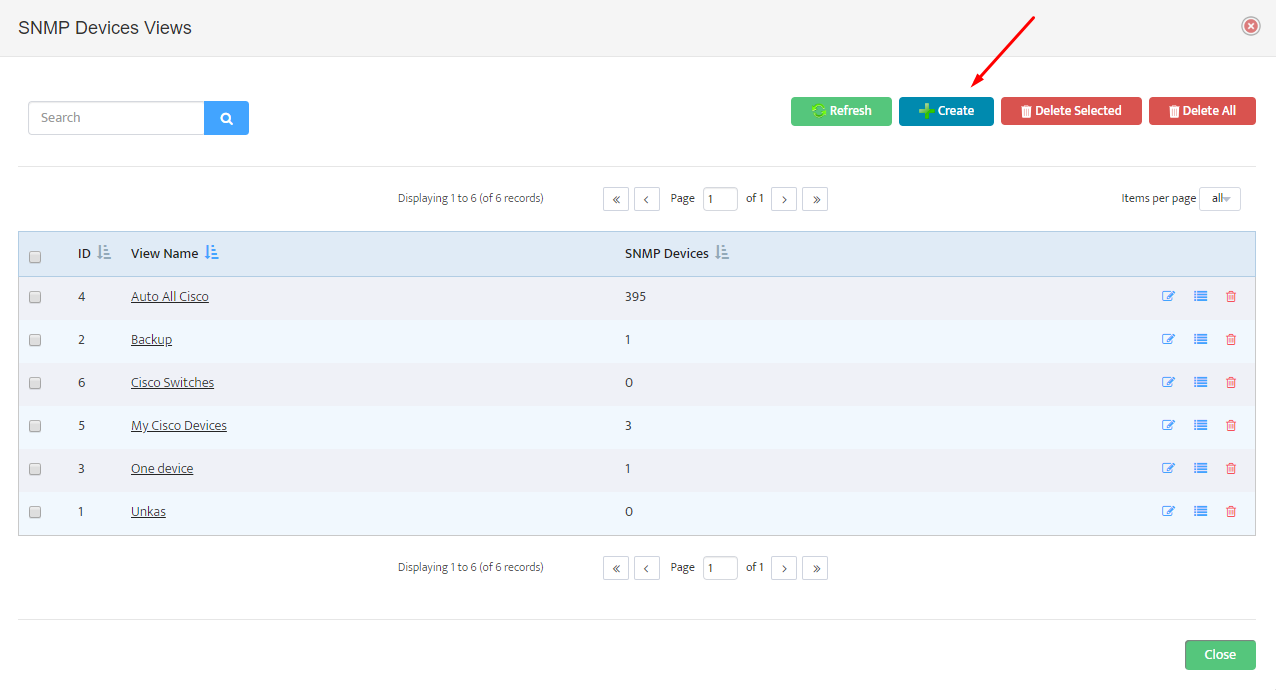
The table displays columns for ID, SNMP Hostname, IPv4 Address, Enabled status, and Key.
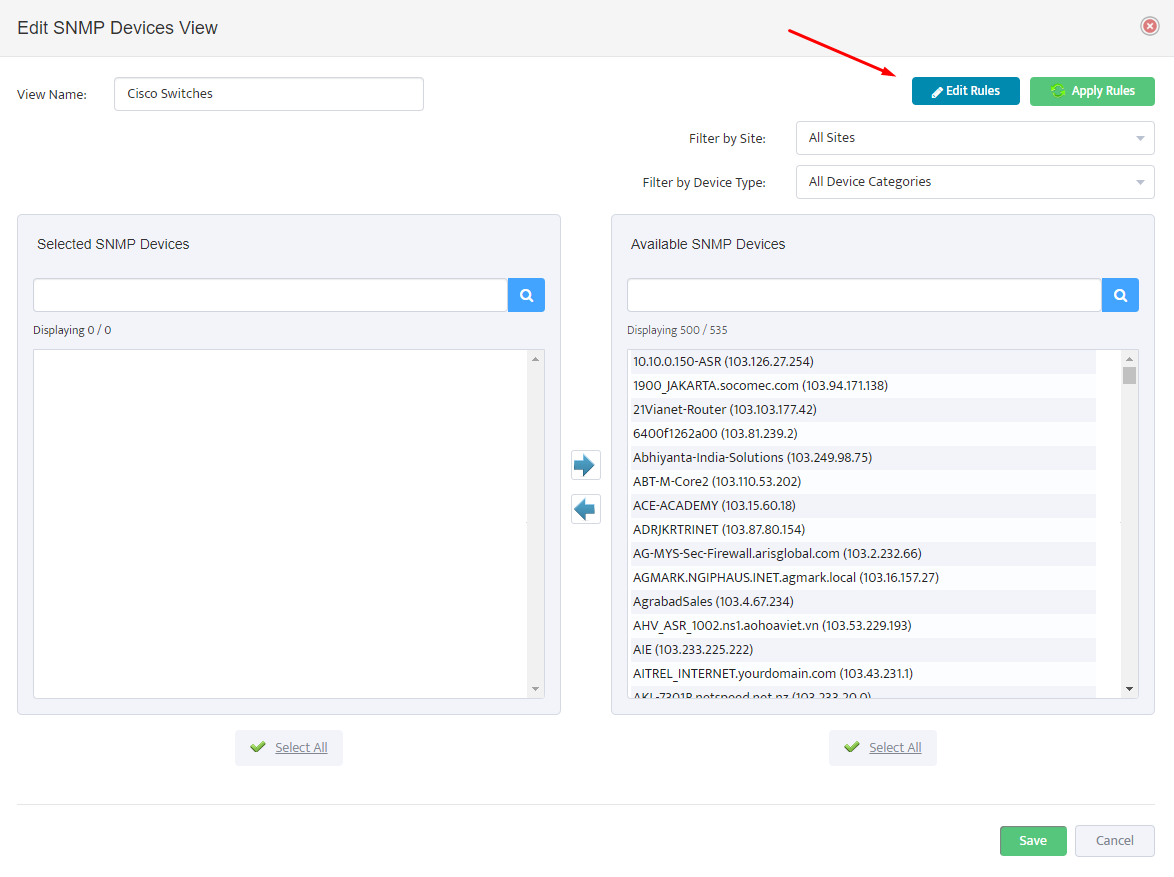
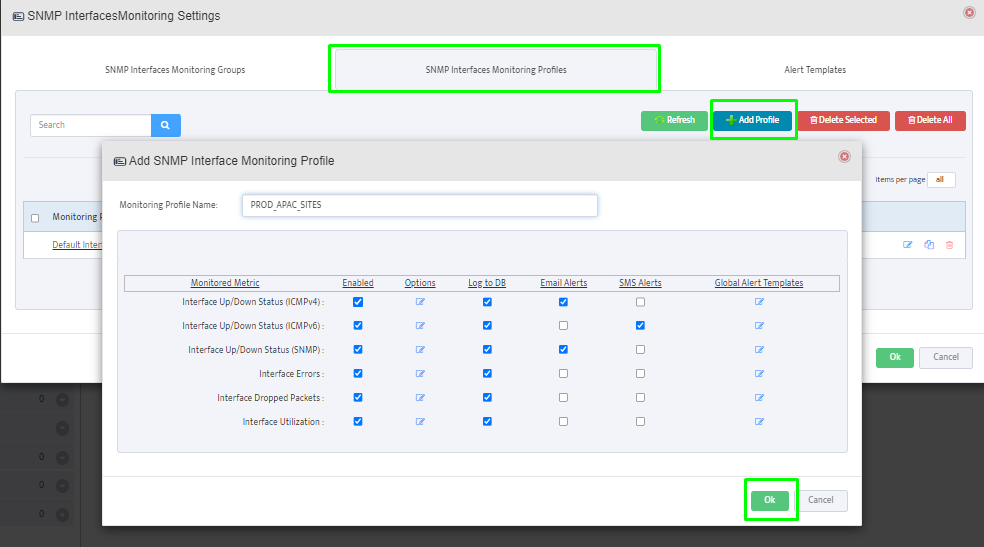
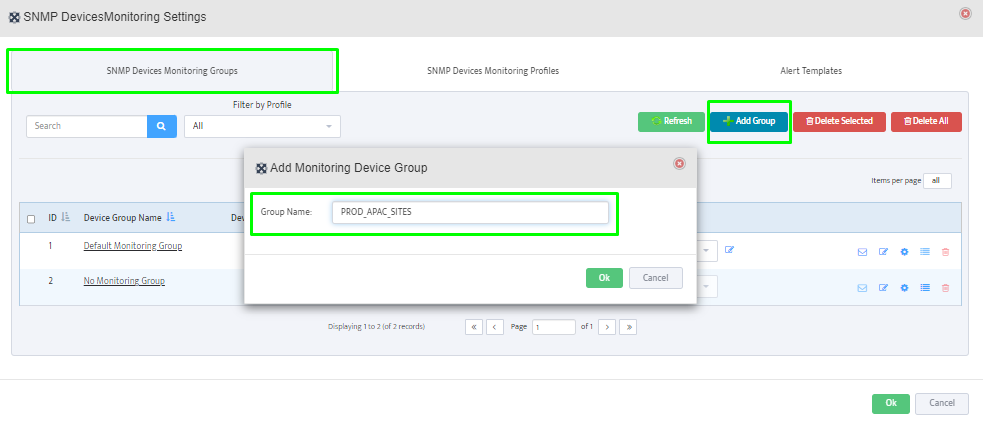
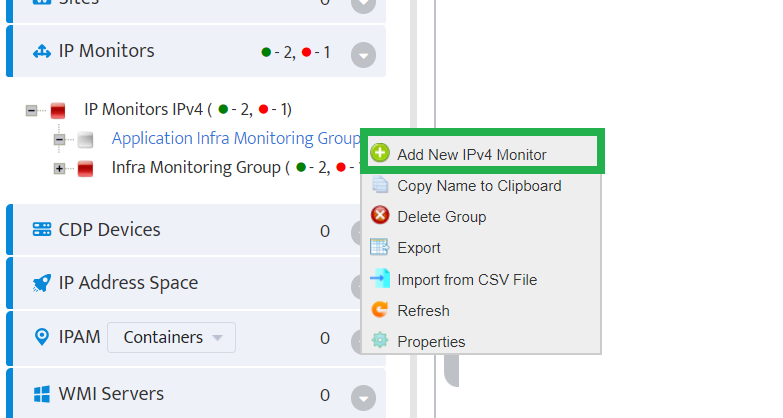
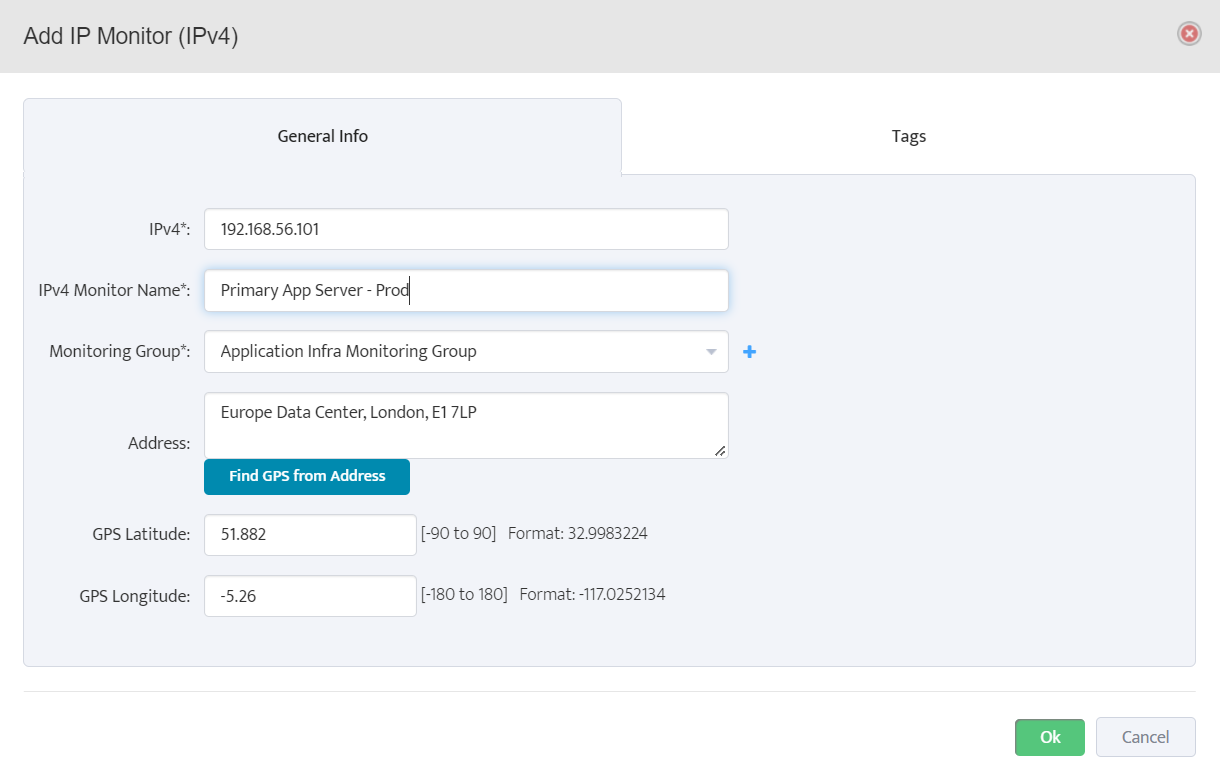
For each firewall you want to monitor, click the + button to open the Add Palo Alto Firewall API Key dialog.
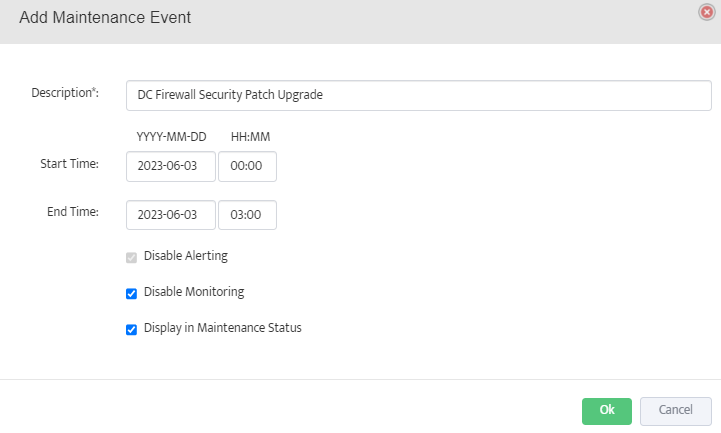
3. Add API Key and Test Connection
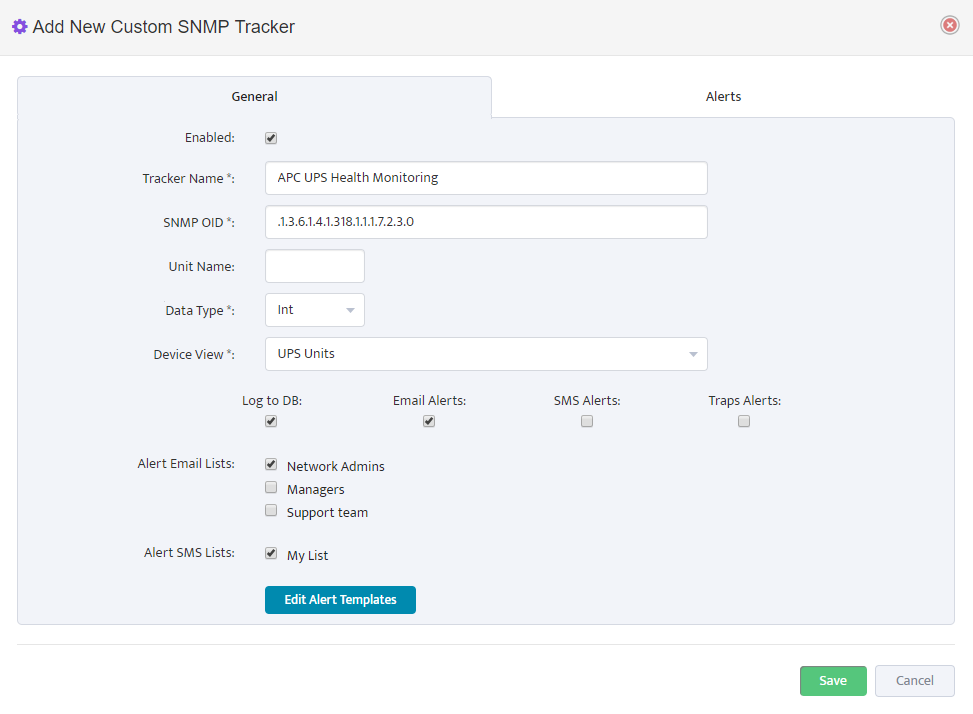
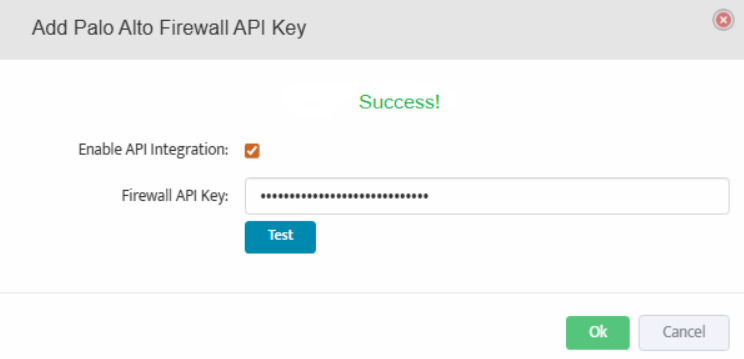
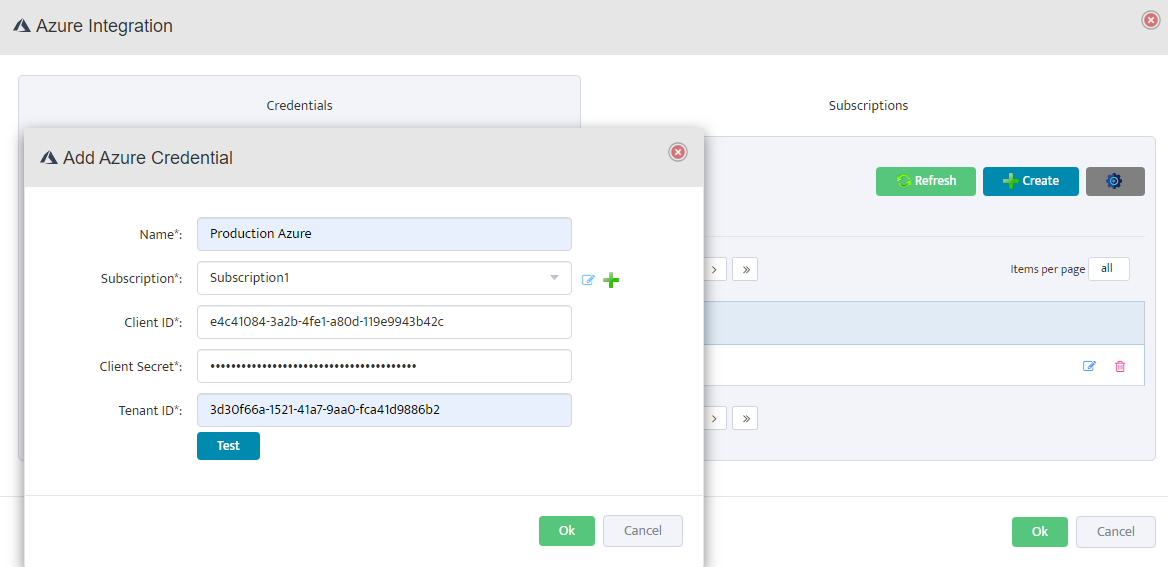
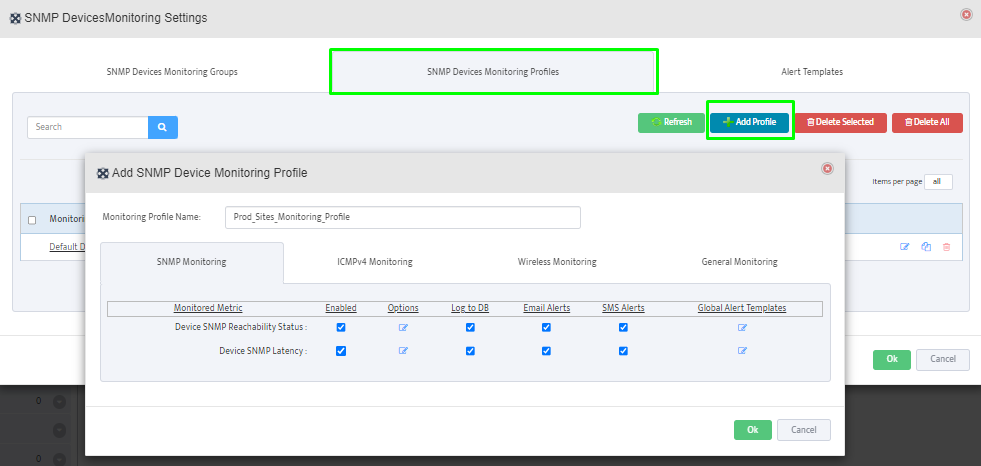
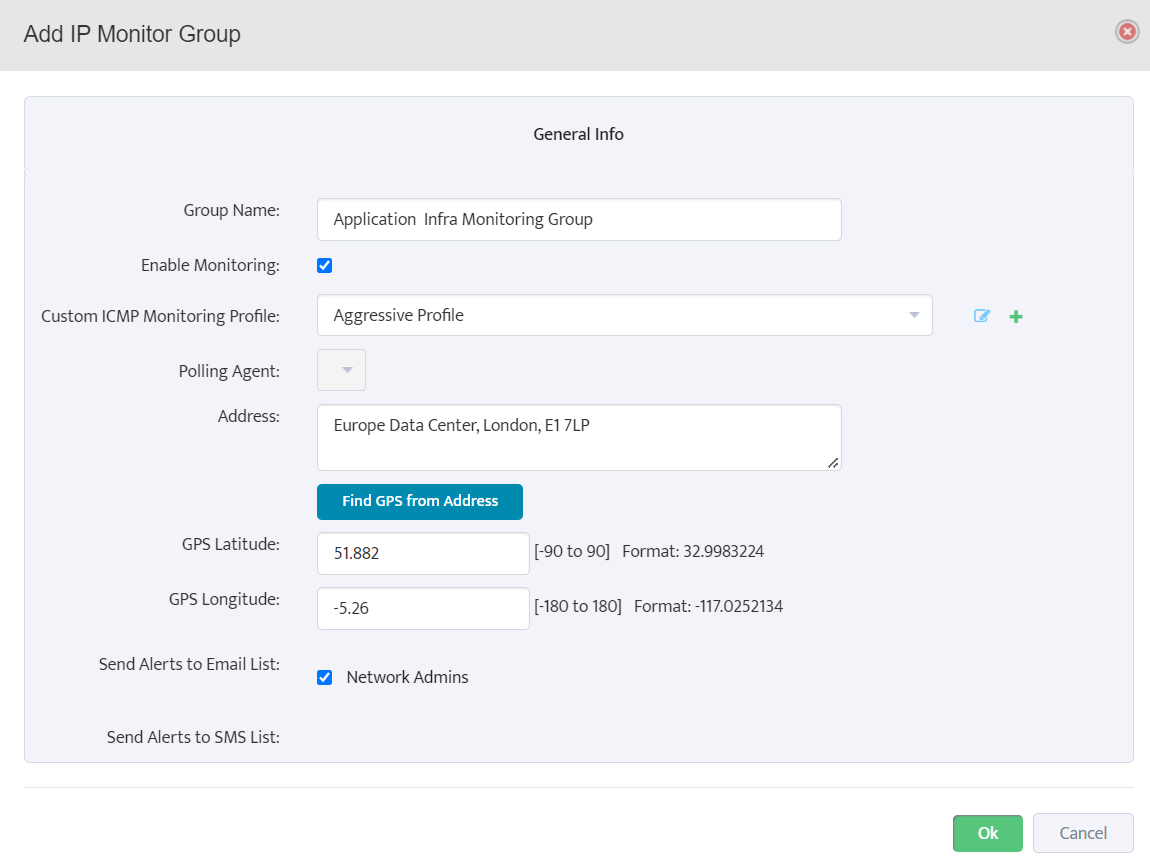
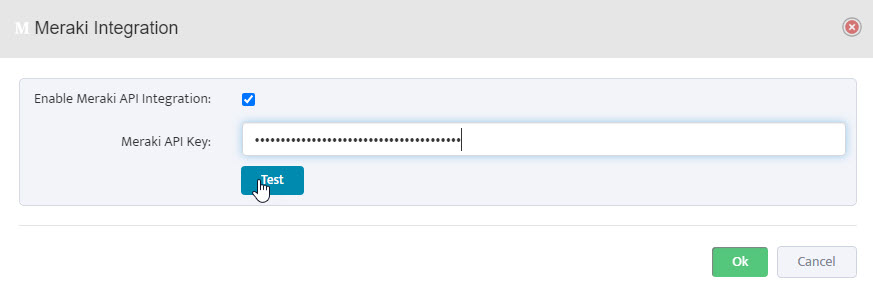
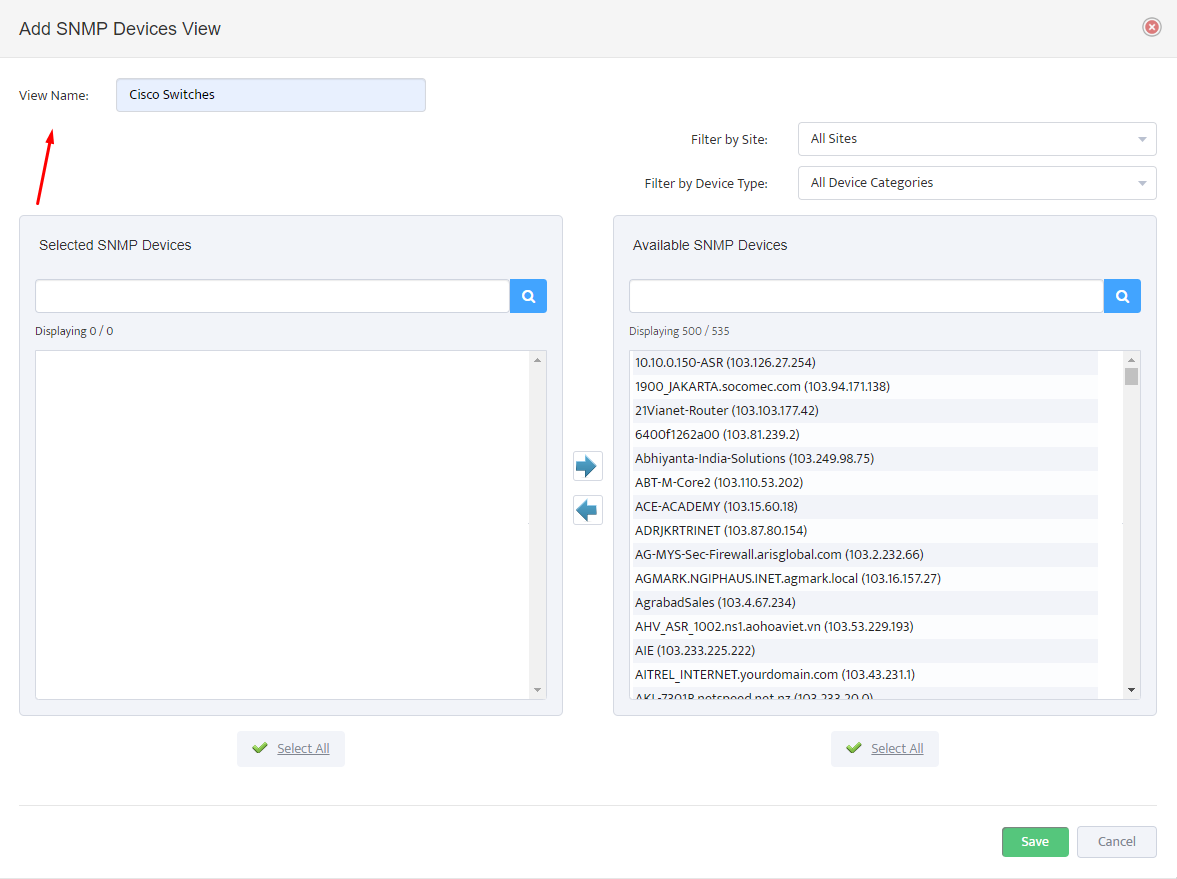
In the Add Palo Alto Firewall API Key dialog, check the box for Enable API Integration.
Paste the API key generated in Step 1 into the Firewall API Key field.
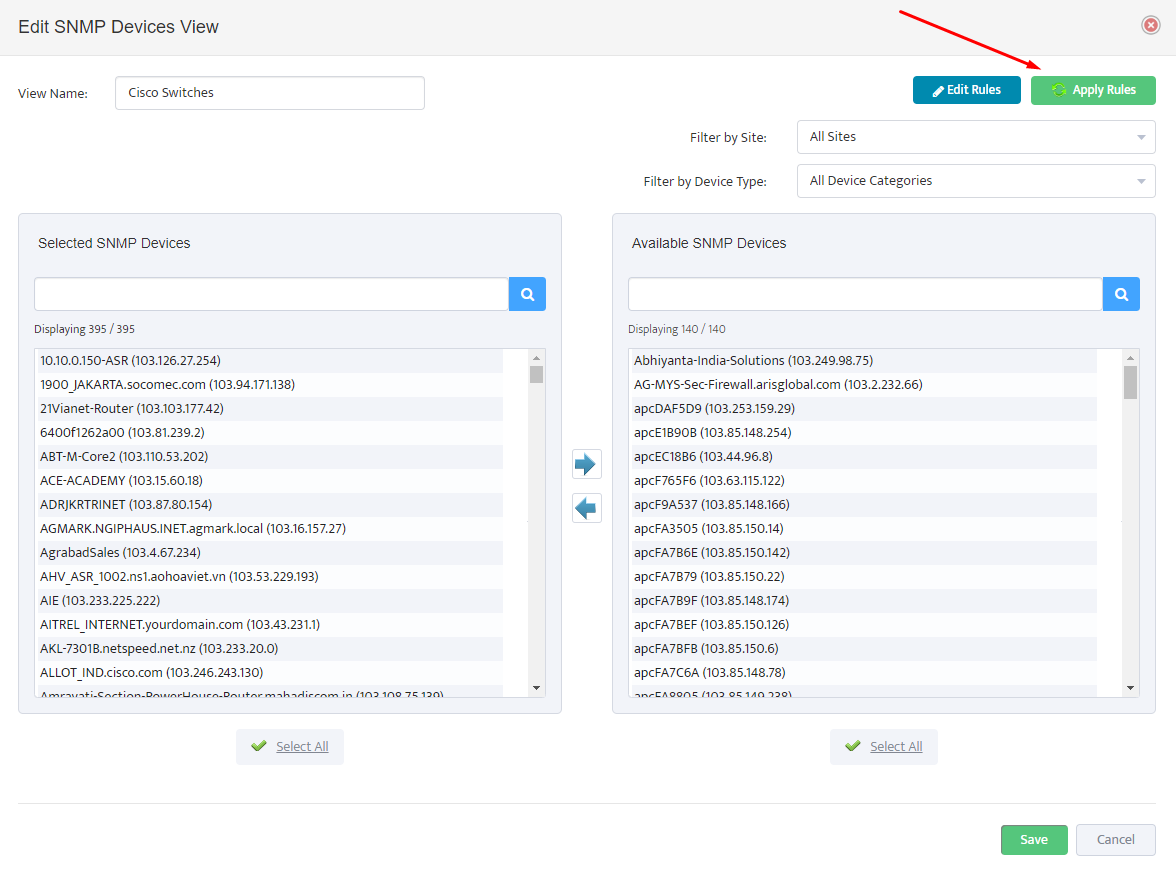
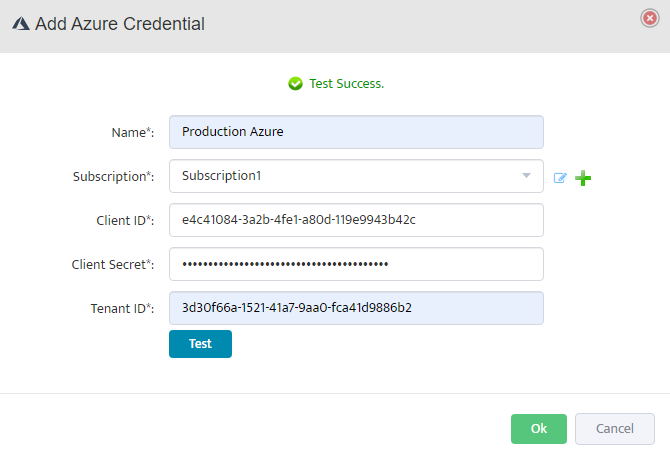
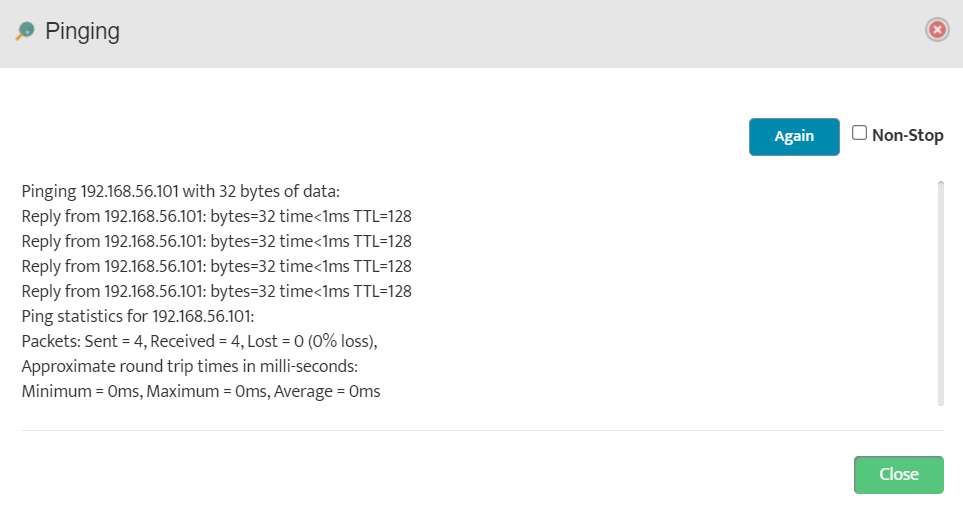
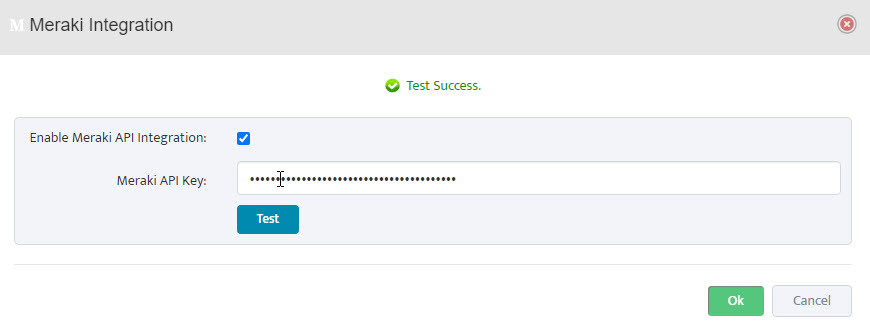
Click the Test button to verify the API connection. A Success message will appear if the connection is successful.
Click OK to save the configuration.
4. Save Configuration
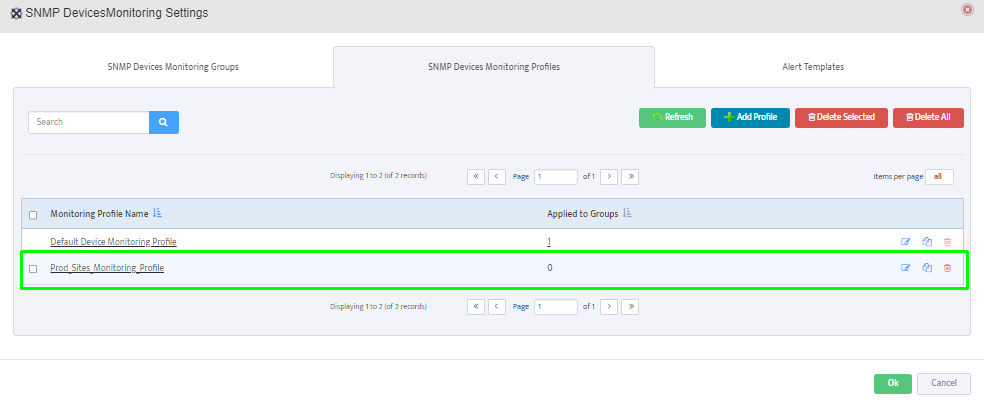
Repeat Step 2 and Step 3 for each firewall you want to monitor.
After configuring API keys for all required firewalls, click Save All at the bottom of the Third-Party API Integration page to save all configurations.
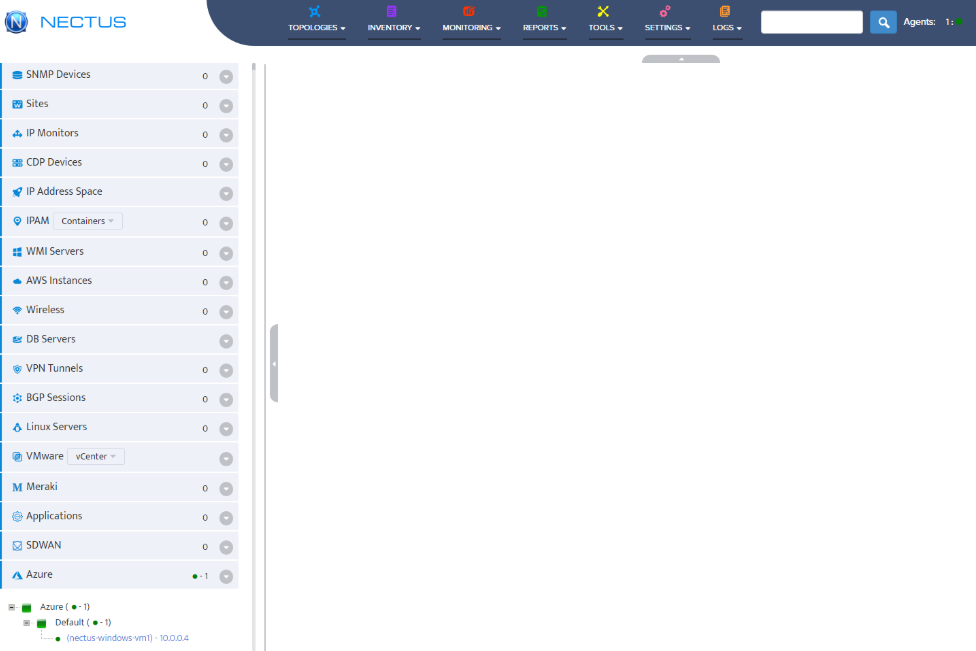
Nectus will now begin monitoring your Palo Alto firewalls and collecting performance metrics, security events, and configuration data through the API.


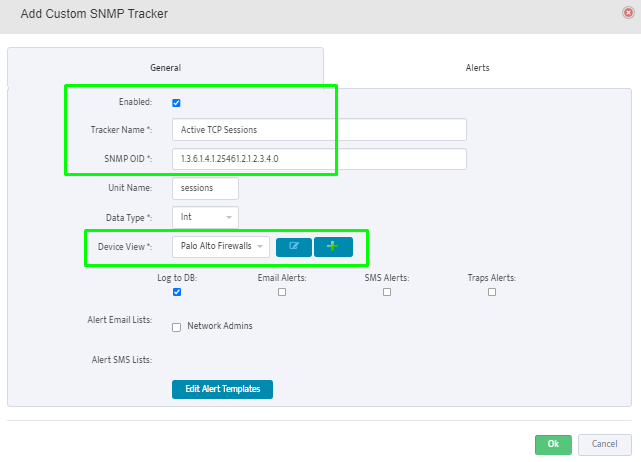


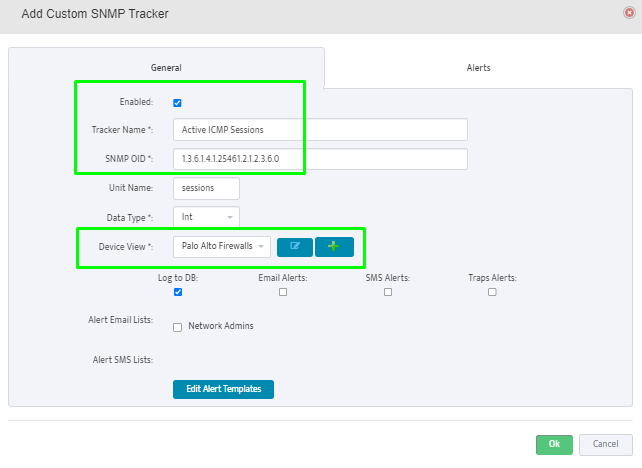


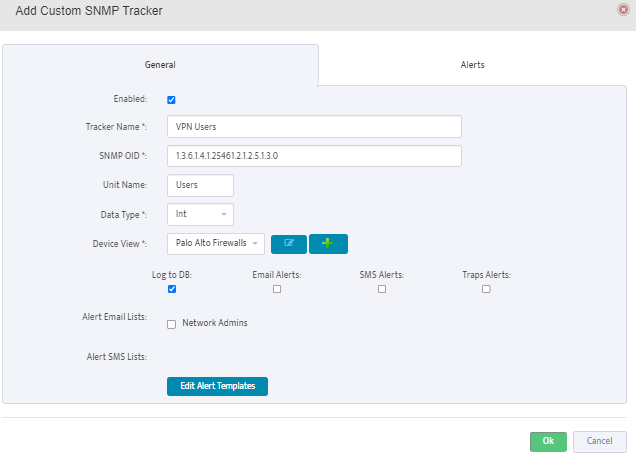


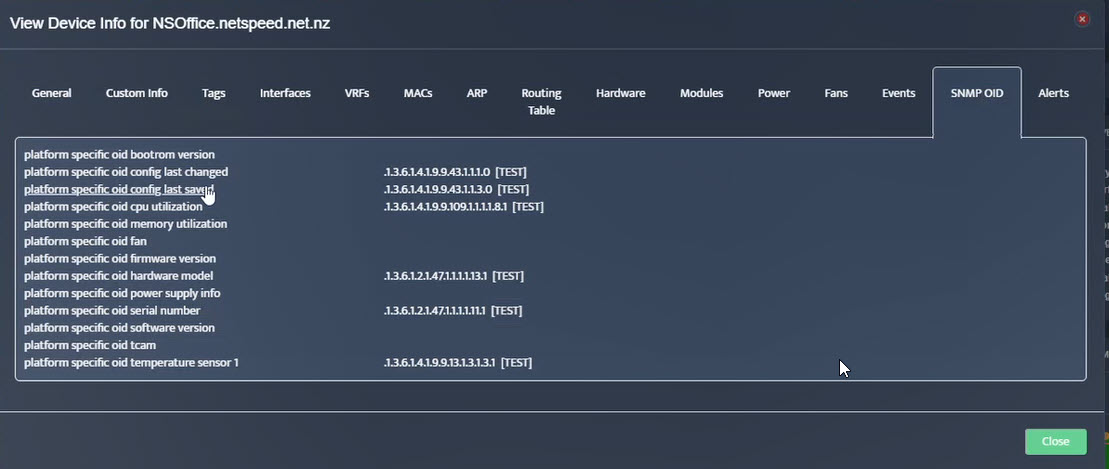
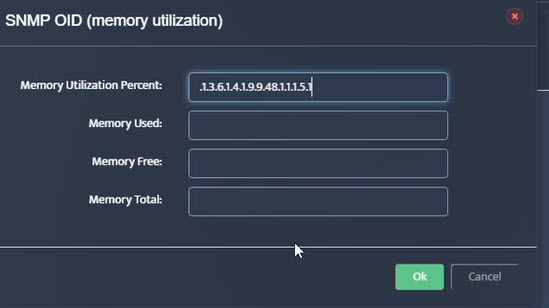
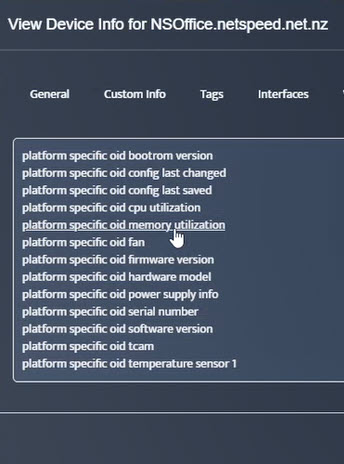 Step 5. To enter platform specific OID for memory utilization, click on the text.
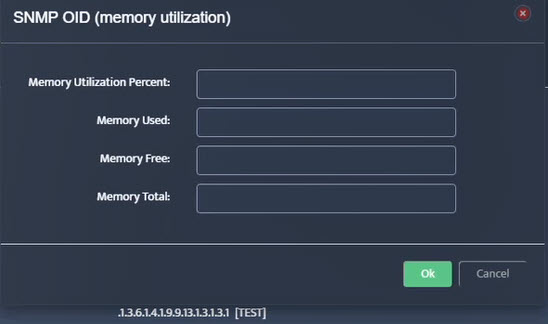

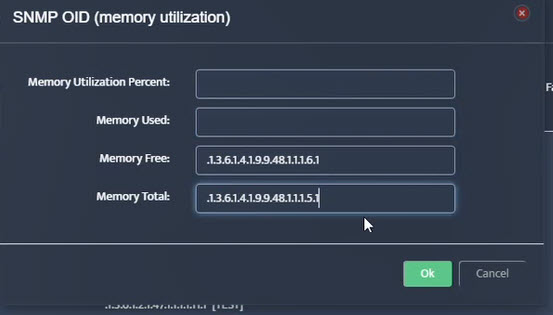
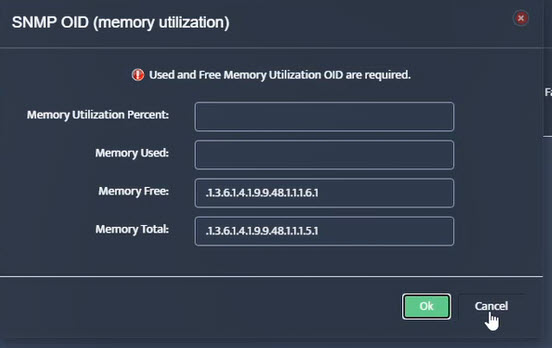 Step 7. Click on the OK button. Nectus will provision the OID information, unless an error is discovered.
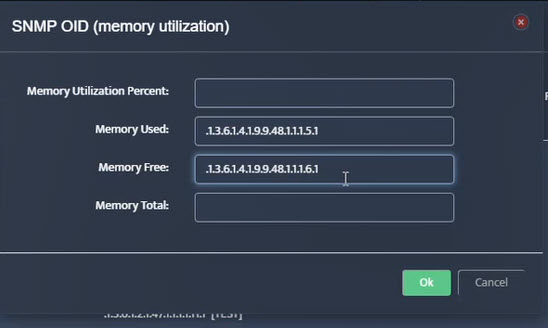

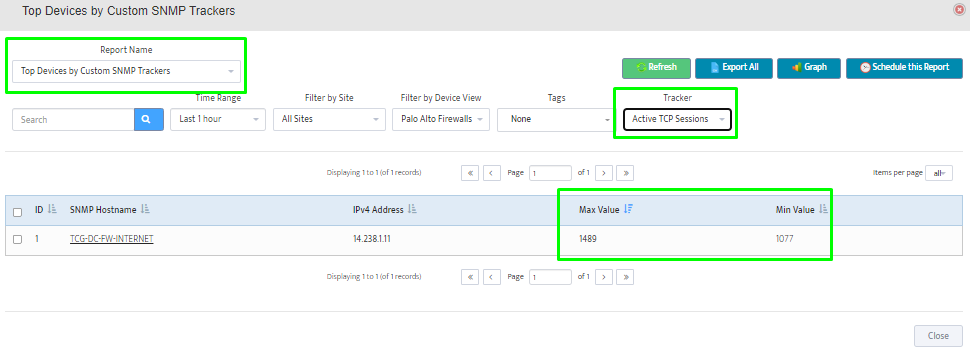
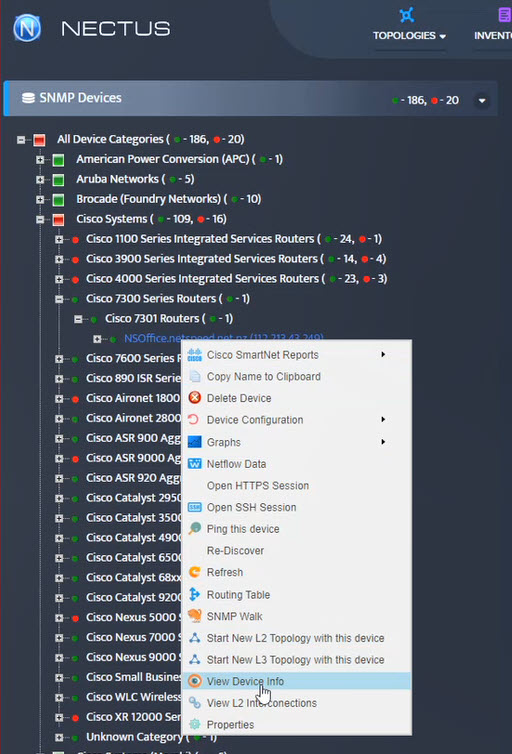
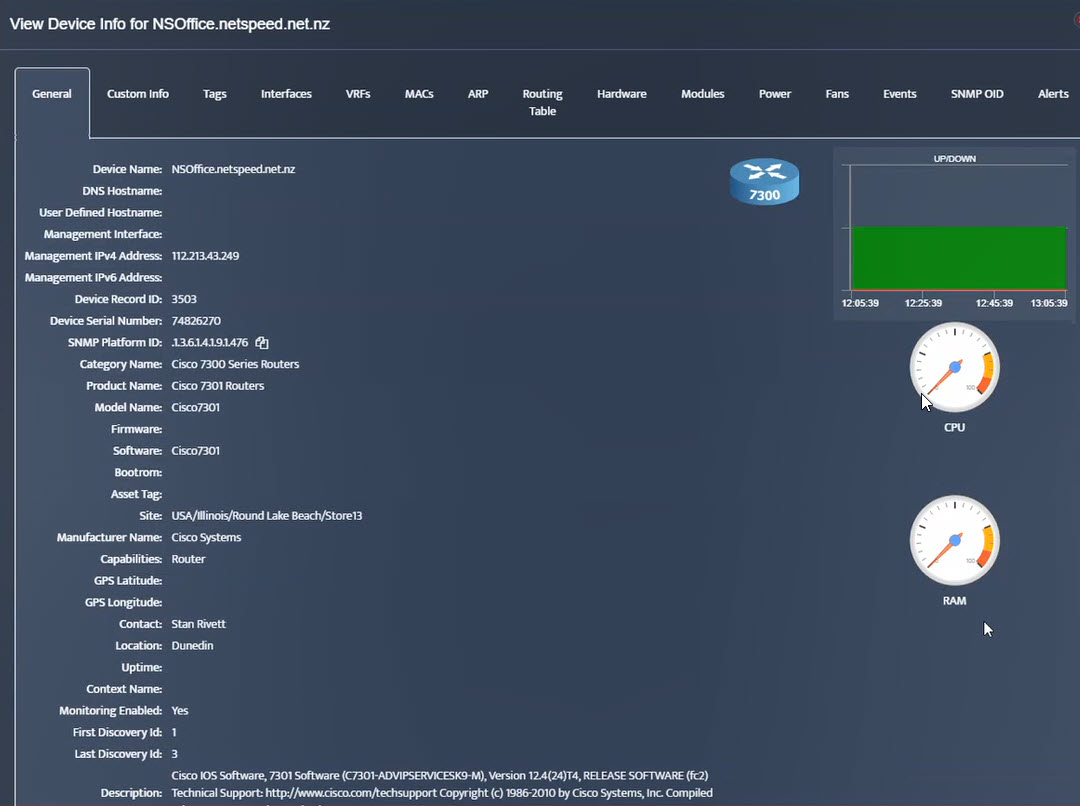
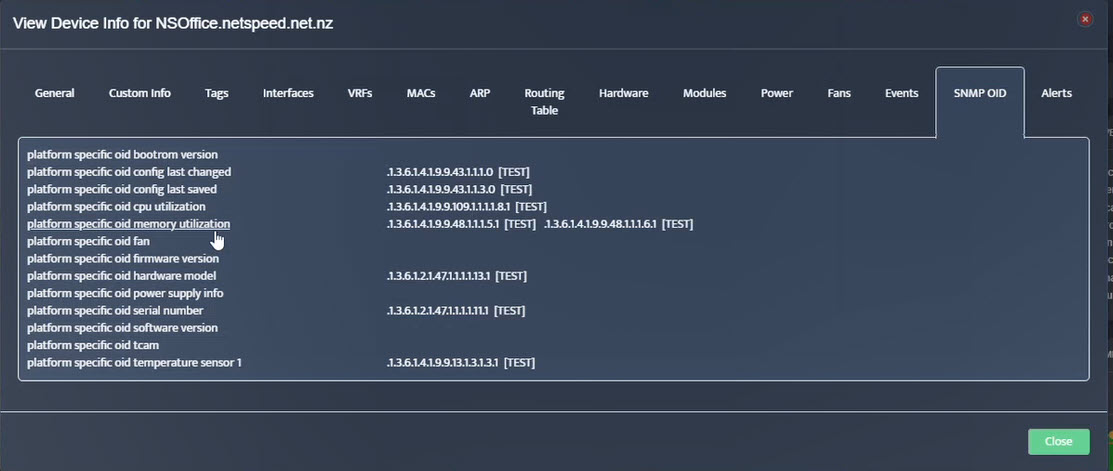 Step 8. The OID assignments are accepted and displayed on the View Device window.
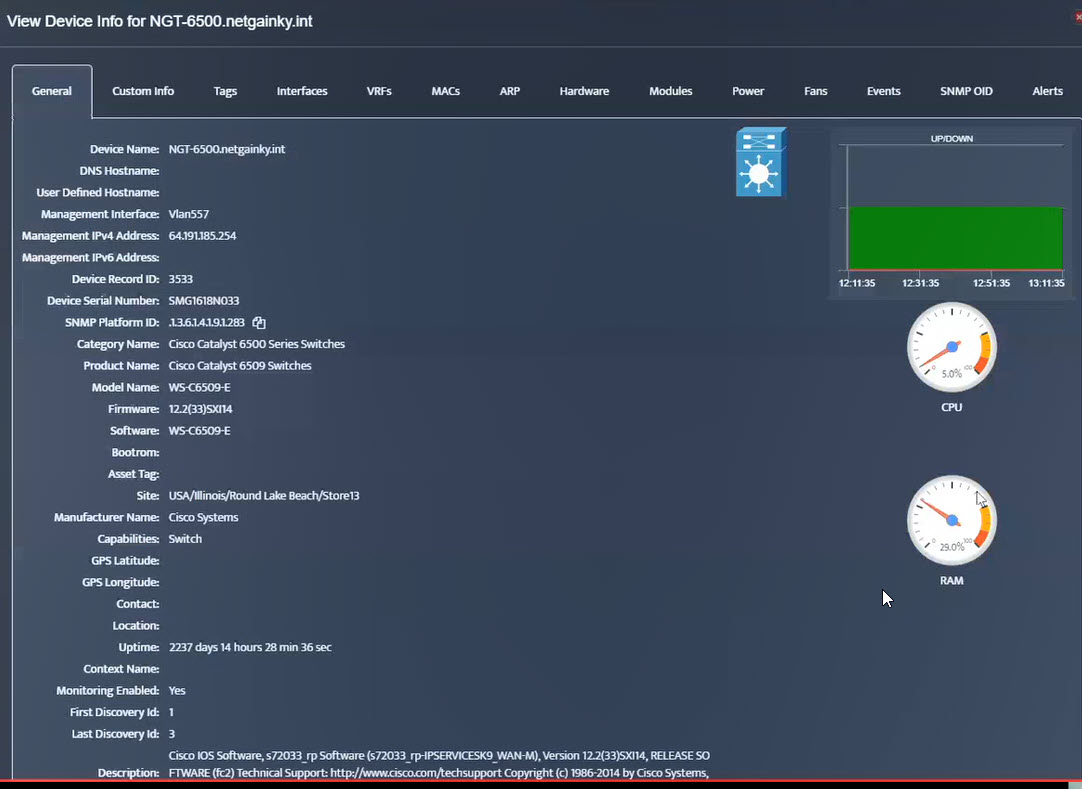
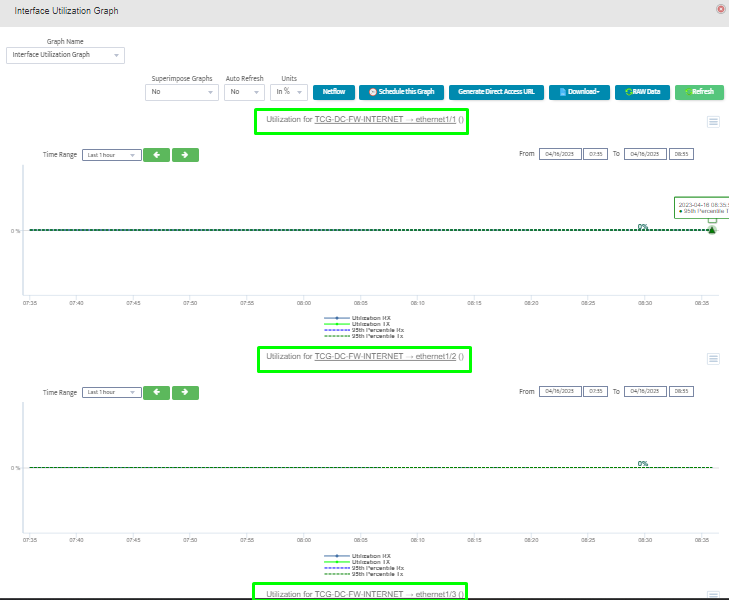
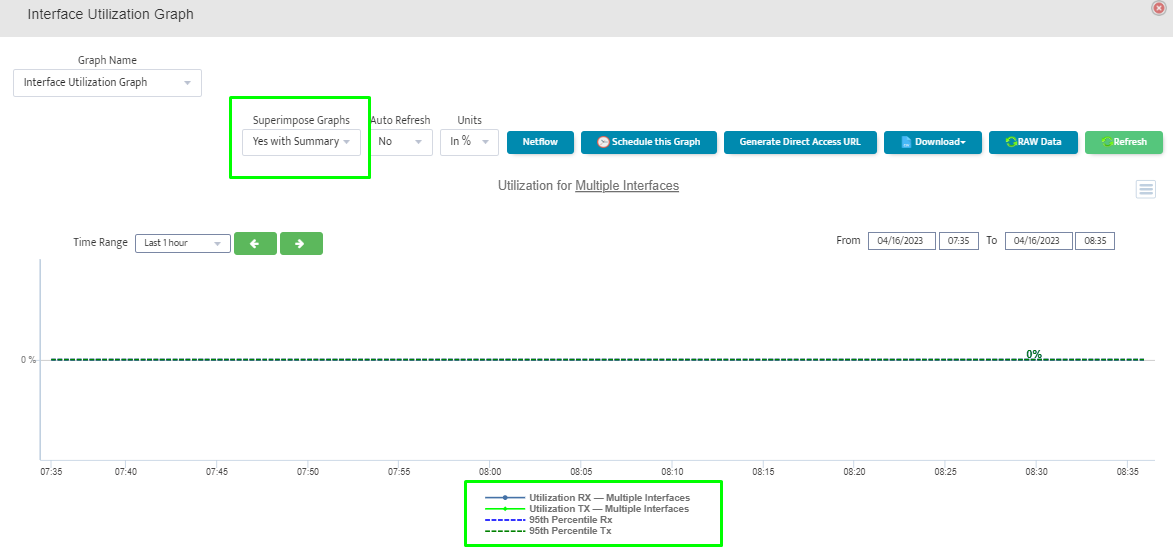
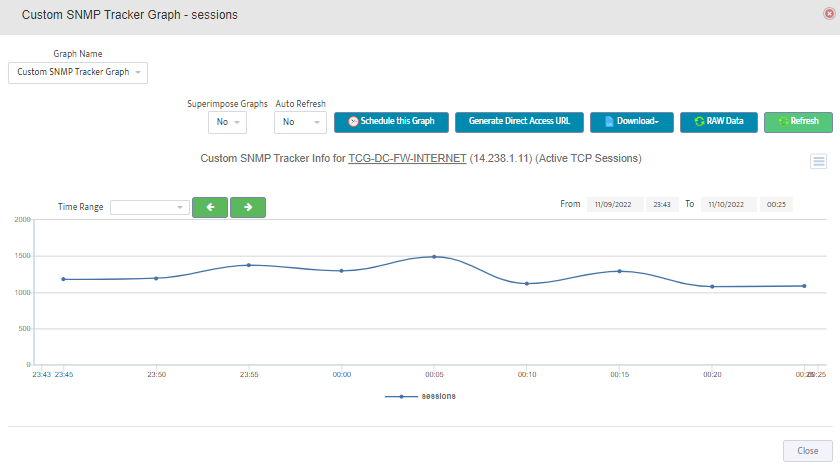
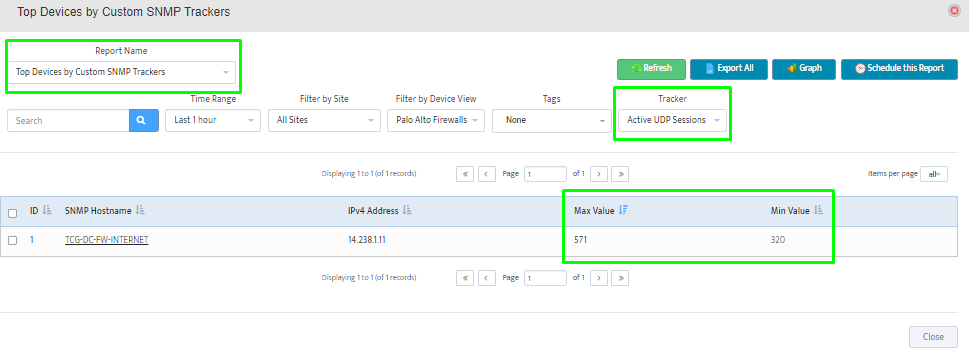
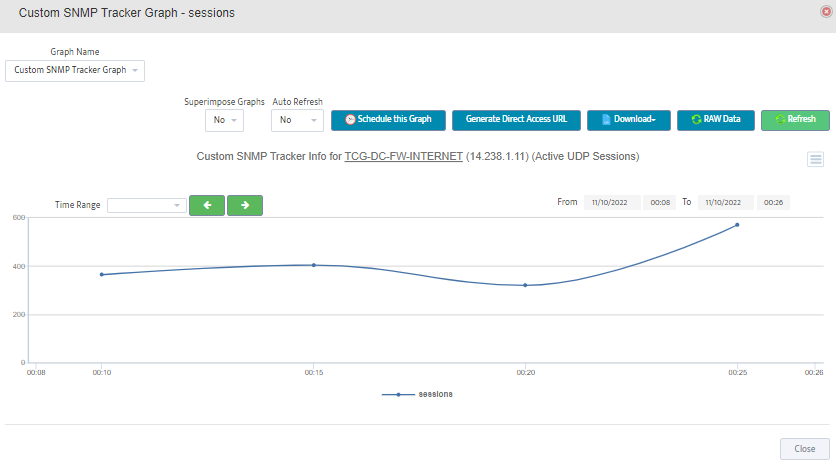
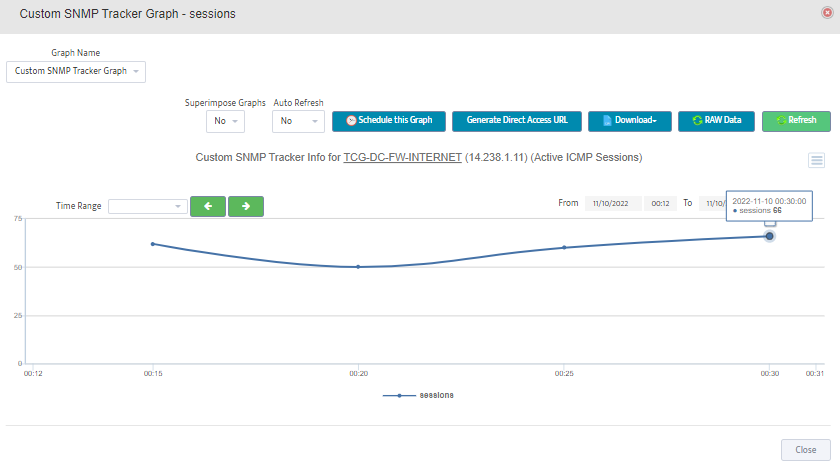
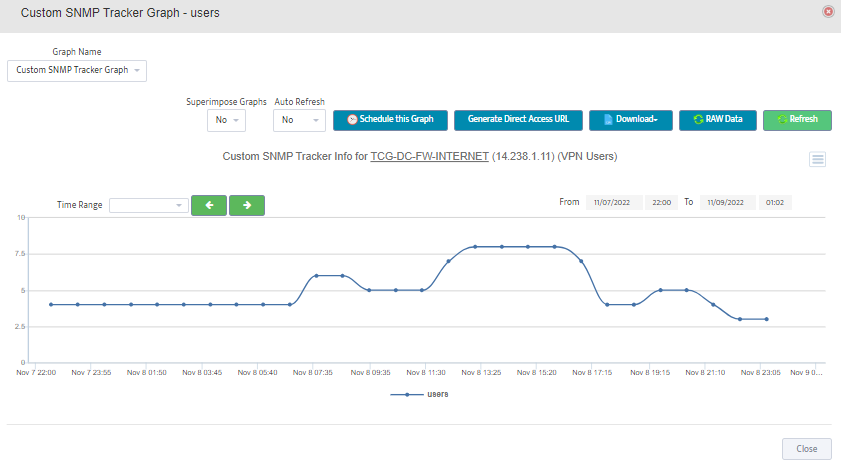
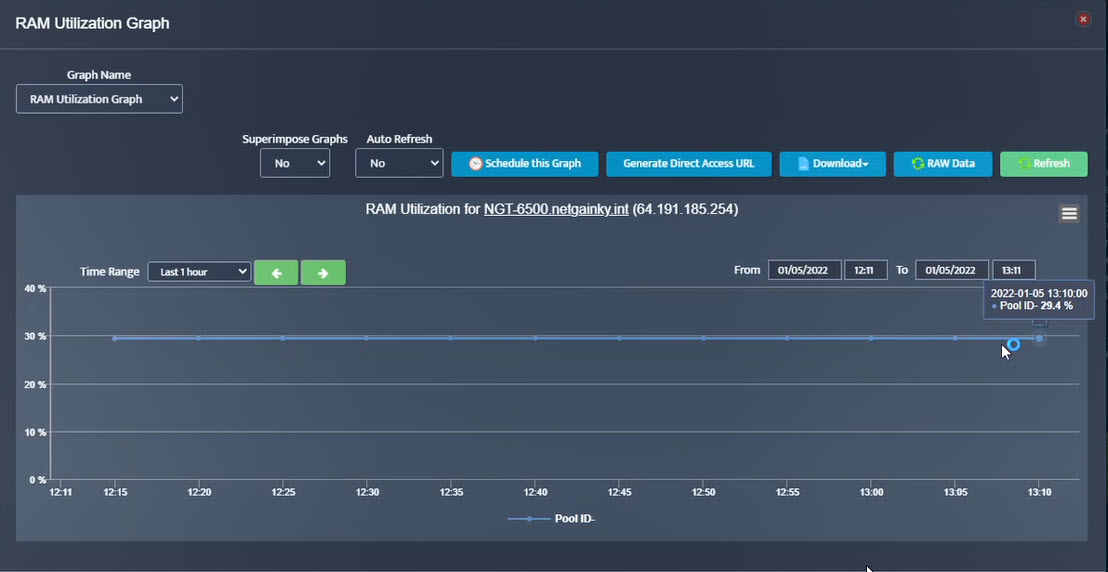 Step 2. Testing: Click on the dial to see a graph of the measurement over time.
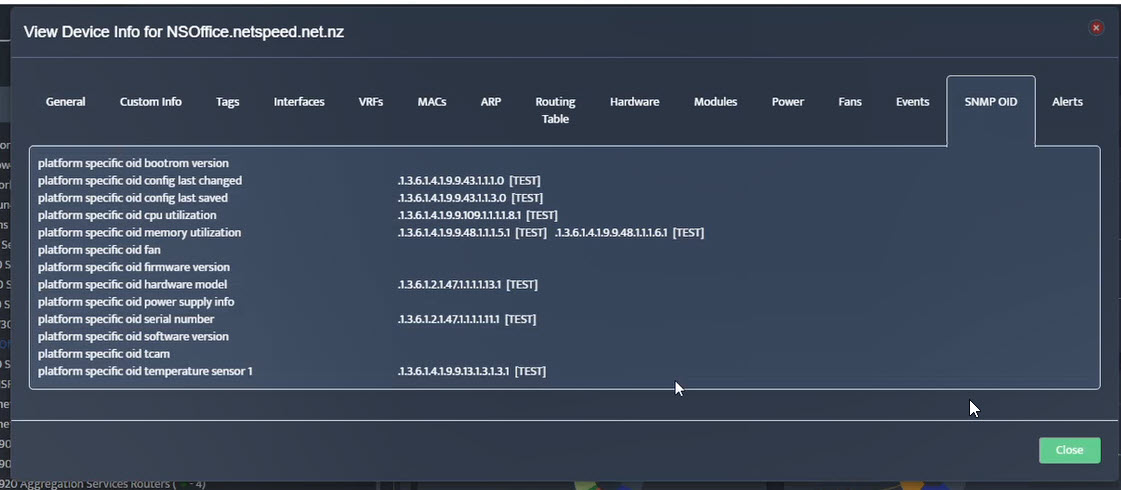
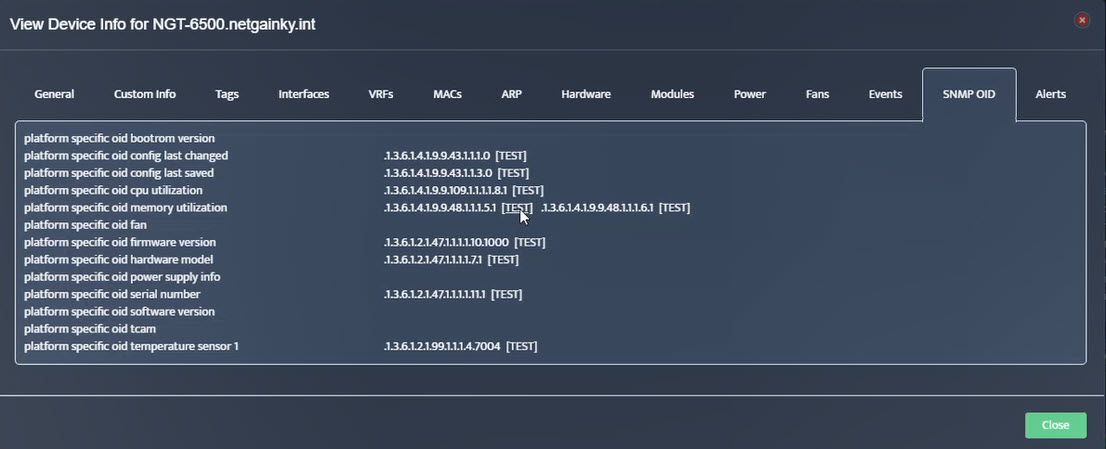 Step 3. Testing: To retrieve current value of OID select SNMP OID tab and click on “TEST” for OID of interest.
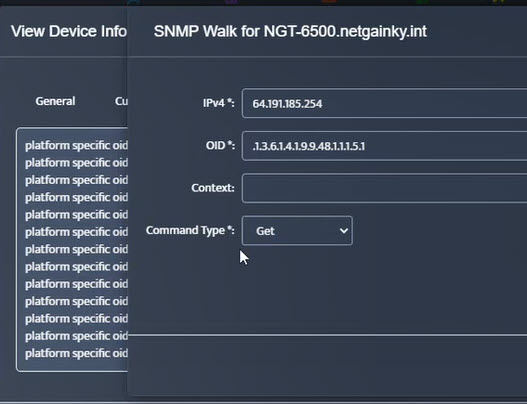
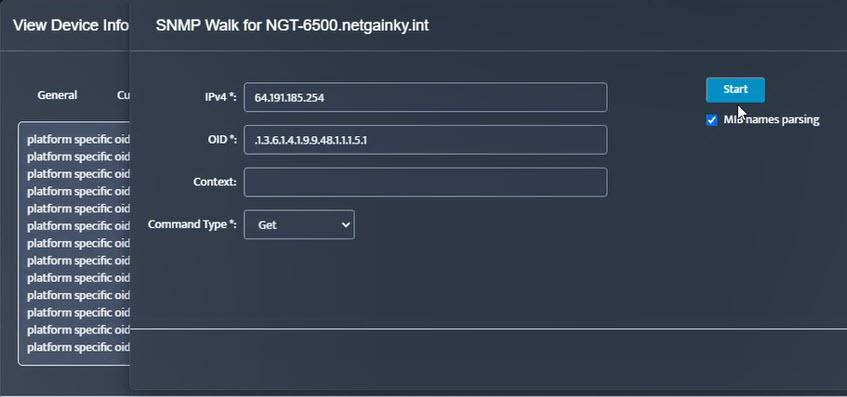 Step 5. Click Start.
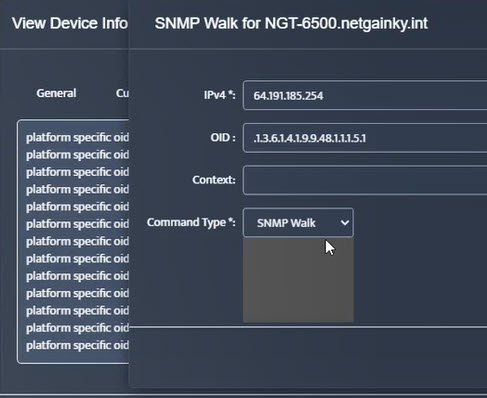
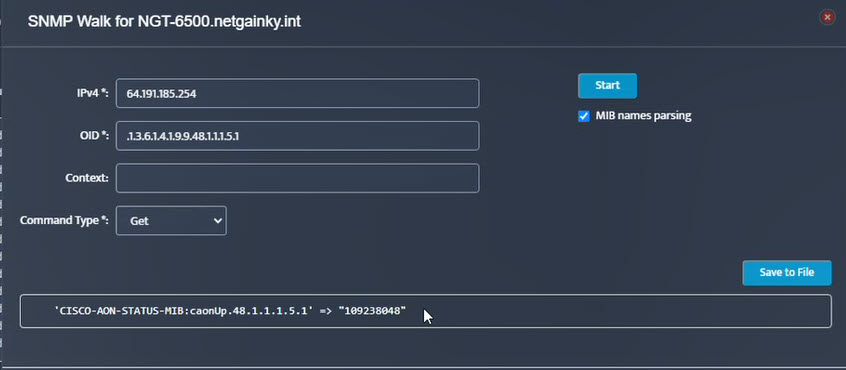 Step 6. Current value of the OID will be displayed.
 .
.