Nectus Integration with Palo Alto Firewall API
Step-by-Step Configuration Guide
Overview
This document provides a guide for Nectus integration with Palo Alto Networks firewalls.
The integration enables automated discovery and monitoring of Palo Alto firewall devices through API connectivity.
Prerequisites
Before beginning the integration process, ensure you have your Palo Alto firewall management IP address and administrative access.
You will also need to generate an API key from the Palo Alto firewall with appropriate permissions.
Configuration Steps
1. Generate API Key from Palo Alto Firewall
To generate an API key, make a POST request to the firewall’s hostname or IP address using the administrative credentials and type=keygen:
curl -H “Content-Type: application/x-www-form-urlencoded” -X POST https://firewall/api/?type=keygen -d ‘user=<user>&password=<password>’
Replace ‘firewall’ with your Palo Alto management IP address or hostname, and provide your administrative username and password.
A successful API call returns status=”success” along with the API key within the key element:
<response status=”success”>
<result>
<key>***********************************************</key> </result>
</response>
Copy the entire API key string including any symbols such as equal signs. This key will be used for authentication in Nectus configuration.
Note that if you generate a new key for the same user, all existing sessions will end and previous API sessions will be deleted.
2. Configure Palo Alto Firewall API Keys in Nectus
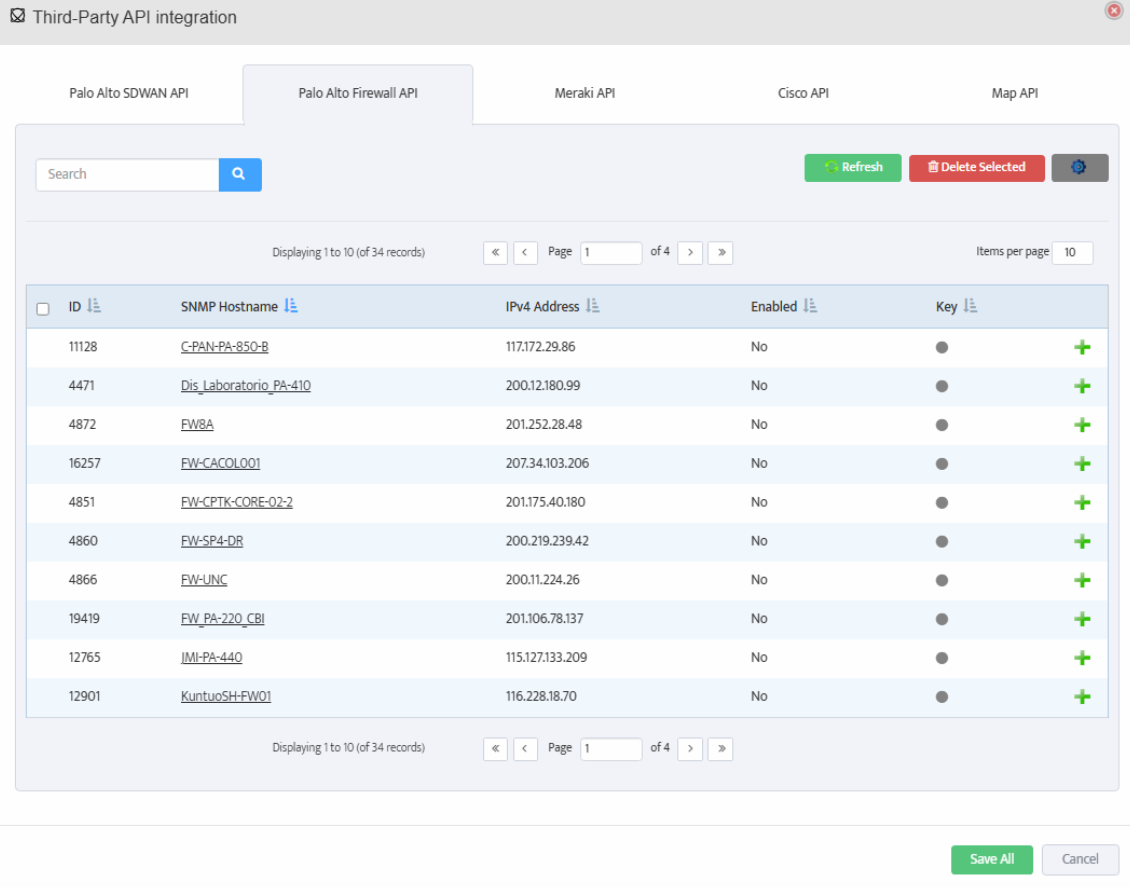
Open the Nectus console and navigate to Settings → Third-Party API Integration.
Click on the Palo Alto Firewall API tab to view the list of discovered Palo Alto firewalls.
The table displays columns for ID, SNMP Hostname, IPv4 Address, Enabled status, and Key.
For each firewall you want to monitor, click the + button to open the Add Palo Alto Firewall API Key dialog.
3. Add API Key and Test Connection
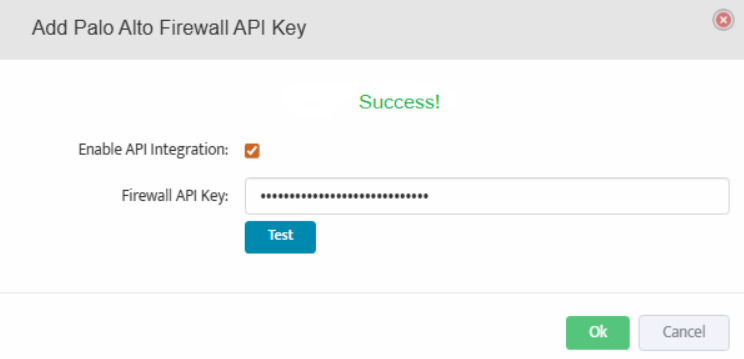
In the Add Palo Alto Firewall API Key dialog, check the box for Enable API Integration.
Paste the API key generated in Step 1 into the Firewall API Key field.
Click the Test button to verify the API connection. A Success message will appear if the connection is successful.
Click OK to save the configuration.
4. Save Configuration
Repeat Step 2 and Step 3 for each firewall you want to monitor.
After configuring API keys for all required firewalls, click Save All at the bottom of the Third-Party API Integration page to save all configurations.
Nectus will now begin monitoring your Palo Alto firewalls and collecting performance metrics, security events, and configuration data through the API.
Nectus release 1.60 includes with a new VMware monitoring module.
Nectus can monitor following VMware infrastructure elements:
- vCenter servers
- ESX Hosts
- Datastores
- Virtual Machines
Nectus can monitor and alert on following metrics for all elements:
- ICMP Availability and Latency
- CPU utilization
- RAM utilization
- Storage free space availabilty
- Disk Read/Write rates
- Disk I/O Transactions rate
- Disk Average and Max Latency
- Network Rx/Tx throughput rates
- VM Status (Power, Heartbeat, Connection)
To set up VMware monitoring go to Inventory/VMware/vCenters (as shown in the picture).
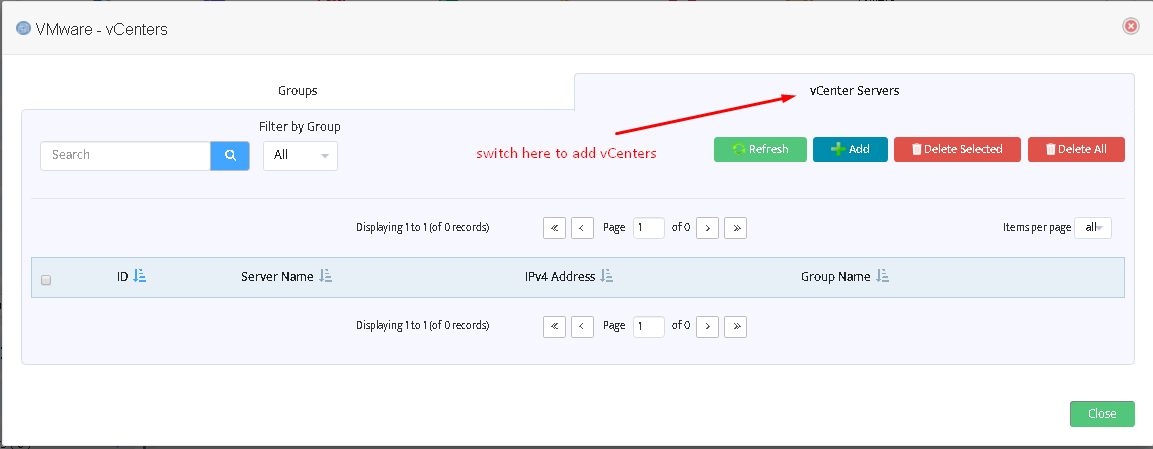
The following page will open. On this page you can create new vCenters groups, edit their settings, delete groups. Create at least one group to be able to add vCenter servers.
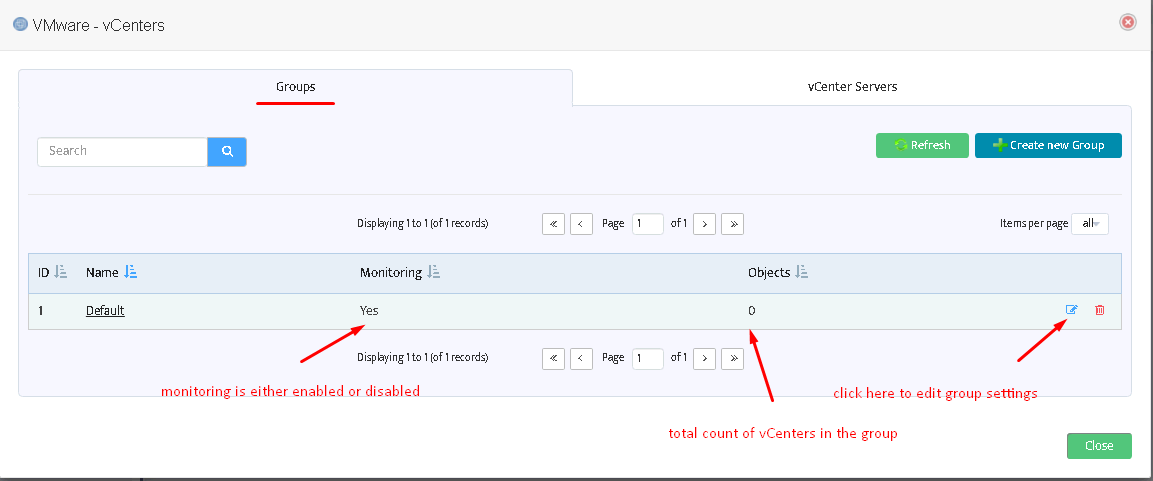
After pressing “Edit” button you will see the form as shown in the picture on the right. Here you can enable/disable monitoring for entire group, select an appropriate ICMP monitoring profile, assign email and SMS lists for alerts. 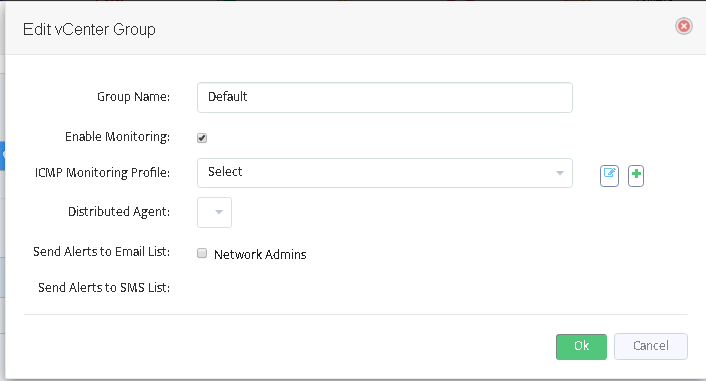
Switch to the next tab of “VMware – vCenters” form to add/remove VMware vCenter servers.
The following window will appear after pressing “Add” button.
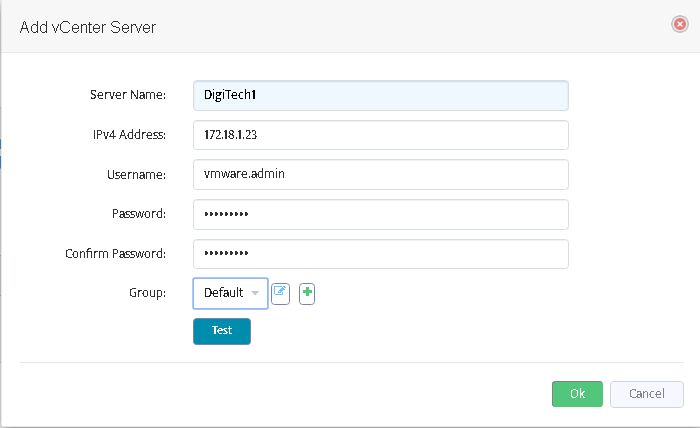
Fill out the fields here. The field “Server name” does not affect functioning and may be assigned to any value you like.
Username/Password must represent a valid VMware vCenter account.
Use “Test” button to check if the connection to vCenter may be established using the credentials provided.
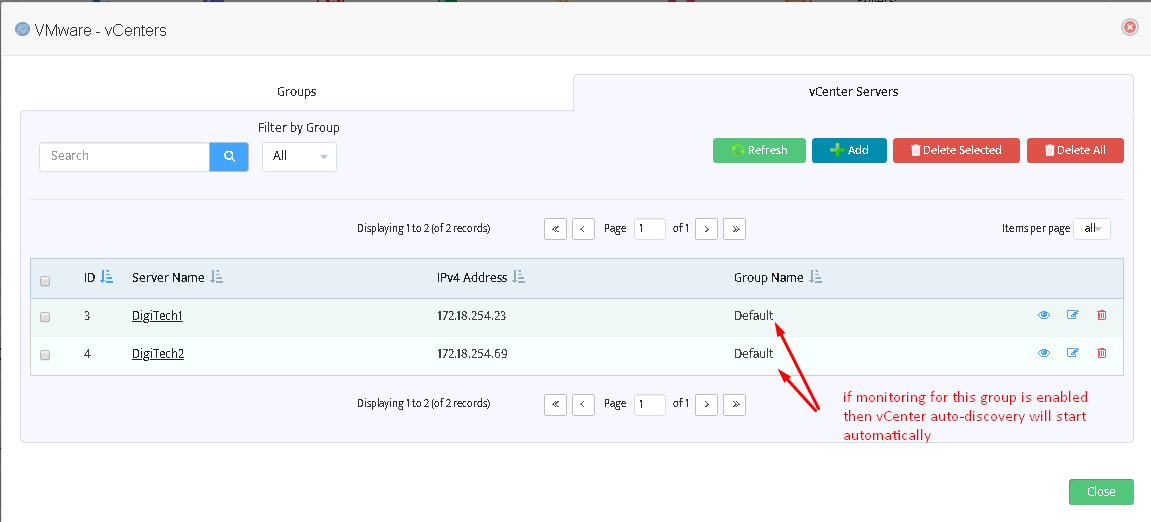
After adding all desired vCenters you will see them on the list:
Managing VMware infrastructure
After configuring VMware groups and adding one or more vCenter servers the discovery of VMware infrastructure will start automatically.
You do not need to add ESX hosts, Datastores and Virtual machines manually.
Wait one or two monitoring cycles (5-10 minutes) for VMware entities to appear.
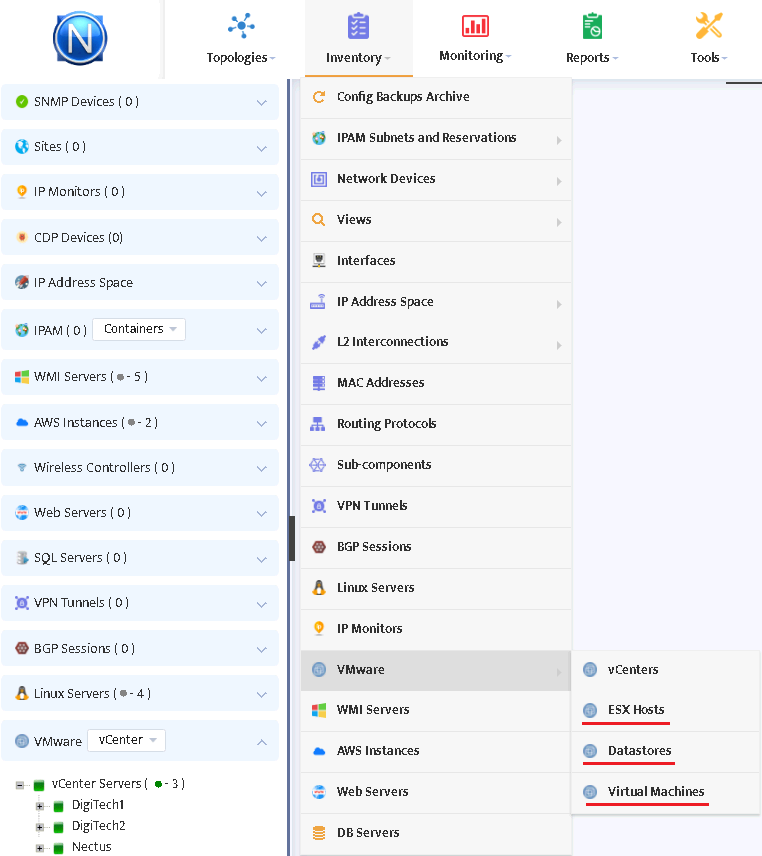
The discovered entities will appear in the Inventory:
After clicking “ESX hosts” you will see the following window displaying ESX host groups:
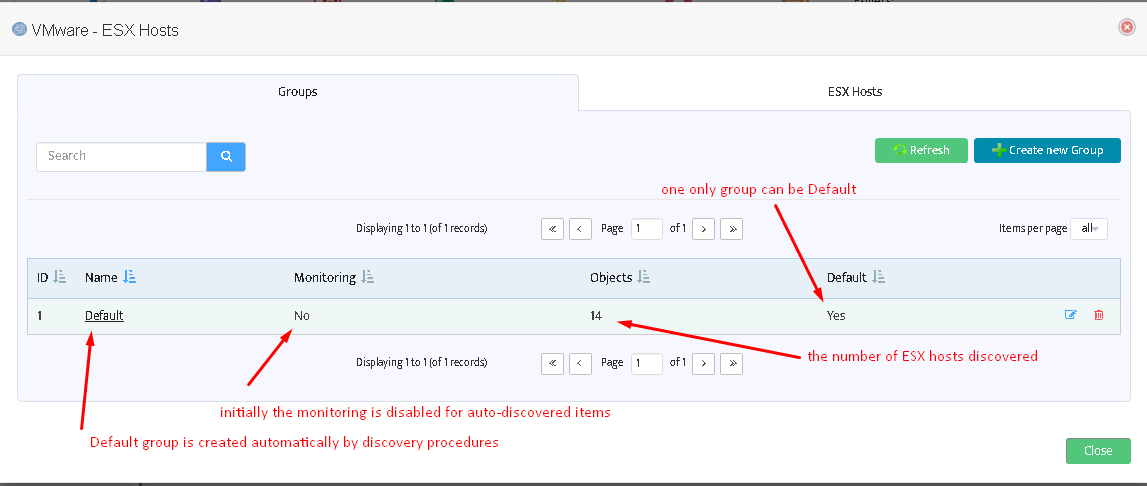
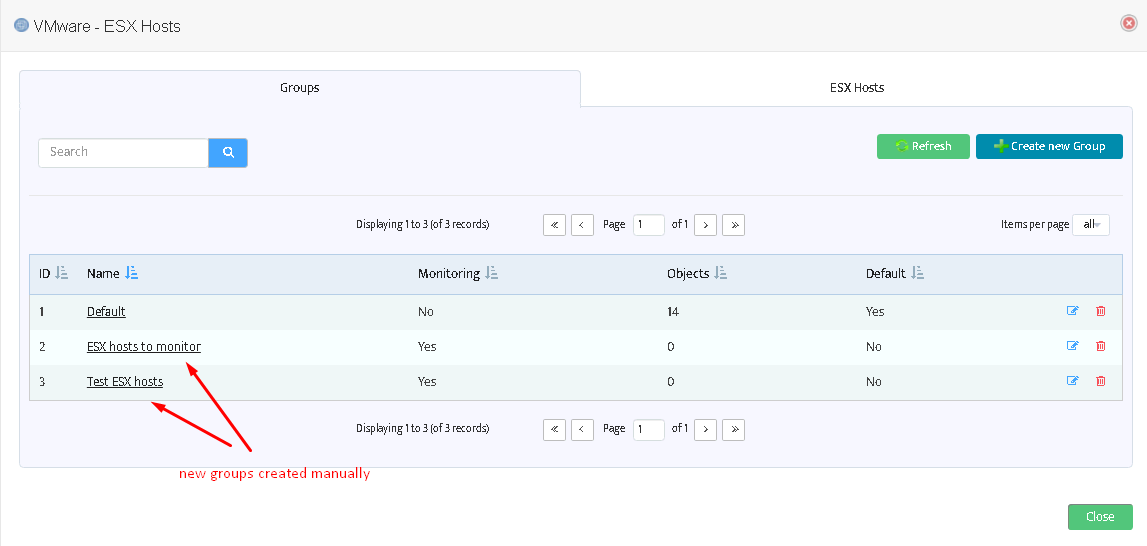
You can add more groups here (see picture below) or enable monitoring for the Default group.
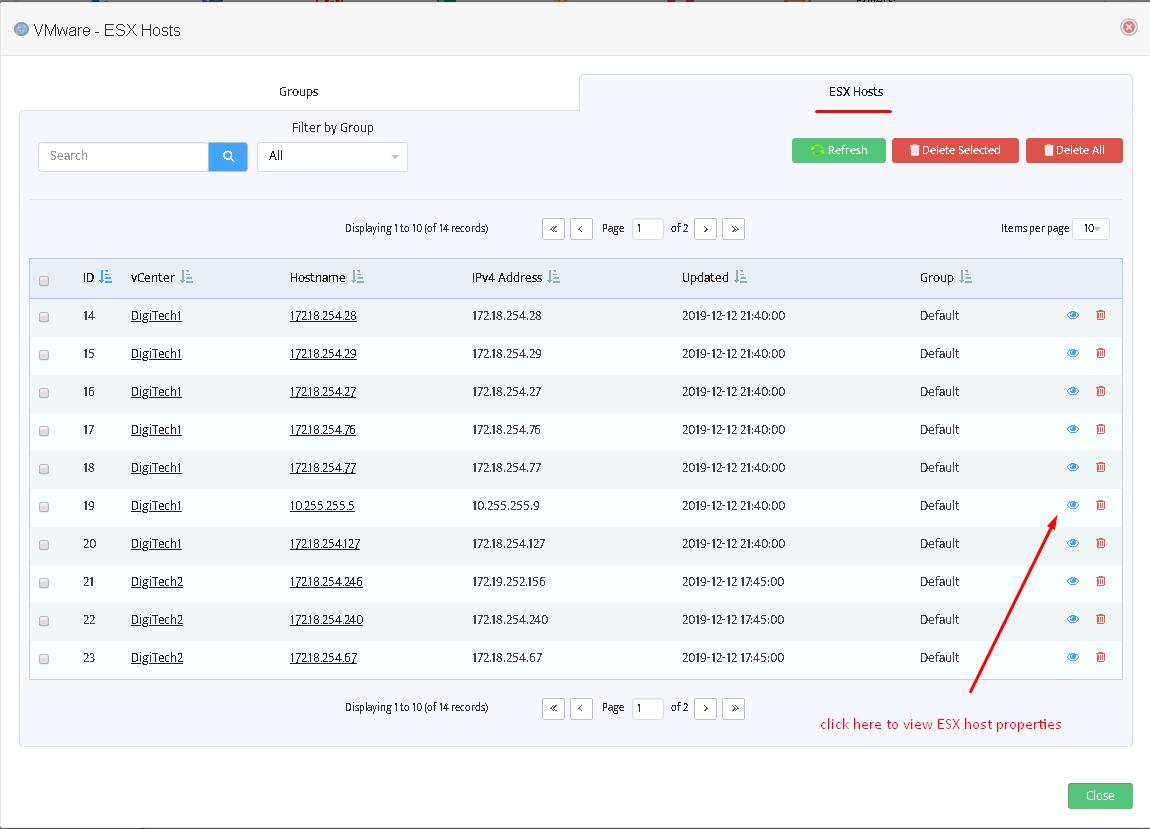
If you move to the tab “ESX hosts” you can see the list of discovered items:
Warning: it is not possible to delete a non-empty group.
This applies to Datastores and Virtual Machines as well.
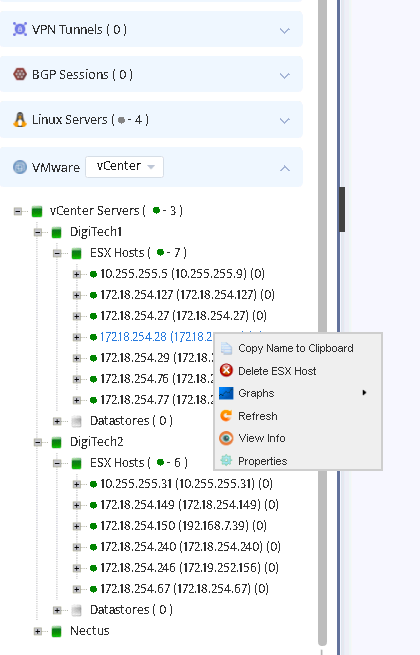
Discovered entities will also appear in the left tree of Nectus GUI.
To move an ESX host to another group switch to Groups in VMware combo, right click on the desired host, choose “Move ESX Host to…” and select the appropriate group.
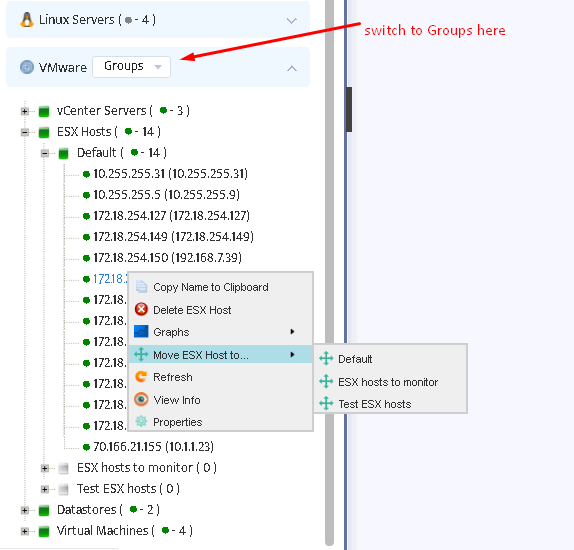
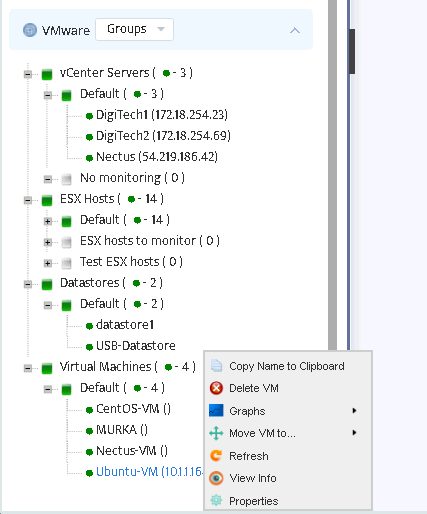
The same applies to other VMware entities: you can view properties, graphs for Datastores and Virtual machines,
move them to other groups either from the tree or from the Inventory/VMware menu.
However, creating new groups is only available at Inventory/VMware menu.
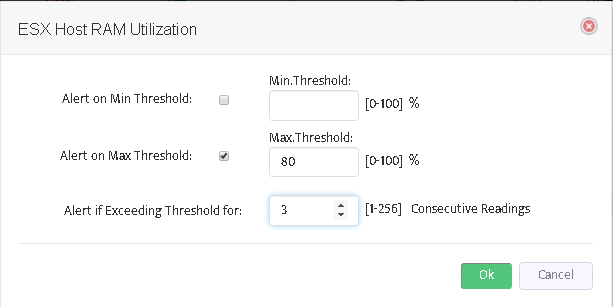
To set up metrics to monitor select Monitoring/VMware Monitoring Settings menu.
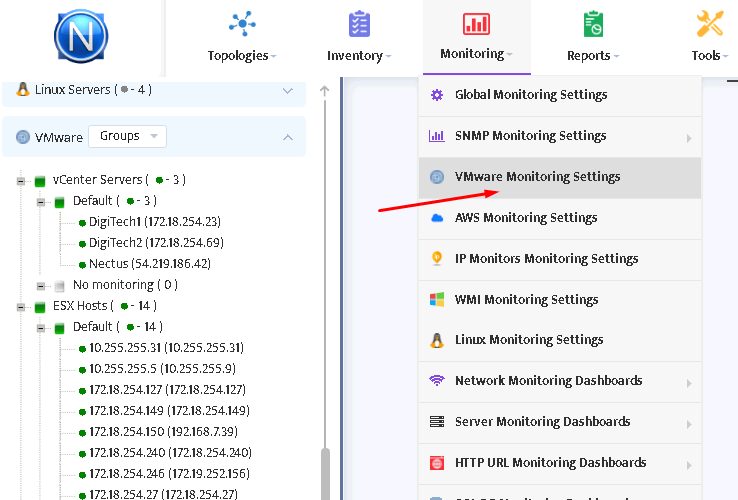
You will see the window as shown in the picture below.
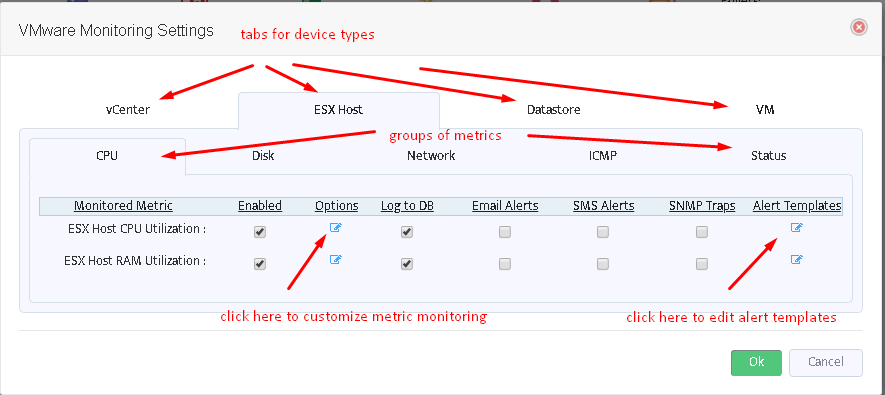
Switch between tabs of VMware devices and metric groups to enable/disable selected metrics, customize them (see picture below) or to edit alert message templates.
After you have configured the desired metrics, Nectus server will automatically load them and start to monitor.