Controlling Nectus Database Size Growth with Data Retention Rules

, ,

Controlling Nectus Database Size with Data Retention Rules


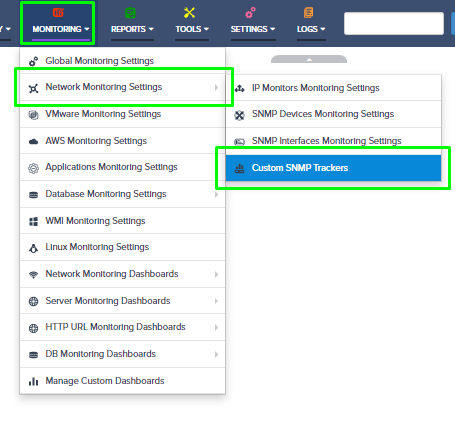
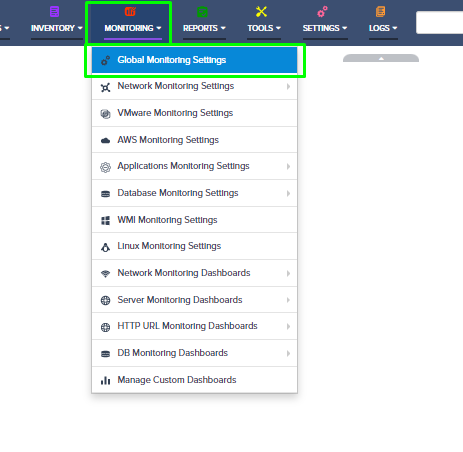
Step 1: Login to Nectus portal and go to Monitoring 🡪 Global Monitoring Settings option.

Graphical user interface, text, application

Description automatically generated

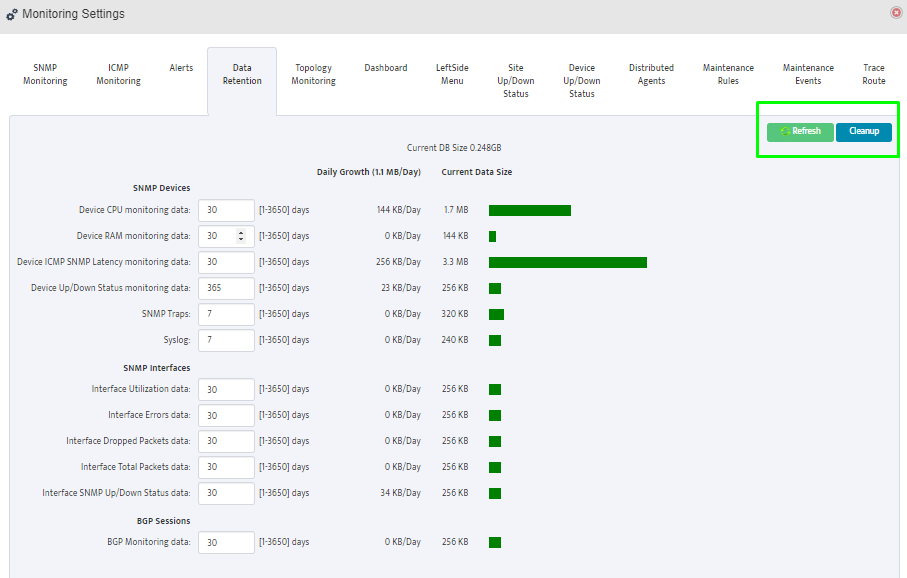
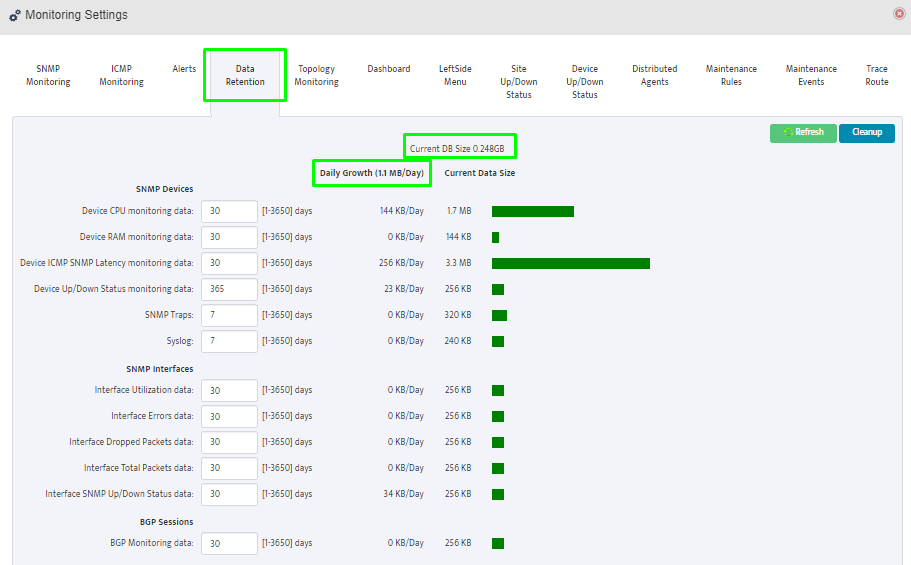
Step 2: Go to the “Data Retention” tab in the Monitoring Settings modal. It shows retention settings in days for each monitoring metric.

Further, it also shows the current database size and the data daily growth rate.

These two options give you a good idea of how to plan your retention period and storage requirements.


Graphical user interface, application, table, Excel

Description automatically generated


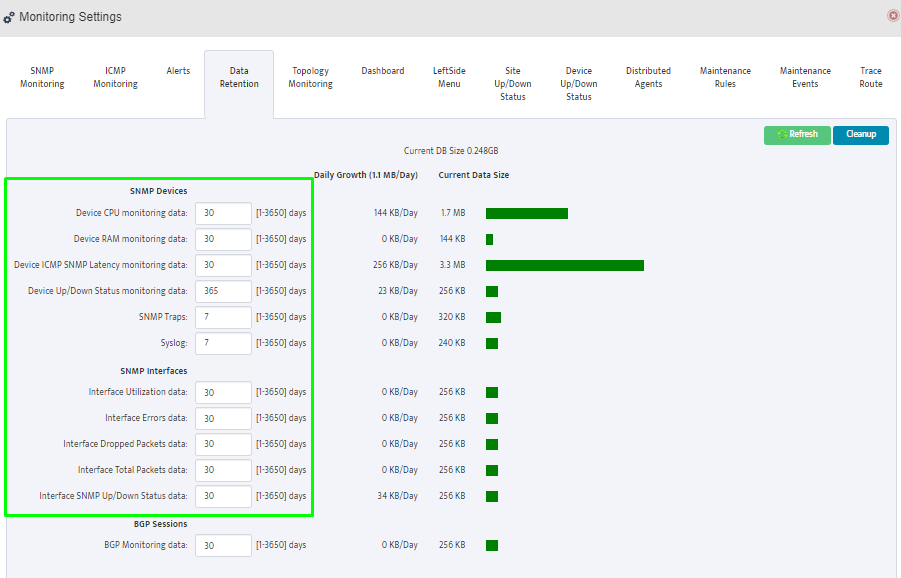
Step 3: Provide the retention period in days with maximum of 3650 days (10 years) and minimum of 1 day.

Graphical user interface, table

Description automatically generated


Step 4: We also have two key options such as Refresh and Cleanup.

Refresh – Will fetch updated size information from the server

Cleanup – Starts removal of monitoring data from the Nectus database according to retention settings.

Note: Normally Cleanup happens automatically every day at 2:00AM.

Graphical user interface, application

Description automatically generated


How to Control Logging in Nectus via .ini Files

,

How to Control Logging in Nectus via .ini Files

If there is a need to reduce amount of disk space Nectus Logs take you can adjust logging verbosity or disable logging completely for each Nectus Service.

Logging settings for each service is controlled by .INI files located in C:\Program Files\Nectus\

Any changes to .INI files do require restart of the corresponding Nectus Service.

To adjust logging settings follow these steps


Step 1: Stop the required Nectus services on the server.


Step 2: Go to “C:\Program Files\Nectus” on the Nectus server.


Step 3: Update the logging configuration in corresponding .ini files located in “C:\Program Files\Nectus” as per the requirement and save them.


Step 4: Start all the Nectus services on the server.

Step 5: To check the current size of log folders, navigate to “C:\Program Files\Nectus\Logs.”

Graphical user interface, application

Description automatically generated


How to Monitor Number of Active TCP Sessions on PaloAlto Firewalls

,

How to Monitor Number of Active TCP Sessions on PaloAlto Firewalls

Quick Start

Step 1: Login to Nectus and go to Monitoring -> Network Monitoring Settings -> Custom SNMP Trackers.

Graphical user interface, text, application, email

Description automatically generated

Step 2: Click on the Create button to create a new SNMP Custom Tracker that will be collecting number of active TCP sessions every 5min.

Palo Alto SNMP OID that returns number of active TCP sessions: 1.3.6.1.4.1.25461.2.1.2.3.4.0

Step 3: Enable the tracker, provide the tracker name, SNMP OID, unit name and data type.

Alerting option can be enable with predefined threshold value.

Graphical user interface, application

Description automatically generated

Step 4: If not created in advance, create the SNMP Device View by clicking the + (plus) button.

Provide the view name and select the Palo Alto Firewalls from available device list for monitoring.


Graphical user interface, text, application, email

Description automatically generated

Click “Ok” to finish tracker creation.

Step 5: For reporting, Go to the Reports -> “Top” reports -> Top Custom SNMP Trackers

Graphical user interface, text, application

Description automatically generated

Step 6: Select the appropriate report and tracker name to get the max. and min. values.

Click on the Graph button to get the tracker trend in visual form.


Graphical user interface, text, application

Description automatically generated

Chart, line chart

Description automatically generated

Done.


How to Monitor Number of Active UDP Sessions on PaloAlto Firewalls

,

How to Monitor Number of Active UDP Sessions on PaloAlto Firewalls

Quick Start

Step 1: Login to Nectus and go to Monitoring -> Network Monitoring Settings -> Custom SNMP Trackers.

Graphical user interface, text, application, email Description automatically generated

Step 2: Click on the Create button to create a new SNMP Custom Tracker that will be collecting number of active UDP sessions every 5min.

Palo Alto SNMP OID that returns number of active UDP sessions: 1.3.6.1.4.1.25461.2.1.2.3.5.0

Step 3: Enable the tracker, provide the tracker name, SNMP OID, unit name and data type.

Alerting option can be enable with predefined threshold value.

Graphical user interface, application Description automatically generated

Step 4: If not created in advance, create the SNMP Device View by clicking the + (plus) button.

Provide the view name and select the Palo Alto Firewalls from available device list for monitoring.

Graphical user interface, text, application, email Description automatically generated

Click “Ok” to finish tracker creation.

Step 5: For reporting, Go to the Reports -> “Top” reports -> Top Custom SNMP Trackers

Graphical user interface, text, application Description automatically generated

Step 6: Select the appropriate report and tracker name to get the max. and min. values.

Click on the Graph button to get the tracker trend in visual form.


Graphical user interface, chart, line chart Description automatically generated

Done.


How to Monitor Number of Active ICMP Sessions on PaloAlto Firewalls

,

How to Monitor Number of Active ICMP Sessions on PaloAlto Firewalls

Quick Start

Step 1: Login to Nectus and go to Monitoring -> Network Monitoring Settings -> Custom SNMP Trackers.

Graphical user interface, text, application, email

Description automatically generated

Step 2: Click on the Create button to create a new SNMP Custom Tracker that will be collecting number of active ICMP sessions every 5min.

Palo Alto SNMP OID that returns number of active ICMP sessions: 1.3.6.1.4.1.25461.2.1.2.3.6.0

Step 3: Enable the tracker, provide the tracker name, SNMP OID, unit name and data type.

Alerting option can be enable with predefined threshold value.

Graphical user interface, application

Description automatically generated

Step 4: If not created in advance, create the SNMP Device View by clicking the + (plus) button. Provide the view name and select the Palo Alto Firewalls from available device list for monitoring.

Graphical user interface, text, application, email

Description automatically generated

Click “Ok” to finish tracker creation.

Step 5: For reporting, Go to the Reports -> “Top” reports -> Top Custom SNMP Trackers

Graphical user interface, text, application

Description automatically generated

Step 6: Select the appropriate report and tracker name to get the max. and min. values. Click on the Graph button to get the tracker trend in visual form.

A screenshot of a computer

Description automatically generated

Graphical user interface, chart

Description automatically generated with medium confidence

Done.


How to Monitor Number of Palo Alto VPN (Global Protect) Users

,

How to Monitor Number of Palo Alto VPN (Global Protect) Users


Step 1: Login to Nectus and go to Monitoring -> Network Monitoring Settings -> Custom SNMP Trackers.

Graphical user interface, text, application, email

Description automatically generated

Step 2: Click on the Create button to create a new SNMP Custom Tracker that will be collecting number of connected VPN users every 5min.

Palo Alto SNMP OID that returns number of connected users: 1.3.6.1.4.1.25461.2.1.2.5.1.3.0

Step 3: Enable the tracker, provide the tracker name, SNMP OID, unit name and data type.

Alerting option can be enabled with predefined threshold values.

Graphical user interface, application

Description automatically generated


Step 4: If not created in advance, create the SNMP Device View by clicking the + (plus) button.

Provide the view name and select the Palo Alto Firewalls from available device list for monitoring.


Graphical user interface, text, application, email

Description automatically generated

Click “Ok” to finish tracker creation.


Step 5: For reporting, Go to the Reports -> “Top” reports -> Top Custom SNMP Trackers

Graphical user interface, text, application

Description automatically generated

Step 6: Select the appropriate report and tracker name to get the max. and min. values.

Click on the Graph button to get the tracker trend in visual form.

Graphical user interface, text, application, email

Description automatically generated


Graphical user interface, chart

Description automatically generated

Done.


Nectus DB Migration by manually copying DB files to a new server.

,

Nectus DB Migration by manually copying DB to a new server.

Step 1: Prepare new server by performing clean Nectus installation with the same Nectus version as on old server

Step 2: Stop all Nectus services on the new server

Graphical user interface, application

Description automatically generated

Step 3: Delete all the content from “C:\Program Files\Nectus\Database” folder on new server.

Step 4: Copy complete “C:\Program Files\Nectus\Database” folder from the old Nectus server to the “C:\Program Files\Nectus\Database” folder on the new server

Step 5: Copy file “C:\Program Files\Nectus\Web\Apache24\htdocs\protected\config\database.ini” from old server to the same location on new server.

(Overwrite existing file).


Step 6: In all *.ini files located in “C:\Program Files\Nectus” folder on new server update

DatabasePassword=wL1Kdnl6h$ line with a new password for username “vconsole” which can be found in

C:\Program Files\Nectus\Web\Apache24\htdocs\protected\config\database.ini” file.


Graphical user interface

Description automatically generated


Graphical user interface, text, application

Description automatically generated


Step 7: Open the Registry Editor and in “HKEY_LOCAL_MACHINE -> SOFTWARE -> Virtual Console LLC -> Nectus

update passwords for the three database accounts. (New passwords can be found in database.ini file)


Graphical user interface, text

Description automatically generated

Step 8: Start all Nectus Services

Migration Complete.