How to use Nectus API Interface

,

How to use Nectus API Interface

Quick Start Guide

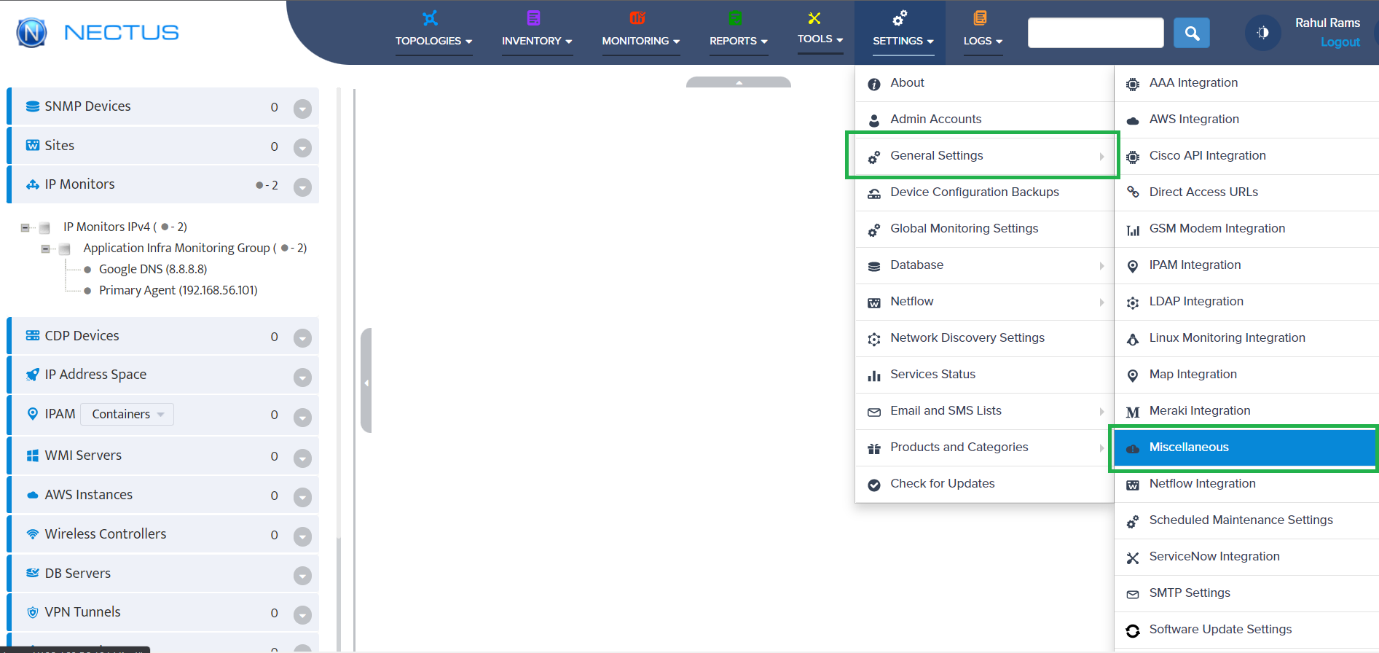
Step 1: Log in to Nectus Portal. On the home page, select General Settings -> Miscellaneous.


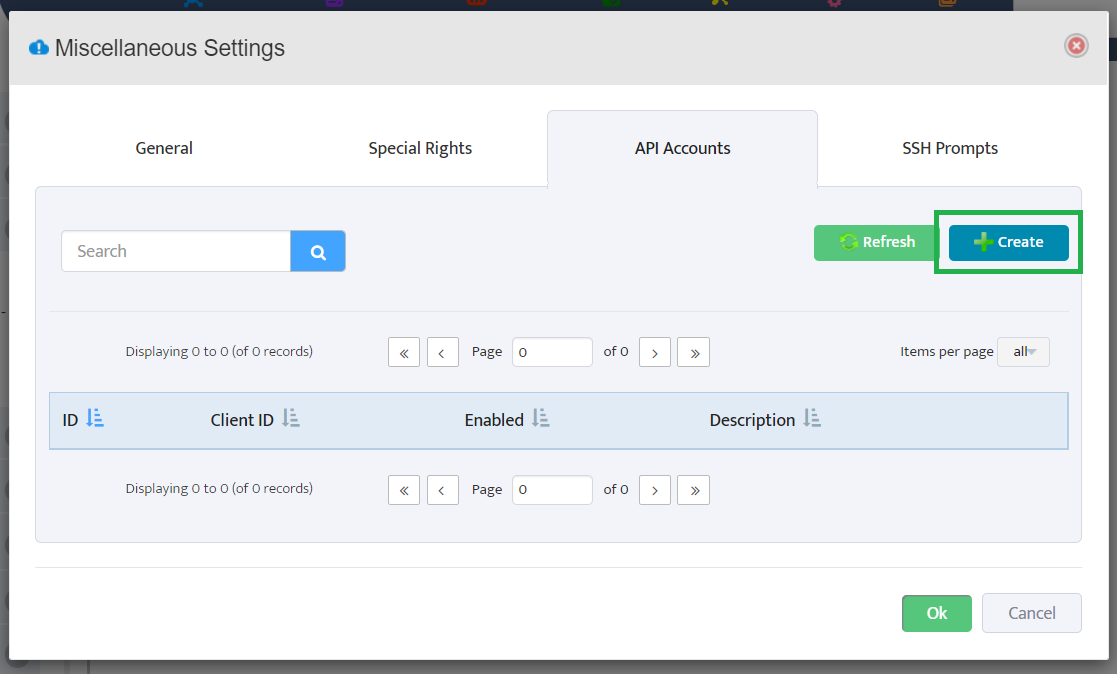
Step 2: Next, we have to generate a new client ID and client secret for creating the token. Go to API Accounts and click on Create.


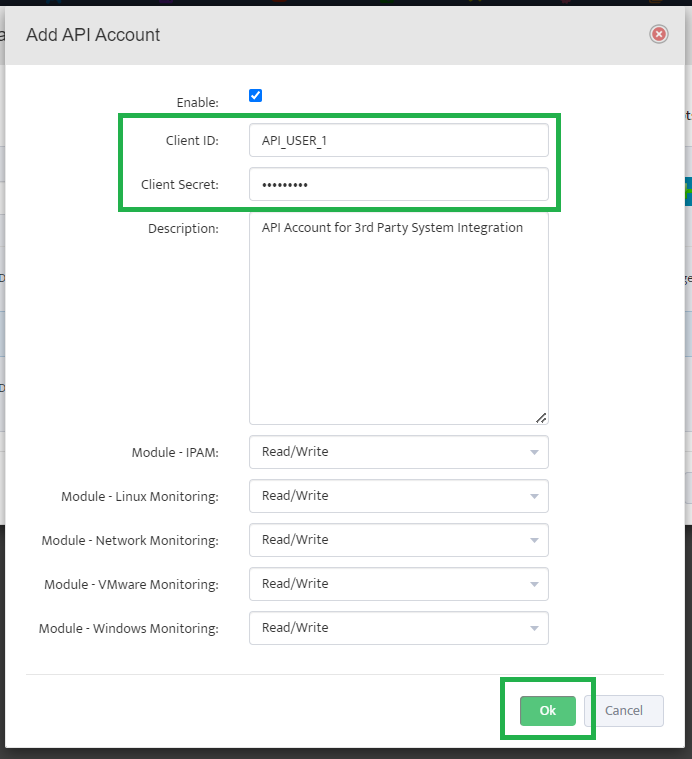
Step 3: Check the Enable box, enter the Client ID & Secret in the text box, and select the necessary access level (Read-Write or Read-Only) for the modules.

Here, we have given the Client ID as API_USER_1 and Client Secret as Nectus123. Click on the Ok button to create it.


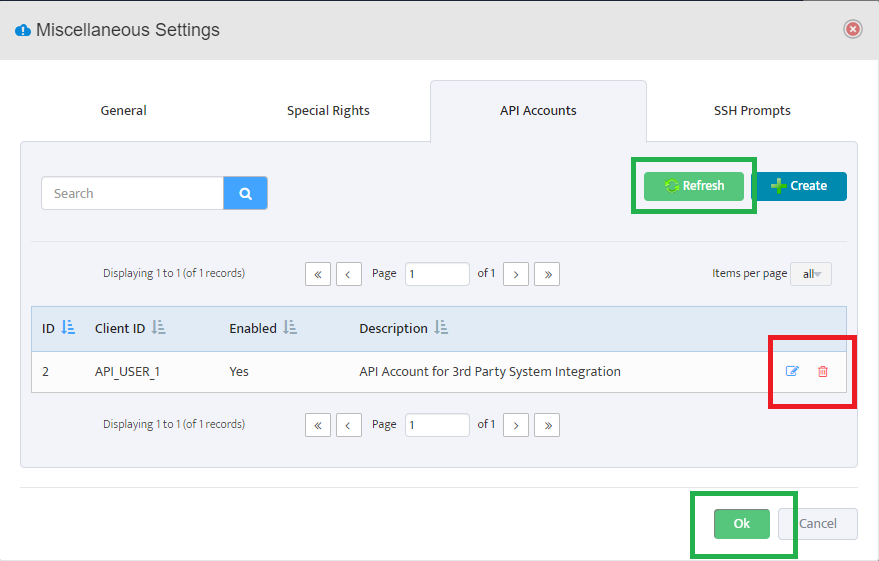
Step 4: Each API Account with the Client’s information obtains a unique ID and gets listed.

We also have the Edit button to modify and the Delete button to remove the existing accounts with ID. Click on the Ok button to close the miscellaneous modal.


Step 5: Now, we have to create the API token with the help of the generated Client ID & Client Secret.

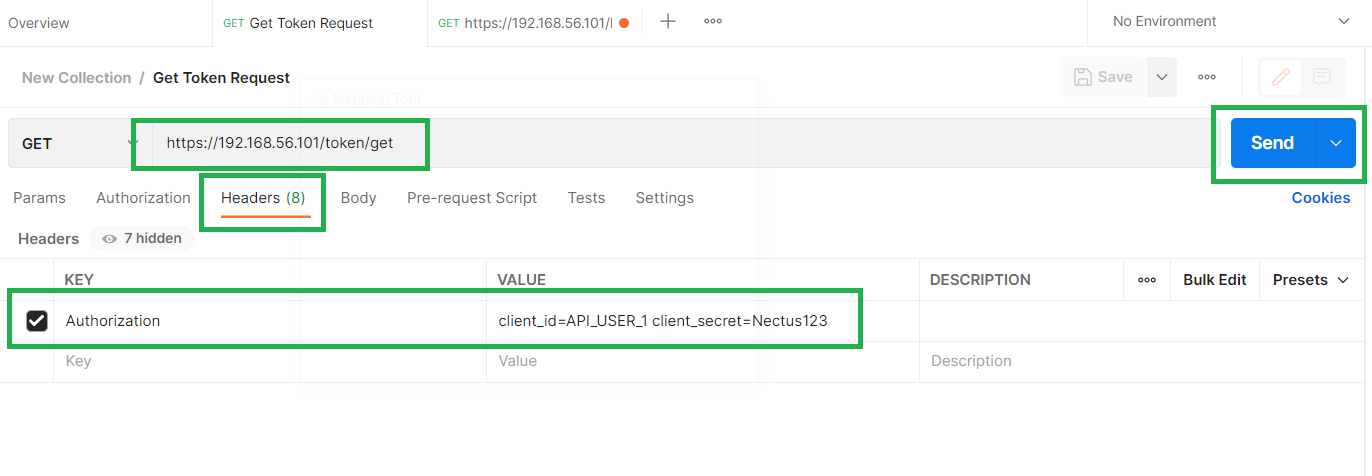
Here, we are using the POSTMAN Application for the sake of the demo. Use the below query and headers to get the access token.

API URL: https://<servername>/token/get

Request Type: GET

Headers: Authorization – client_id=API_USER_1 client_secret=Nectus123


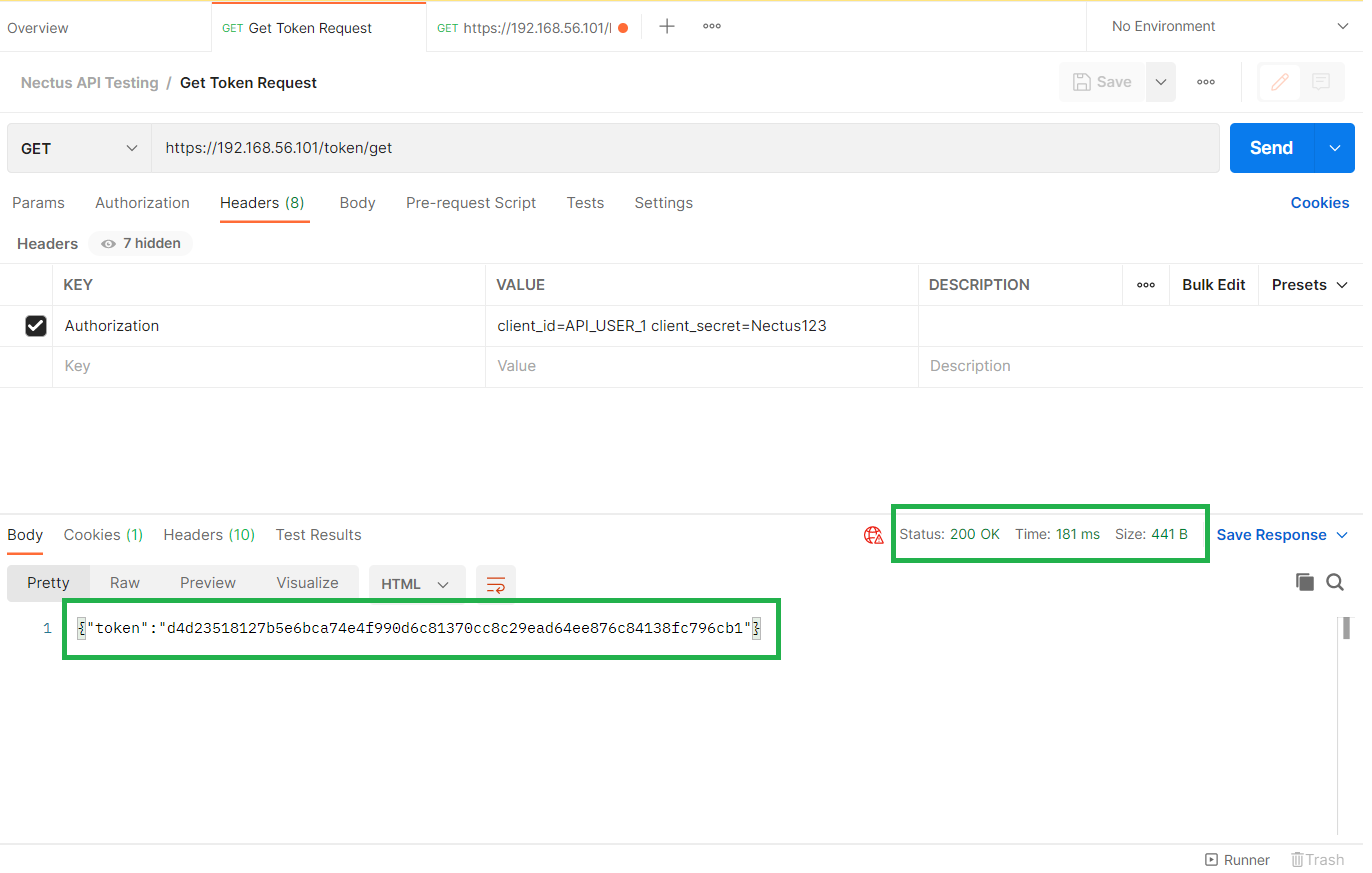
Step 6: Click the Send button to obtain the Status Code with 200 Ok with the token details in the response body.


Step 7: Now, we can use the generated access token for all Nectus API’s.

Let’s try with some API Request.

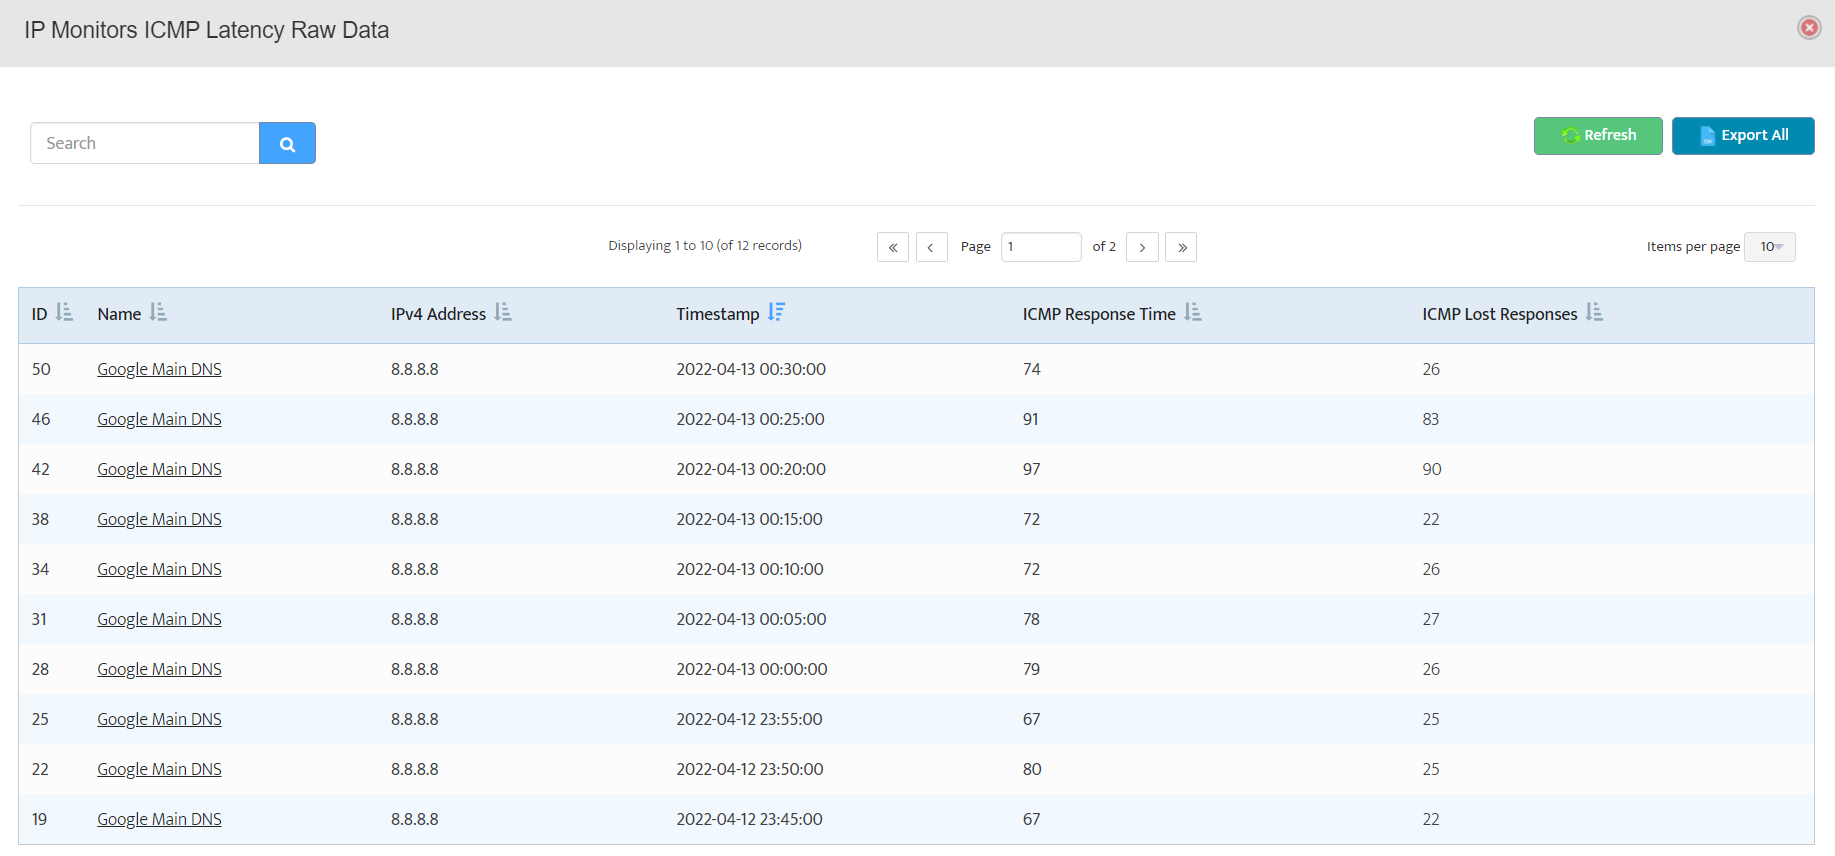
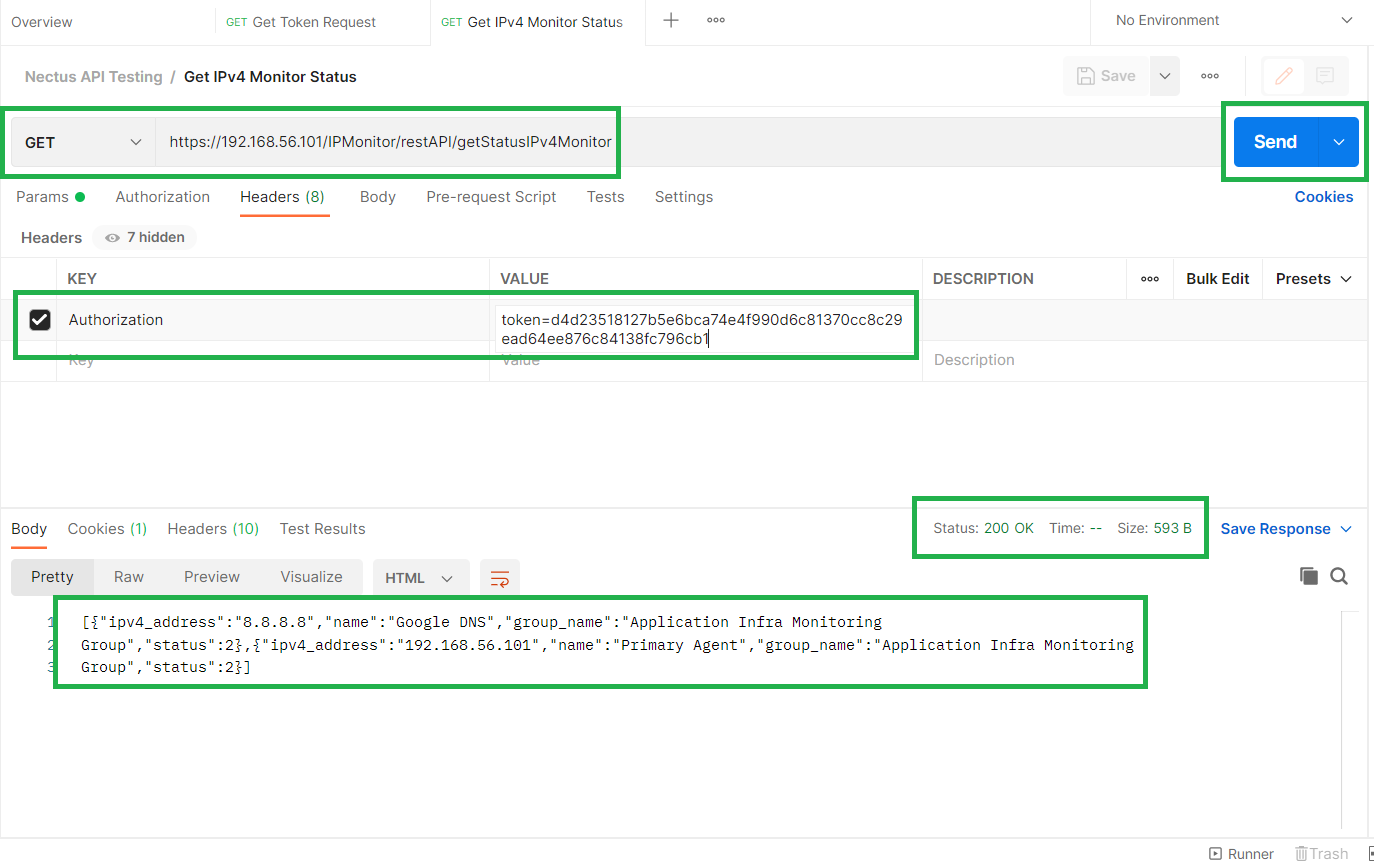
API URL: https://<servername>/IPMonitor/restAPI/getStatusIPv4Monitor

Request Type: GET

Headers: Authorization – token=<generated-access-token>

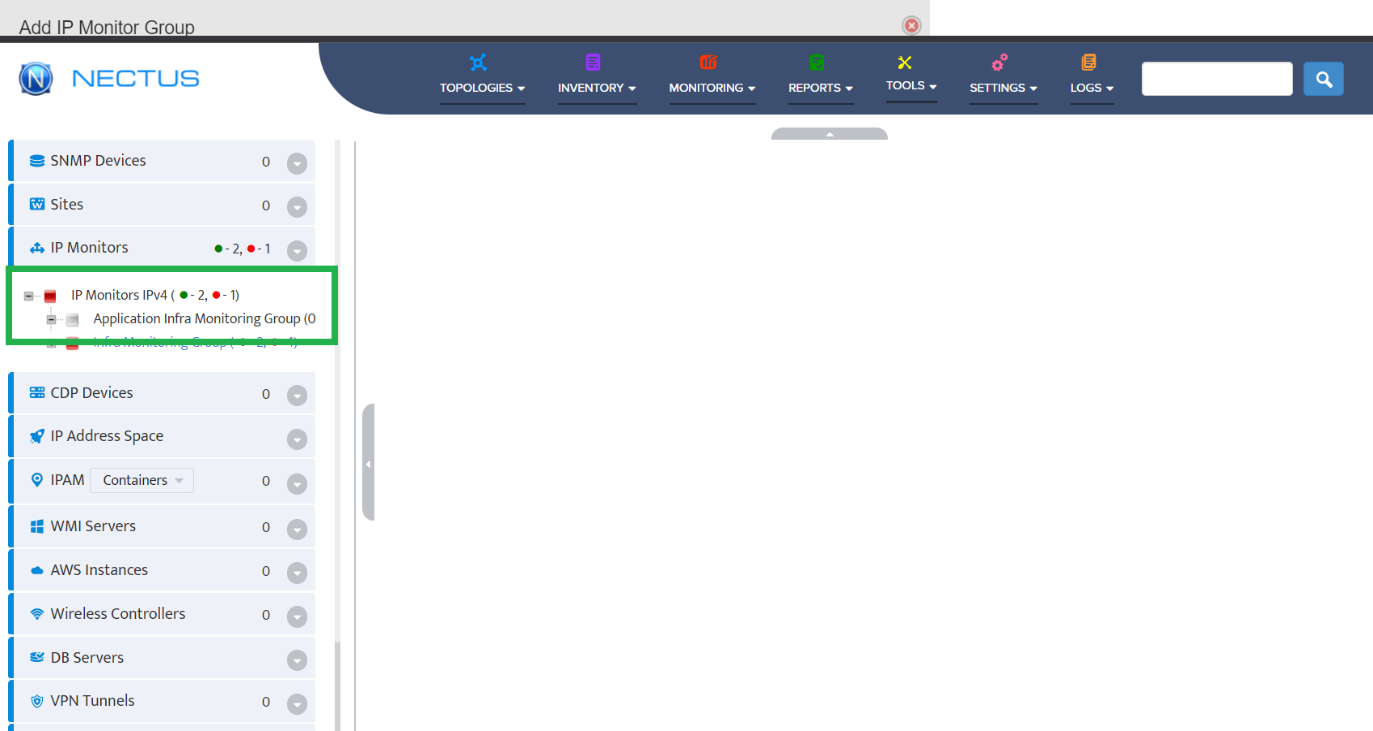
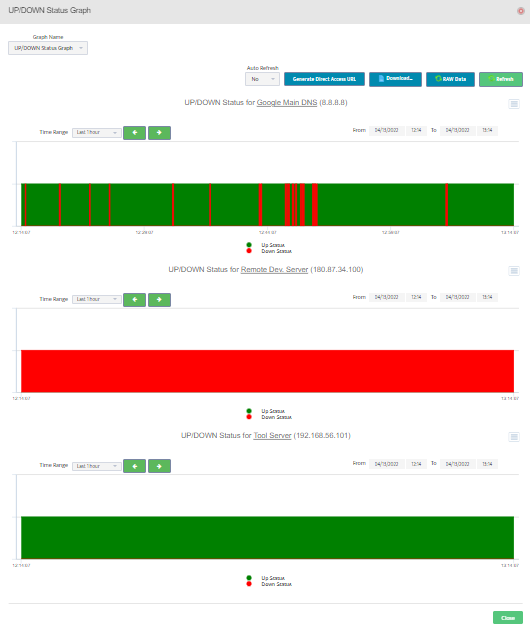
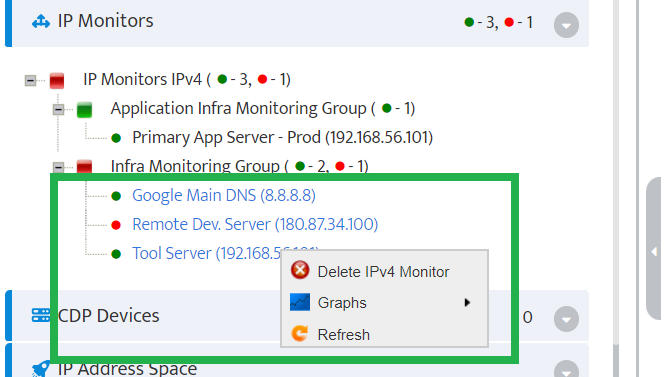
After clicking the Send button, we obtain the list of IPv4Monitor groups with the associated IP address and status.

Congrats! We have successfully used the Nectus API interface to access the monitoring data points which will ease the third-party integration with other systems.


How to Add and Configure IP Monitors

,

Step 1: Login to Nectus portal. Then, click on IP Monitors.

Step 2: Right Click on IP Monitors and select Add Group to create a new monitoring group.

Step 3: Provide a unique name to the group and check the “Enable monitoring” option.

If monitoring requires custom ICMP monitoring timers then select optional Custom ICMP Monitoring Profile.

Choose the appropriate Polling Agent (Default is Main Polling Agent) and provide optional physical address.

Click on Ok to create a new IP monitor group.

Step 4: Now, the new group gets added under IP Monitors. The square icon indicates the status and since no device is added in the group, it’s shown in grey color.

Step 5: Right click on the IP Monitor Group to add a new IP Monitor into the group.

Step 6: Under the General Info Tab, provide a valid IP, name and optional physical address.

Then, click on Ok button to Add IP Monitor.

Graphical user interface, text, application Description automatically generated

Graphical user interface, application Description automatically generated with medium confidence

Step 7: To test the reachabilty of IP Monitor, we can use Ping this IPv4 Monitor option. It performs a live ICMP ping test to the IP Monitor.

Graphical user interface, text, application, chat or text message Description automatically generated

Step 8: It also provides the options to repeat the test and continue ping tests.

Graphical user interface, text, application Description automatically generated

Step 9: To get the current device monitoring information, go to View IPv4 Monitor Info.

Step 10: The General Info provides the basic details about the device.

Alerts tab contains all the monitoring alerts. All alerts can be exported in *.csv format for further drill down. Click on eye icon in each row to get more information about the alert.

Graphical user interface, text, application, email Description automatically generated

Step 11: Right click on the device and Graphs to get a plot based on UP/DOWN state, latencies etc.

Graphical user interface, text, application, chat or text message Description automatically generated

Step 12: We can share the polled data from Nectus in several ways.

Step 13: We can share the access to graph using Generate Direct Access URL.

Graphical user interface, text, application, email Description automatically generated

Step 14: Further, we can also export all data points in a *.csv form using Export All option.

Graphical user interface, table Description automatically generated

Step 15: We can select multiple devices using CTRL + Left Click. Right click on any one to get the available options.

Step 16: Select the Graphs option to obtain the consolidated view of the plots for the selected devices.

Graphical user interface, application Description automatically generated

Step 17: To edit the added devices, right click on the device and choose properties.

Graphical user interface, text, application, chat or text message Description automatically generated

Graphical user interface, text, application Description automatically generated

Step 18: Bulk import through a *.csv file can be performed and sample file can be downloaded from Import from CSV modal for quick reference.

Graphical user interface, text, application, email Description automatically generated

Step 19: Post the data import completion, skim through the device information, and select them to save into the database for the monitoring.

Graphical user interface, text, application, email Description automatically generated

Step 20: Additionally, we can select Delete IPv4 Monitor to delete the devices from monitoring.

Graphical user interface, text, application, chat or text message Description automatically generated

Graphical user interface, text, application, email Description automatically generated

Congrats! We have successfully explored the lifecycle management of devices for ICMP monitoring using IP Monitor.


How to Perform Nectus Software Upgrade

,


Step 1. Download latest Nectus release from Nectus Support Portal (https://support.nectus5.com)

Table

Description automatically generated


Step 2.    Unzip Nectus distribution archive Nectus xxxxx.zip to any folder on Nectus Server.


For upgrade you should have two files:

Graphical user interface, text, application

Description automatically generated


Step 3. Right-click on “Nectus Setup” and select “Run as administrator”.


Step 4. The Nectus Installer window opens. Click Next.


Graphical user interface, text, application, Word

Description automatically generated


Step 5. The License Agreement window opens. Click “I Agree”.


Step 6. The Upgrade window opens. Select the “Upgrade” mode.


Note: “Upgrade” mode (the default mode) preserves the database and all data in it.
!!! “Remove” mode will delete the existing database and all data will be erased!!!!

Click “Install”.


Step 7. The installation begins by saving resources.


Step 8. The old software components are uninstalled.

If desired, click on “Show details”.


Step 9. Show details lists the steps the installer is performing.


Step 10. When the old software components have been removed, the new version will be installed.


Step 11. The installation completes. Click Next.


Step 12. The “Completing Setup” window opens.