How to Add and Configure IP Monitors
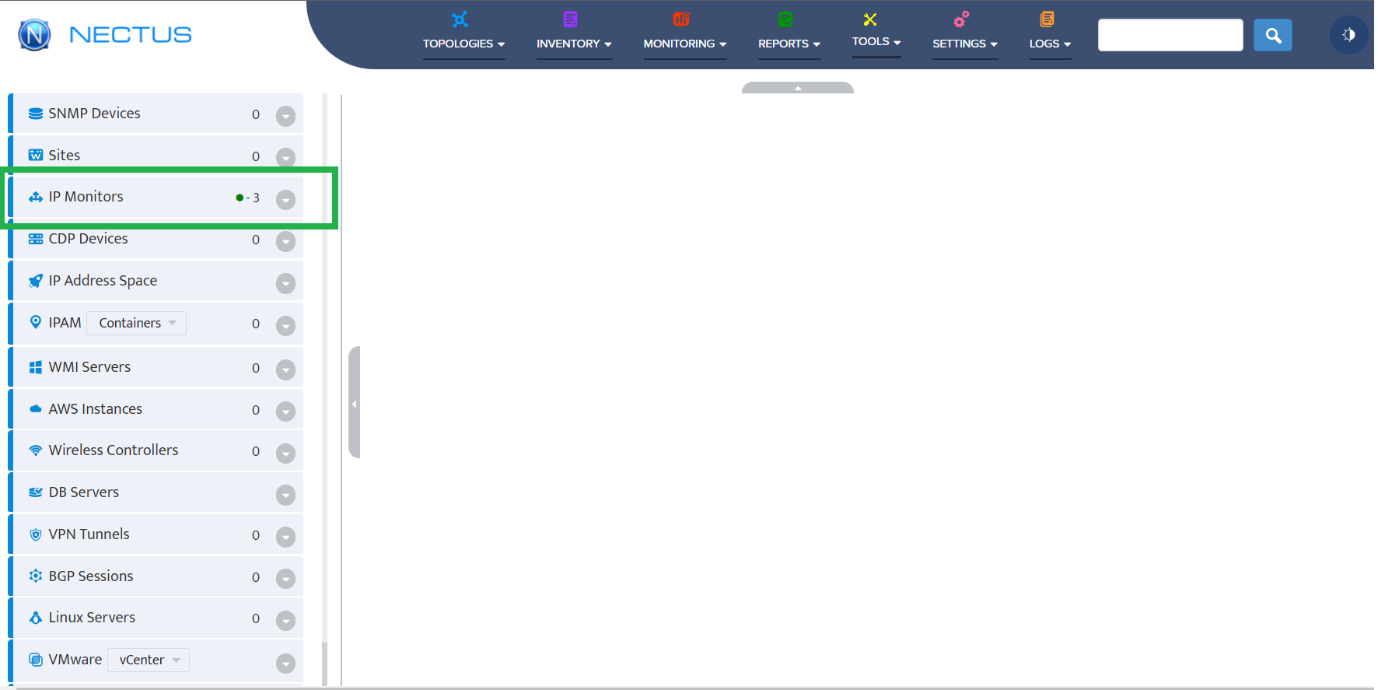
Step 1: Login to Nectus portal. Then, click on IP Monitors.
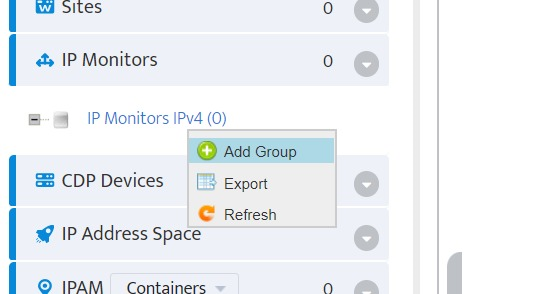
Step 2: Right Click on IP Monitors and select Add Group to create a new monitoring group.
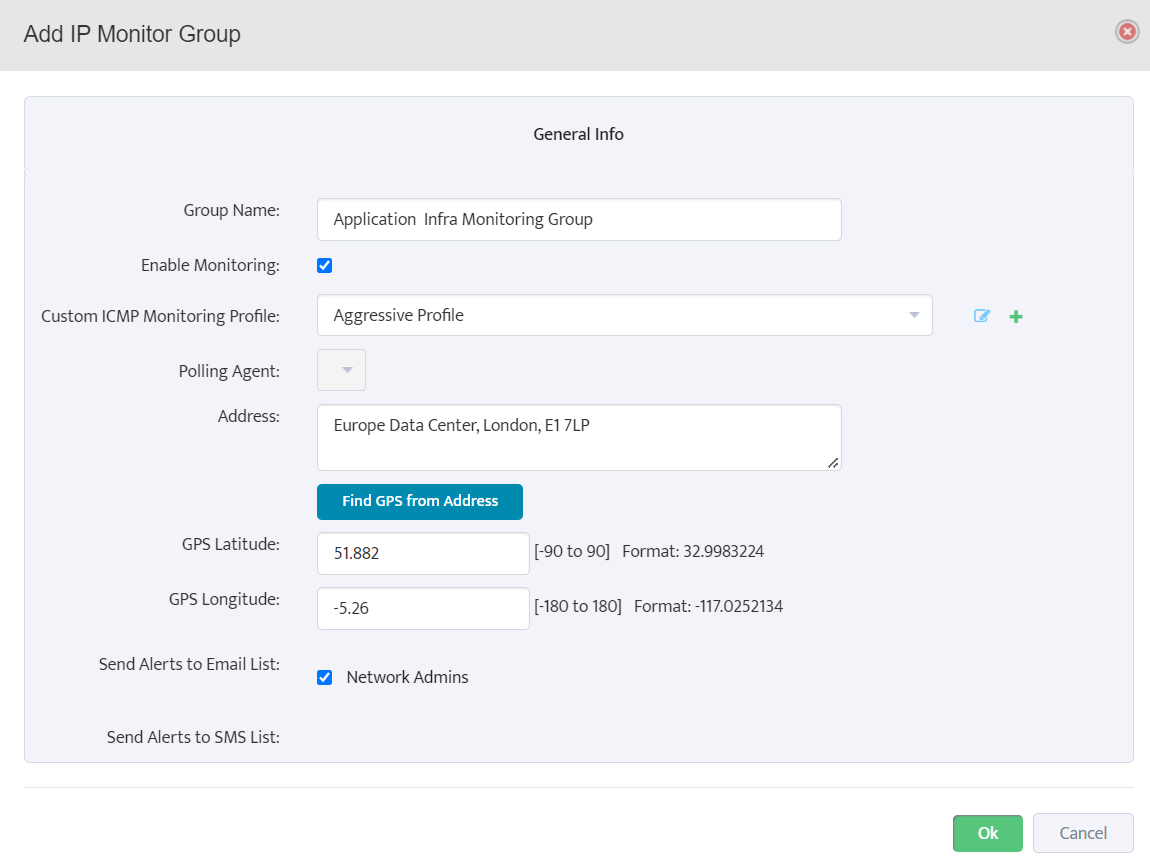
Step 3: Provide a unique name to the group and check the “Enable monitoring” option.
If monitoring requires custom ICMP monitoring timers then select optional Custom ICMP Monitoring Profile.
Choose the appropriate Polling Agent (Default is Main Polling Agent) and provide optional physical address.
Click on Ok to create a new IP monitor group.
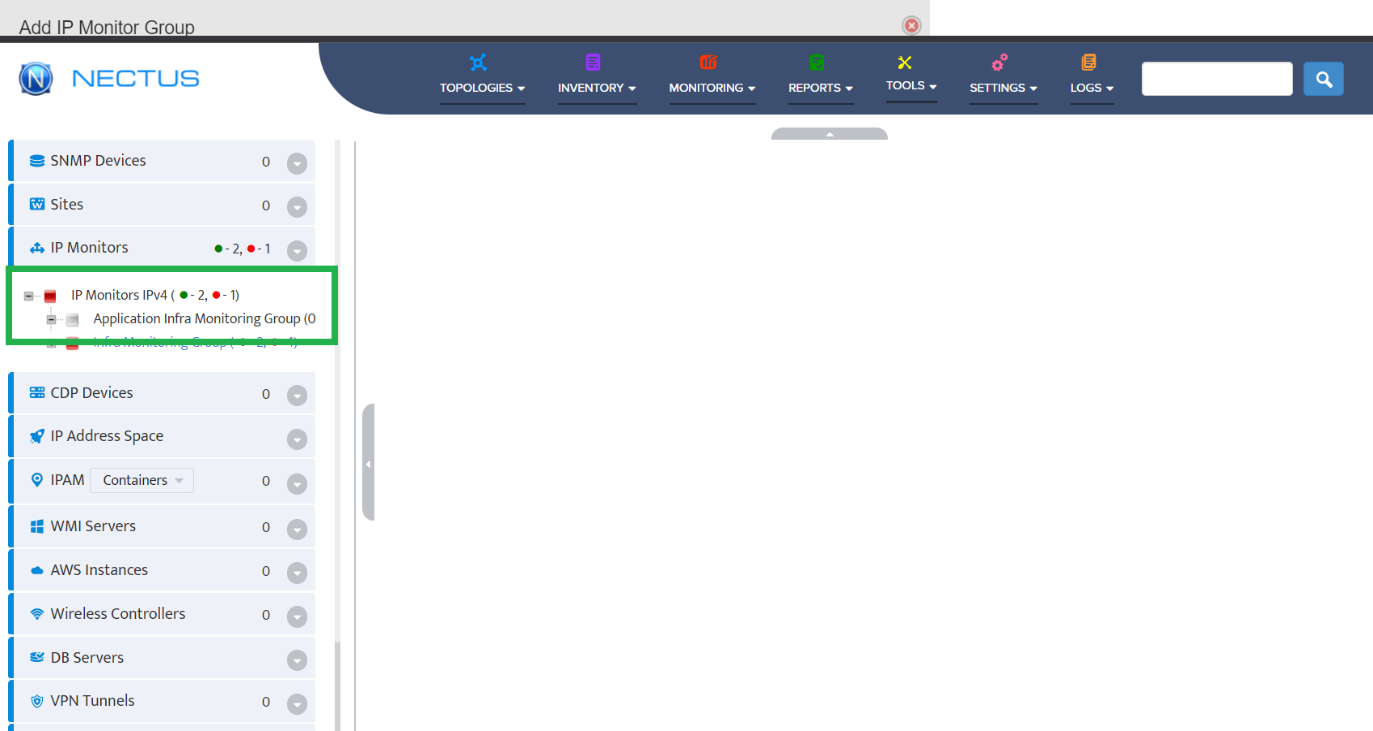
Step 4: Now, the new group gets added under IP Monitors. The square icon indicates the status and since no device is added in the group, it’s shown in grey color.
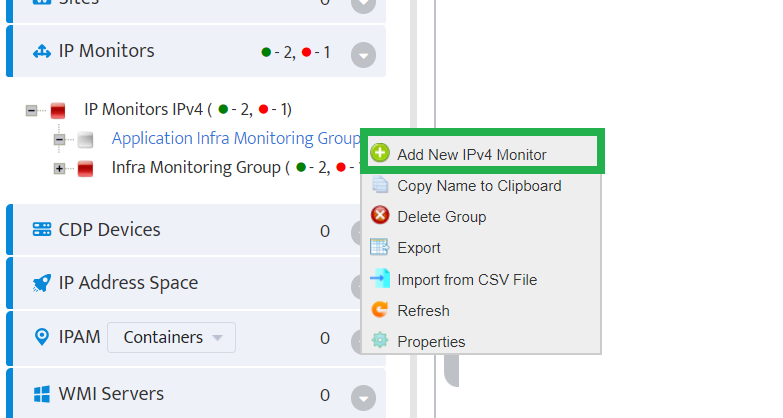
Step 5: Right click on the IP Monitor Group to add a new IP Monitor into the group.
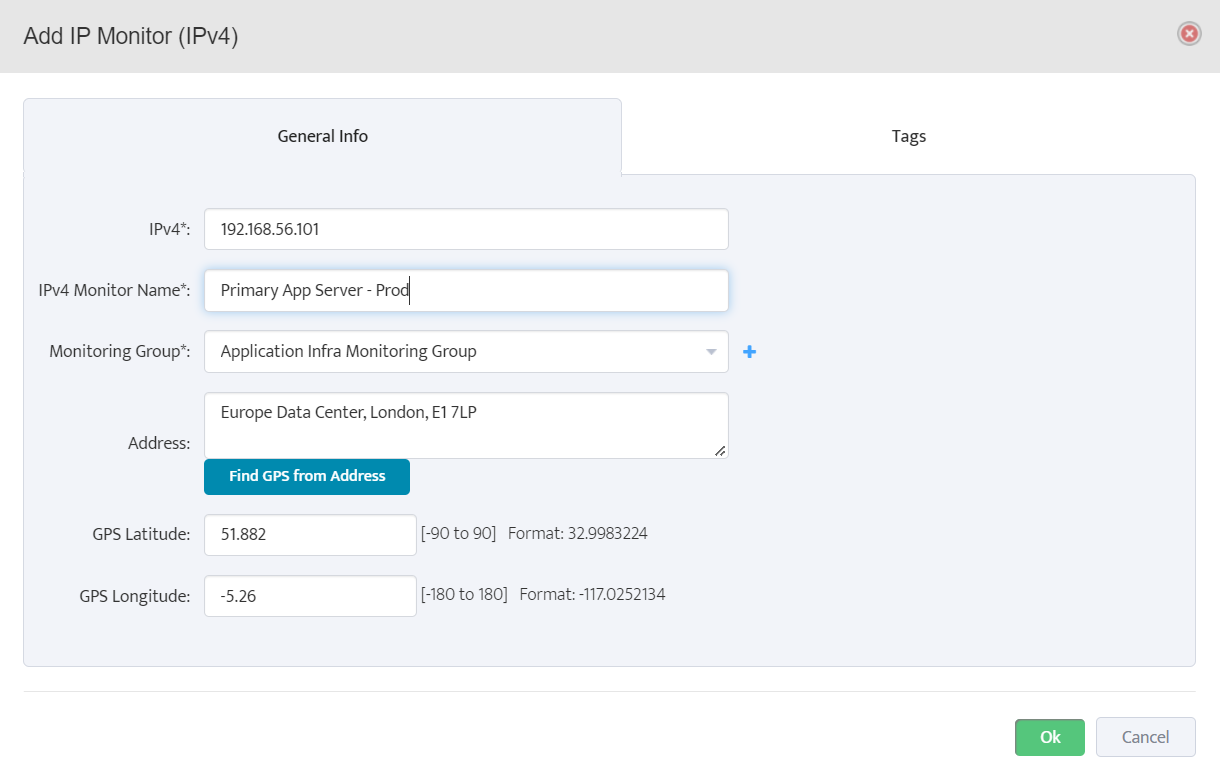
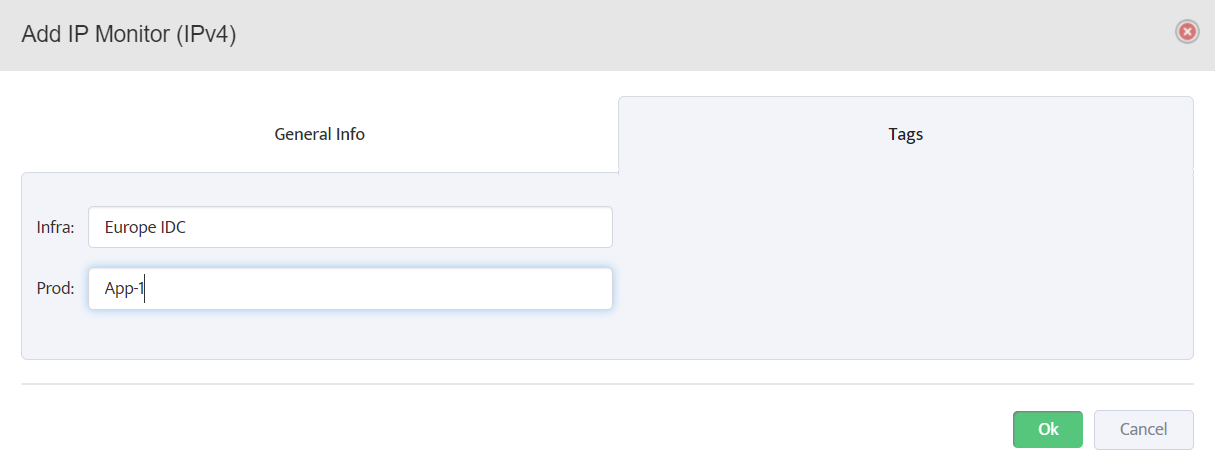
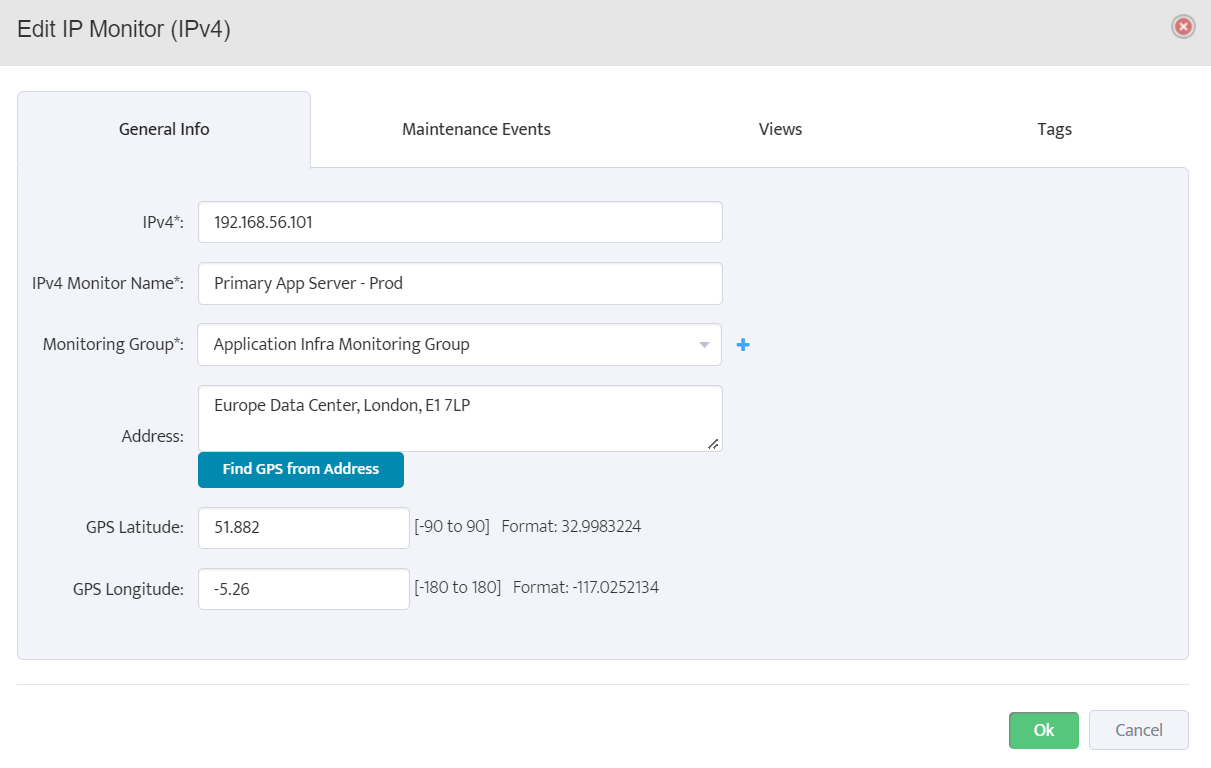
Step 6: Under the General Info Tab, provide a valid IP, name and optional physical address.
Then, click on Ok button to Add IP Monitor.
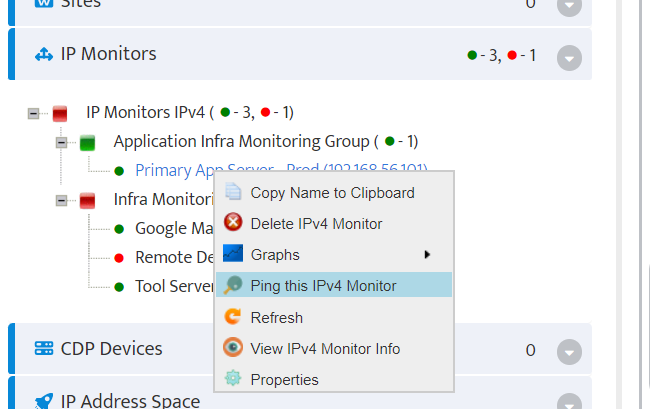
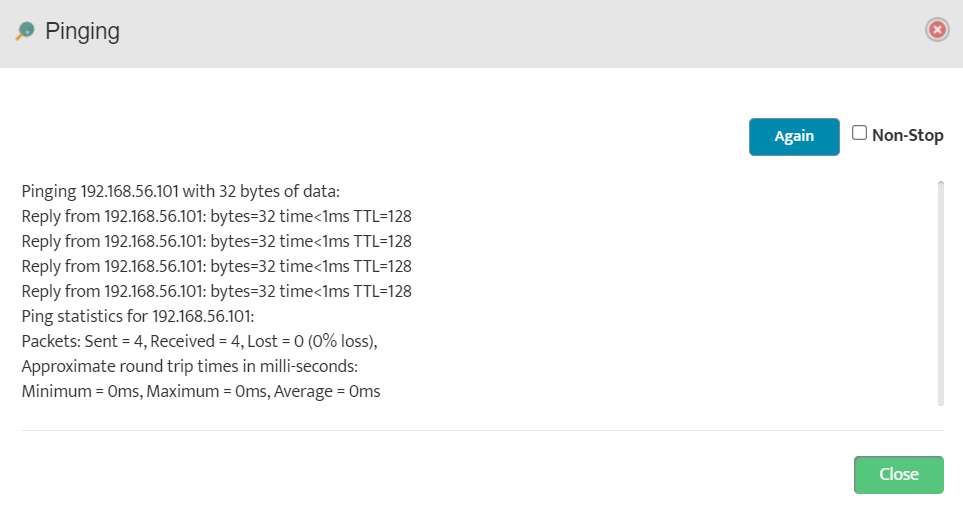
Step 7: To test the reachabilty of IP Monitor, we can use Ping this IPv4 Monitor option. It performs a live ICMP ping test to the IP Monitor.
Step 8: It also provides the options to repeat the test and continue ping tests.
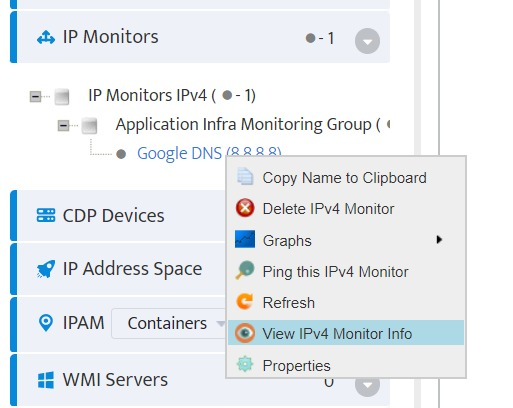
Step 9: To get the current device monitoring information, go to View IPv4 Monitor Info.
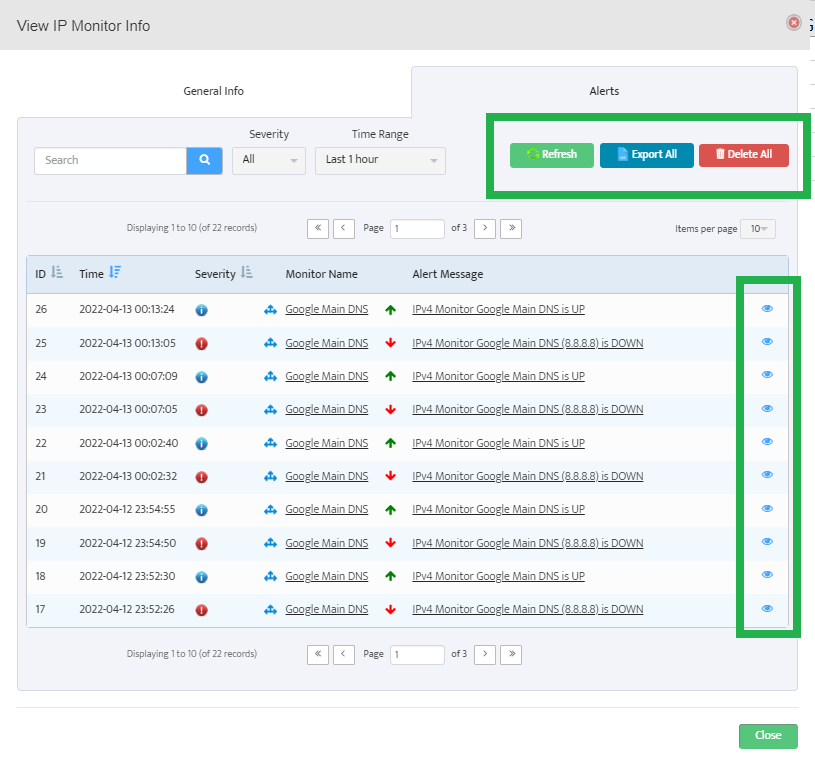
Step 10: The General Info provides the basic details about the device.
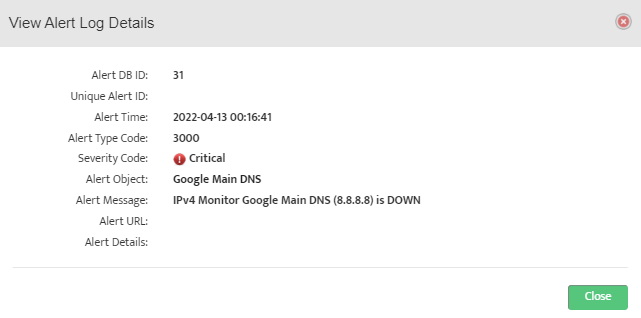
Alerts tab contains all the monitoring alerts. All alerts can be exported in *.csv format for further drill down. Click on eye icon in each row to get more information about the alert.
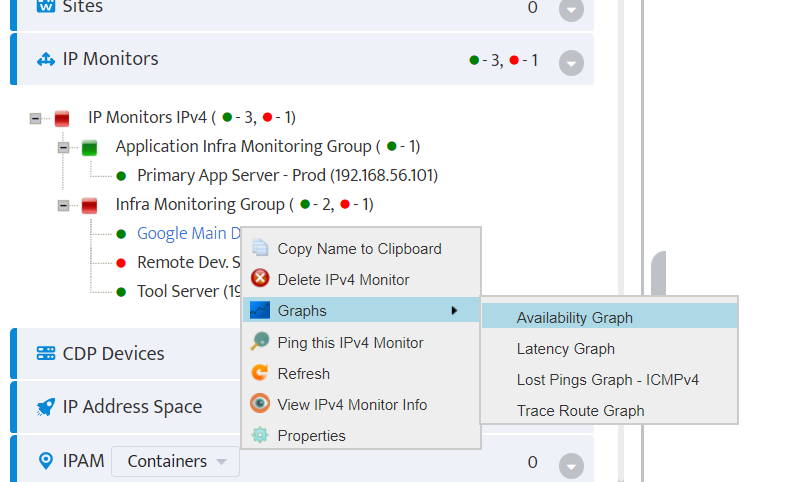
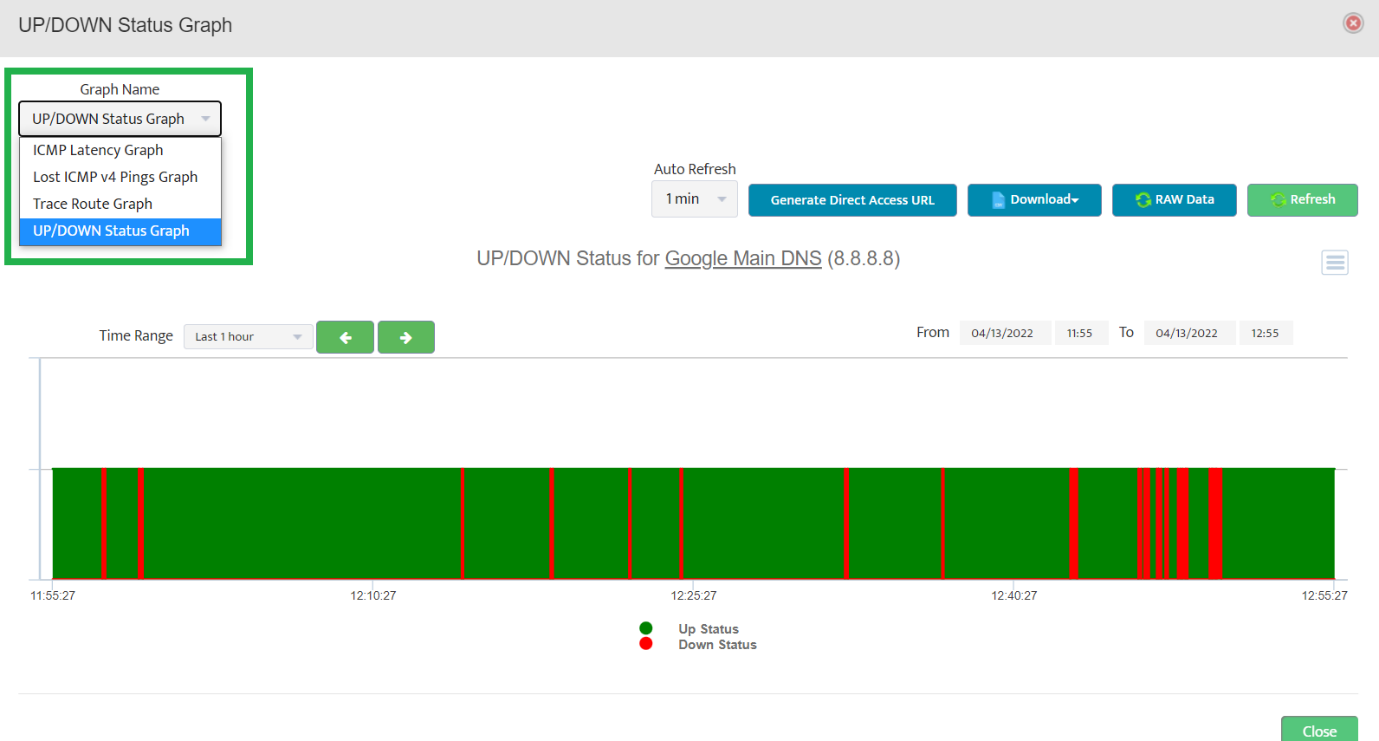
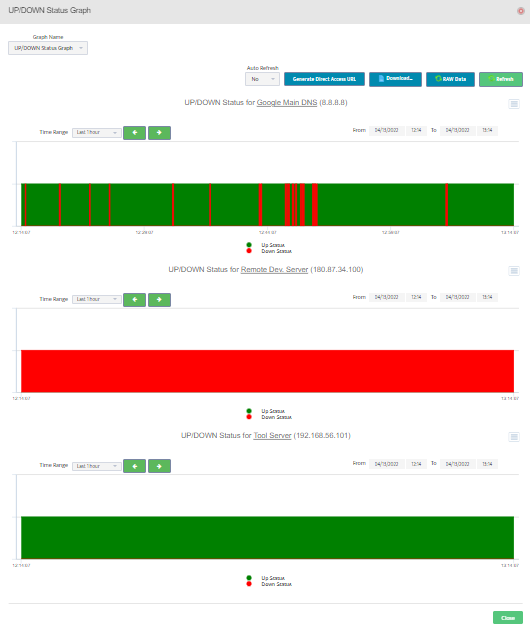
Step 11: Right click on the device and Graphs to get a plot based on UP/DOWN state, latencies etc.
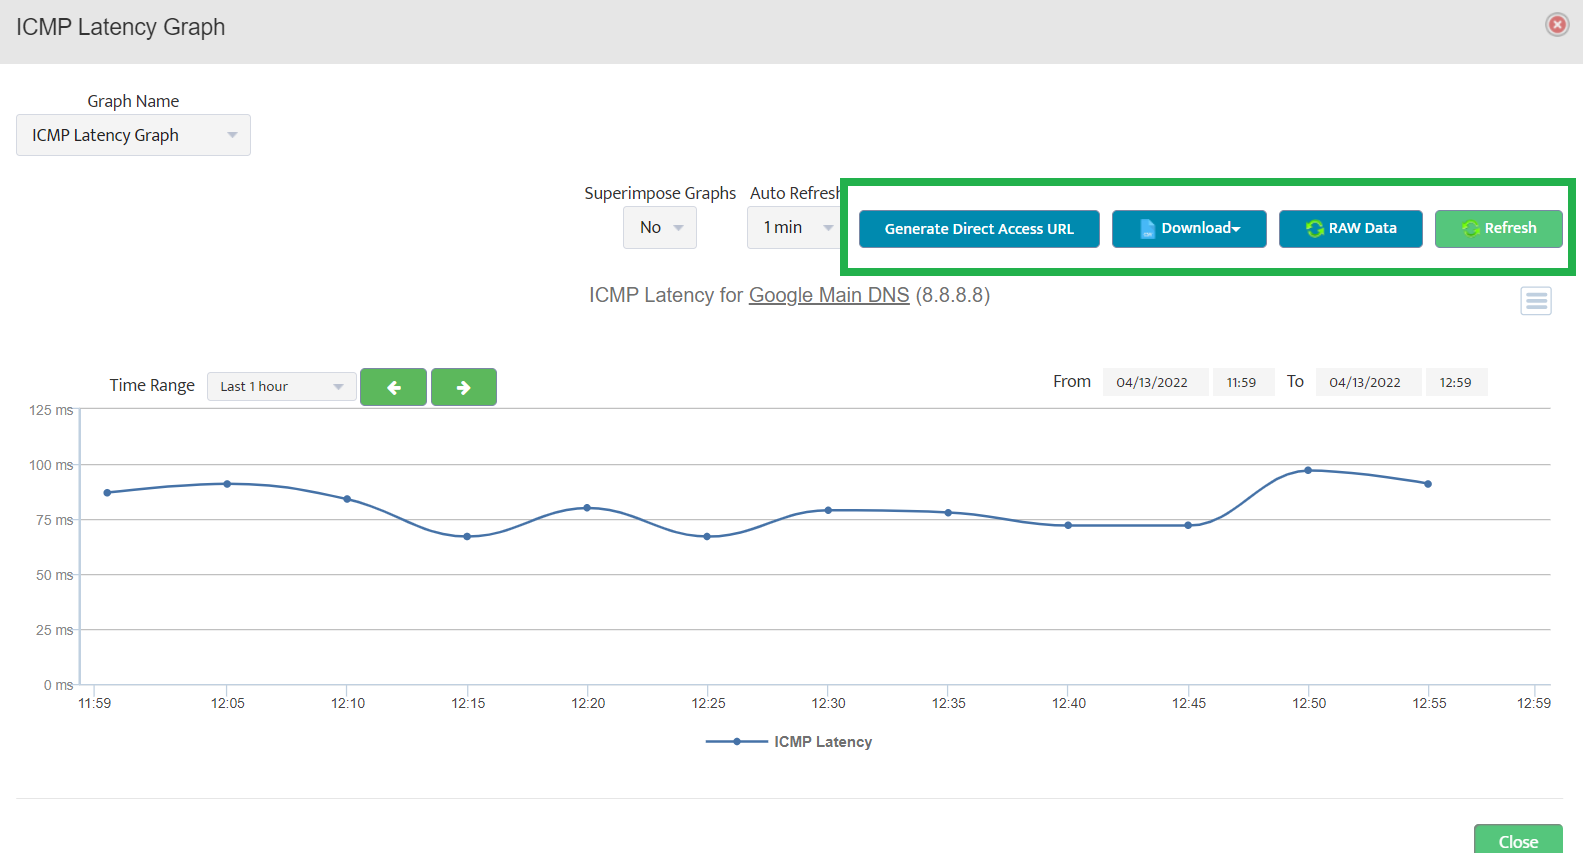
Step 12: We can share the polled data from Nectus in several ways.
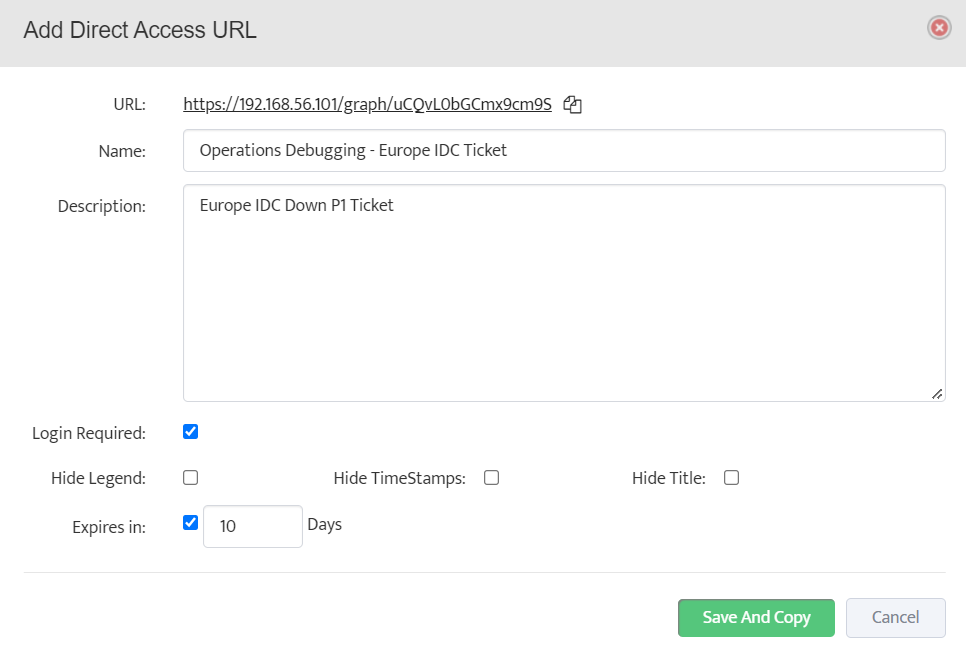
Step 13: We can share the access to graph using Generate Direct Access URL.
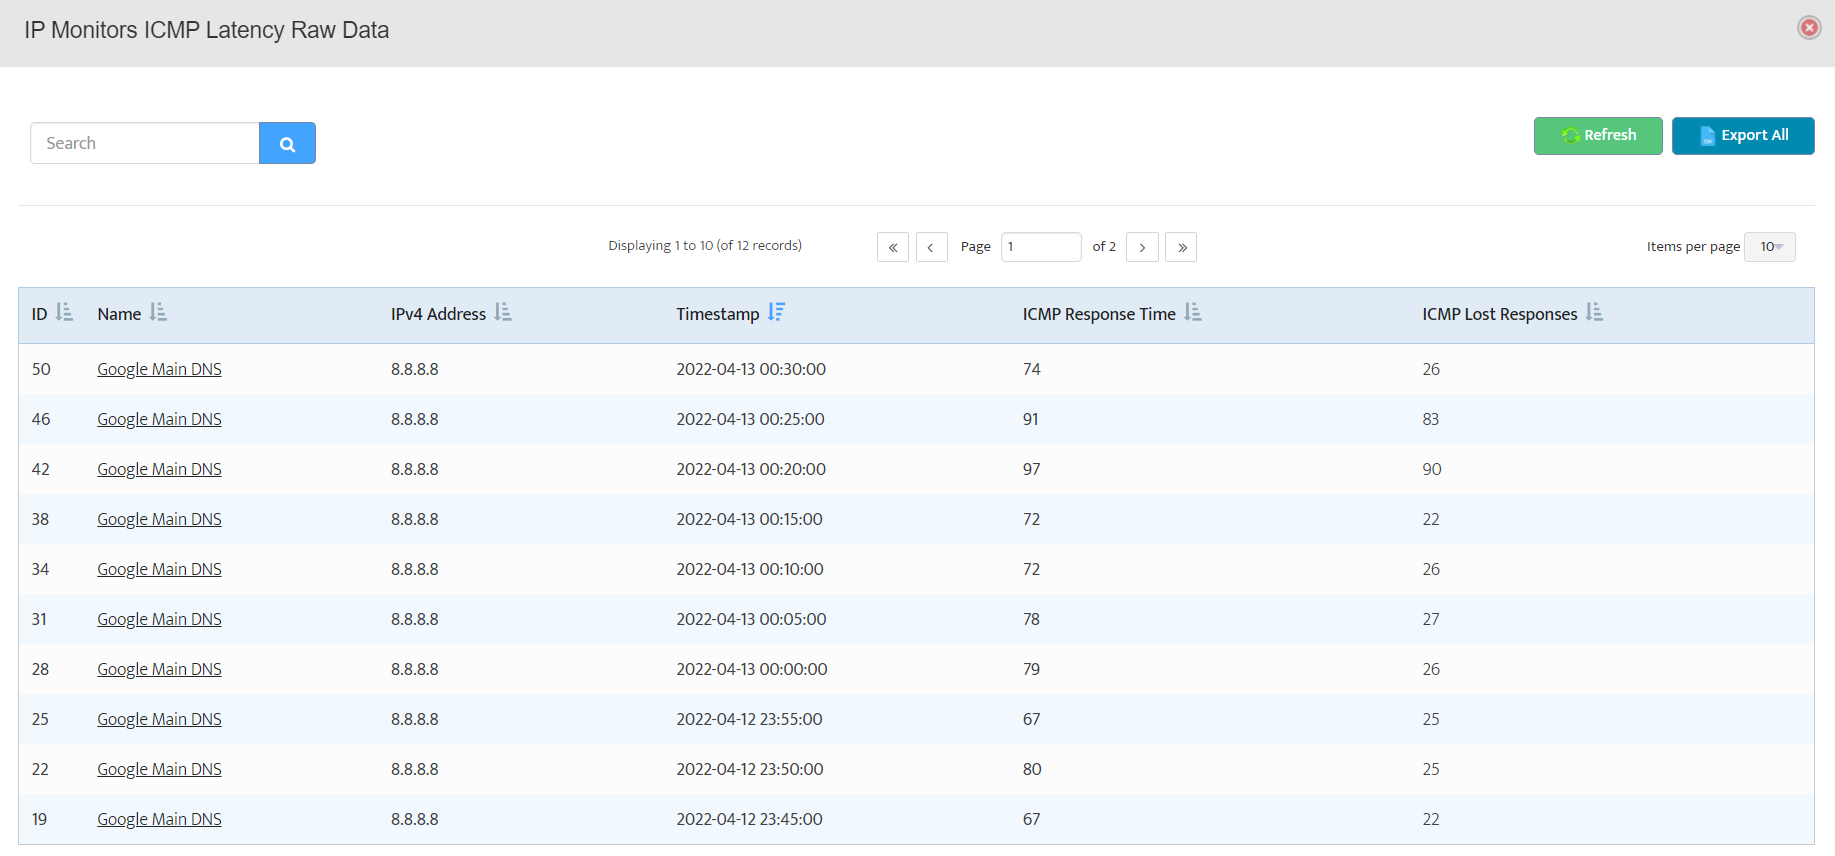
Step 14: Further, we can also export all data points in a *.csv form using Export All option.
Step 15: We can select multiple devices using CTRL + Left Click. Right click on any one to get the available options.

Step 16: Select the Graphs option to obtain the consolidated view of the plots for the selected devices.
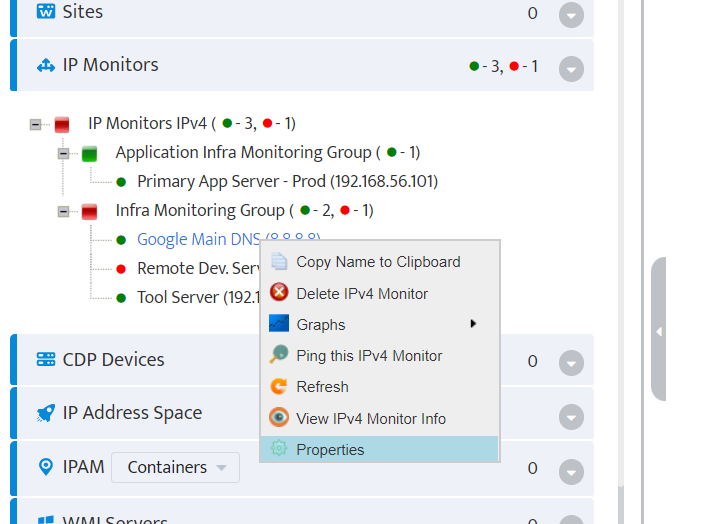
Step 17: To edit the added devices, right click on the device and choose properties.
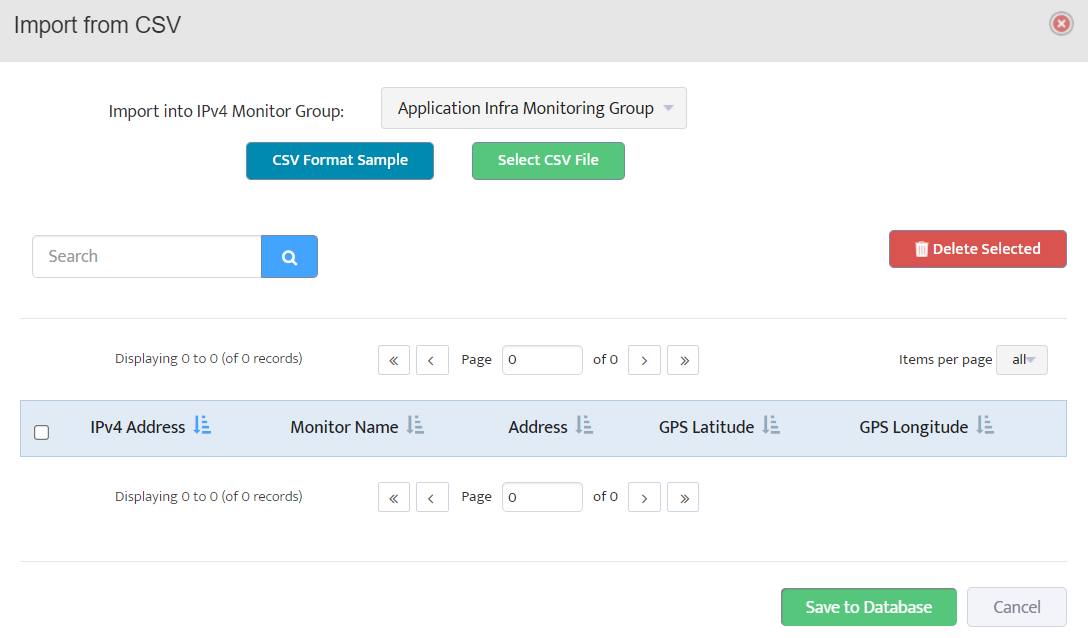
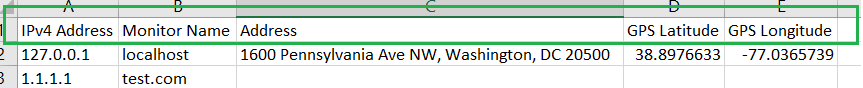
Step 18: Bulk import through a *.csv file can be performed and sample file can be downloaded from Import from CSV modal for quick reference.
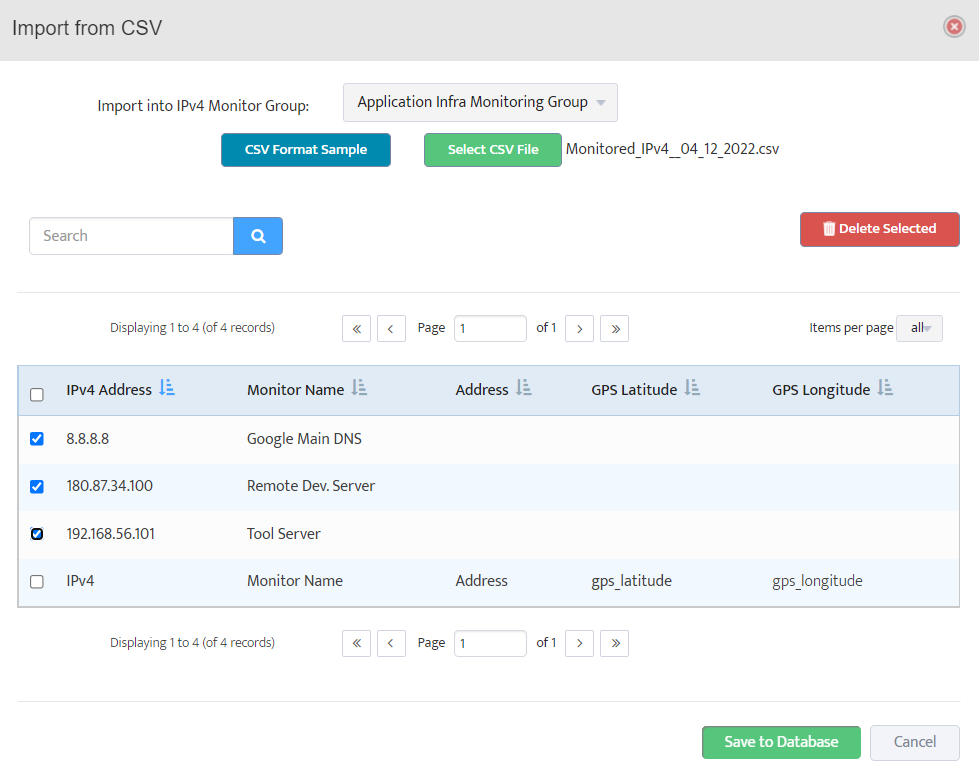
Step 19: Post the data import completion, skim through the device information, and select them to save into the database for the monitoring.
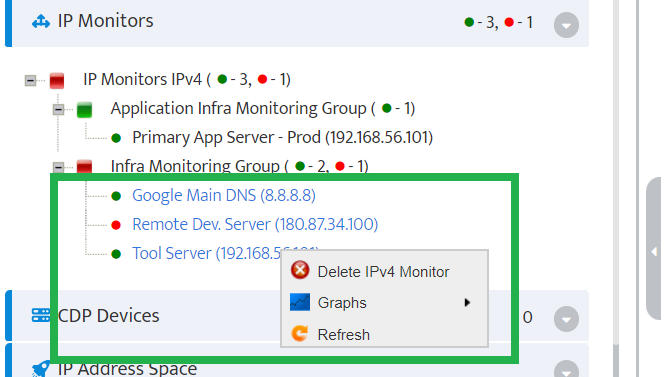
Step 20: Additionally, we can select Delete IPv4 Monitor to delete the devices from monitoring.
Congrats! We have successfully explored the lifecycle management of devices for ICMP monitoring using IP Monitor.