![]()
Troubleshooting of any wireless problems usually starts with determination of specific Access Point where client is currently associated with and tracking wireless client’s roaming behavior in time.
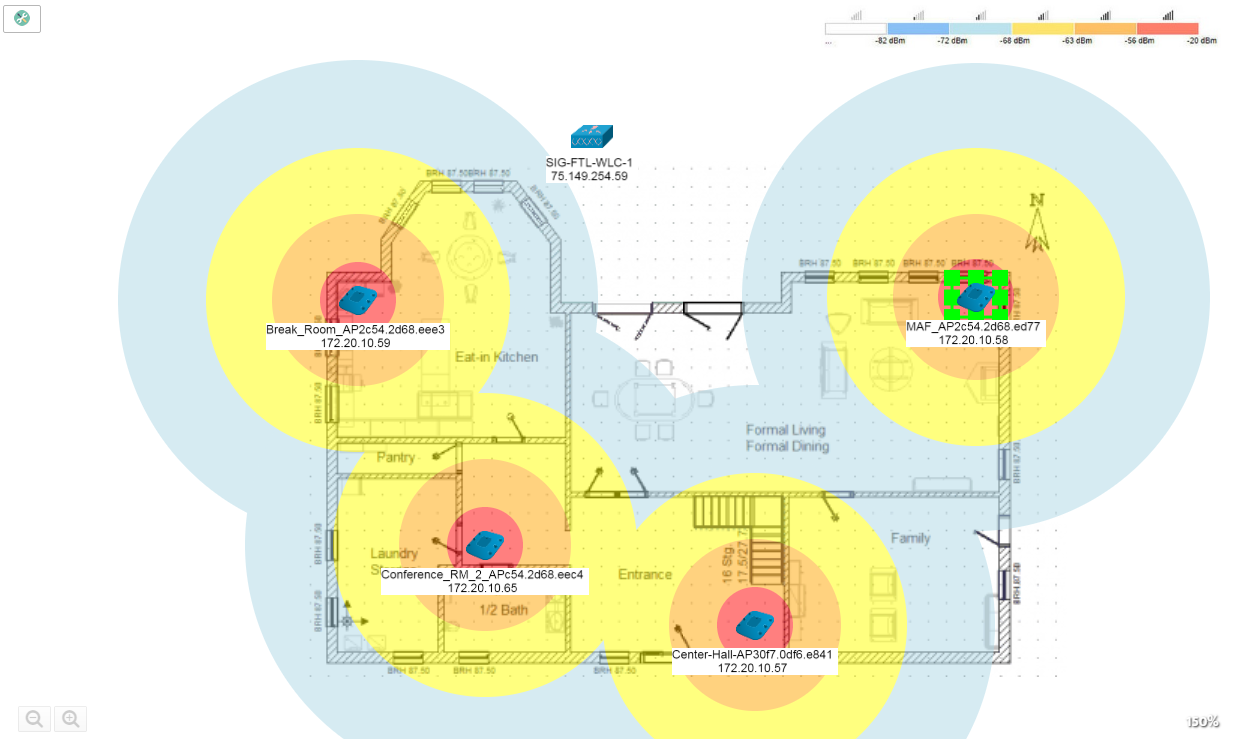
Access Point detection helps to understand current RSSI levels at given selected channel and presence of alternative AP at the client’s location.
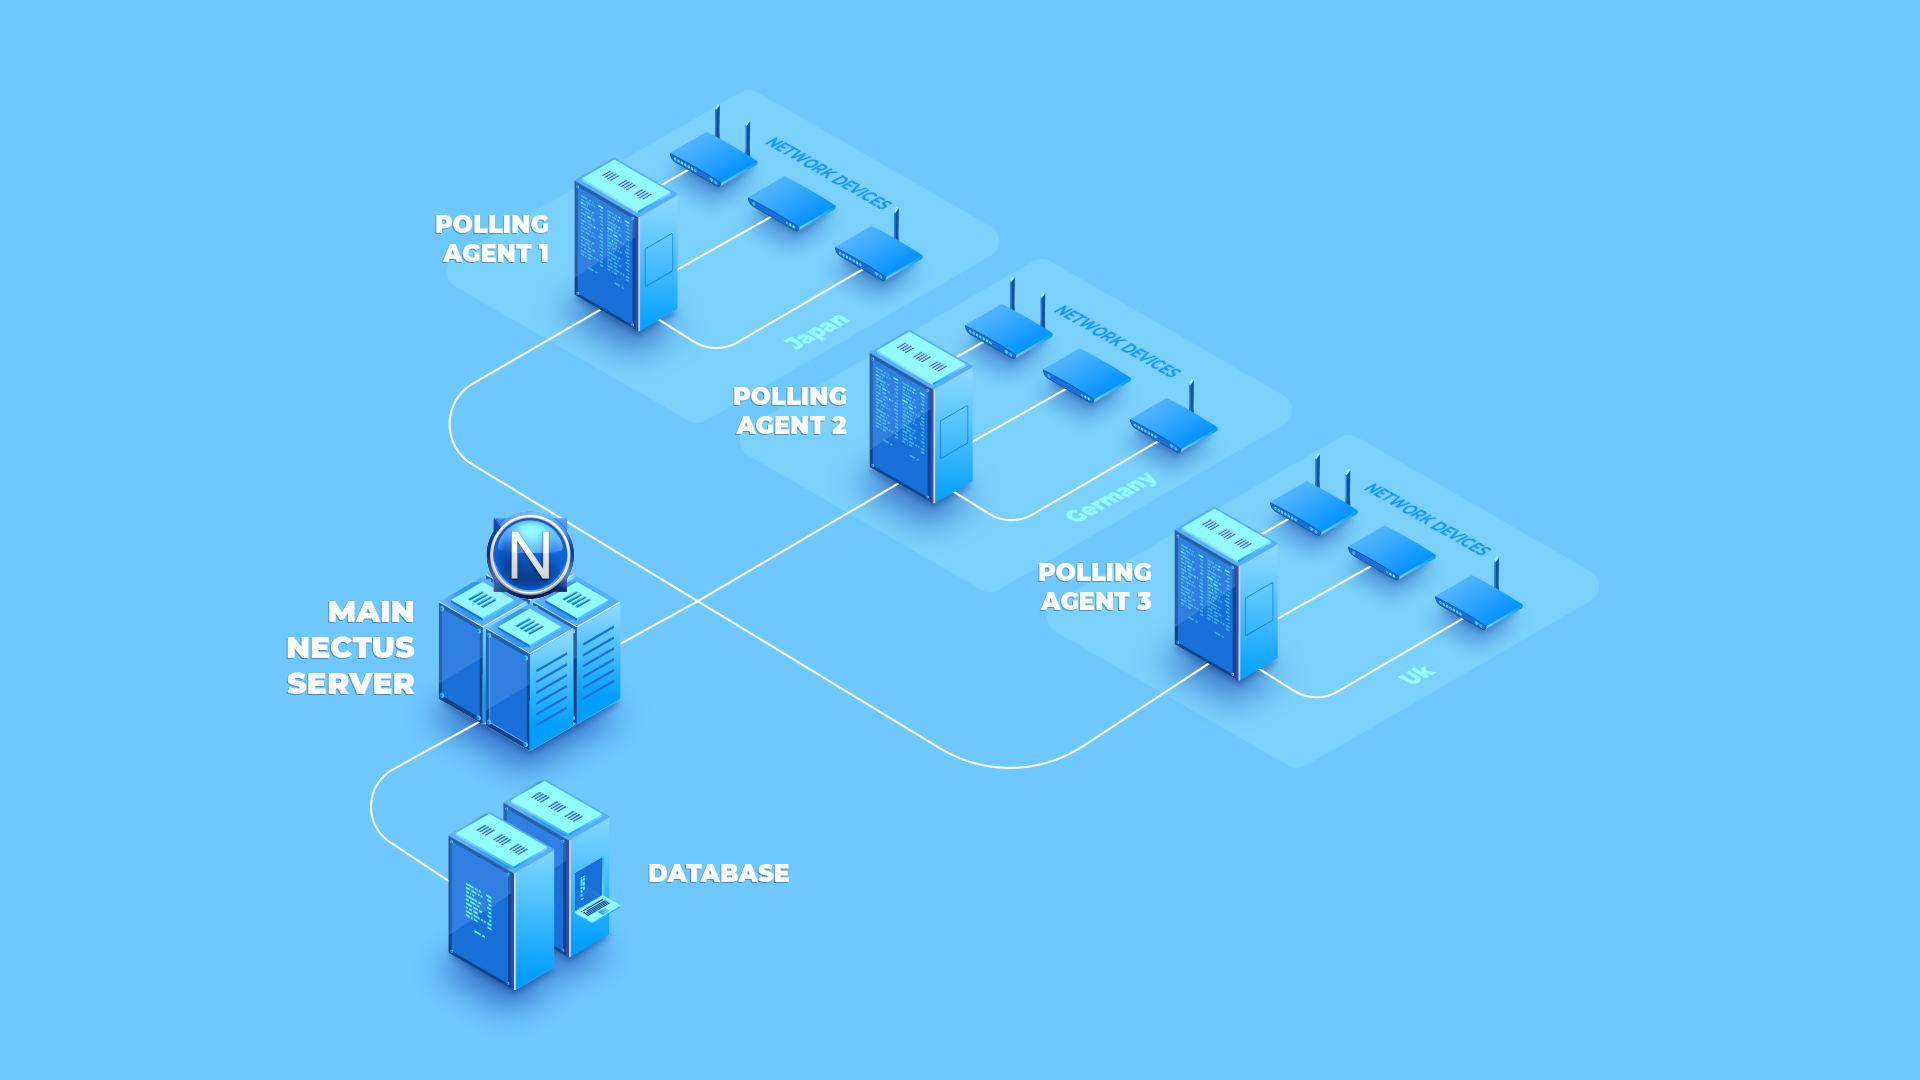
Nectus provides basic tools that make locating and tracking wireless objects an easy task.
The specific topics we will cover in this chapter are:
- Using the Wireless Client Search Tool
- Using the Wireless Client Tracking Tool
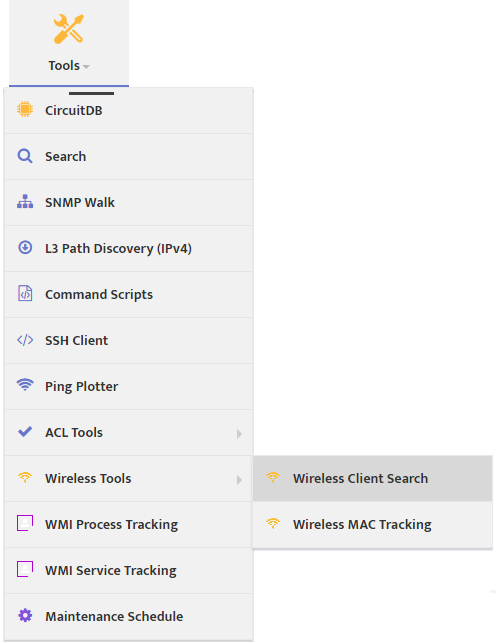
1. Using the Wireless Client Search Tool
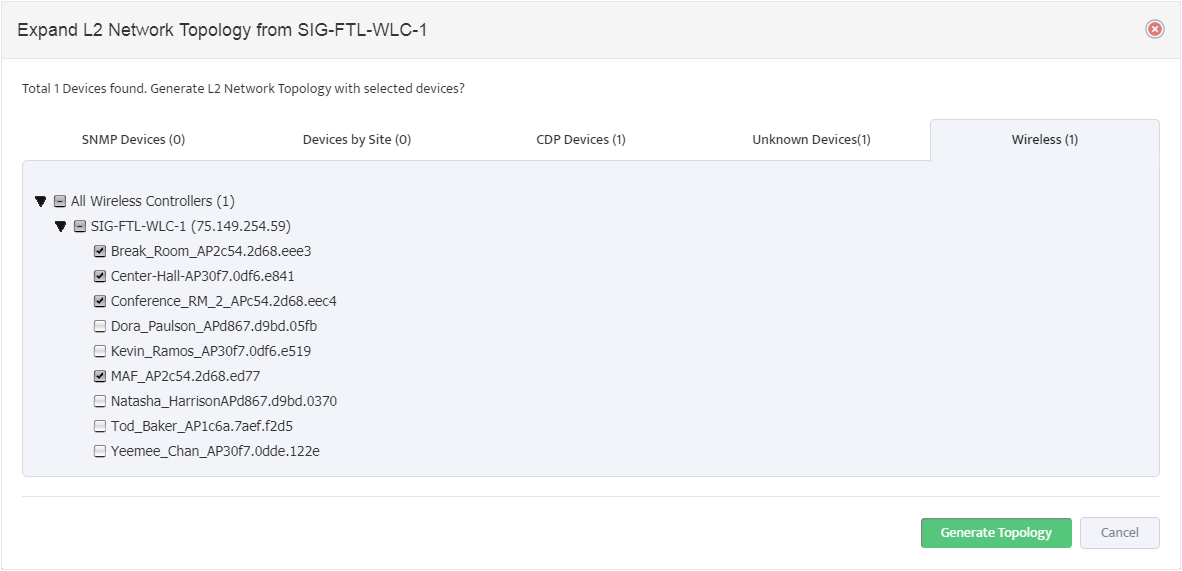
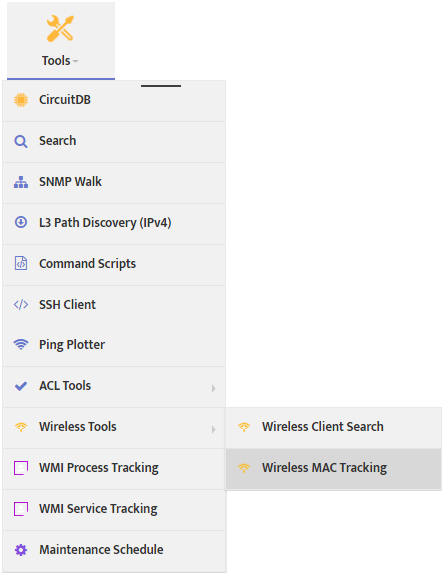
The Wireless Client Search tool shows you which access point (AP) a Wireless Client is connected to right now. To use Wireless Client Search go to the Nectus Home Screen and select Tools -> Wireless Tools -> Wireless Client Search.
This opens the “Wireless Client Search” dialog box.
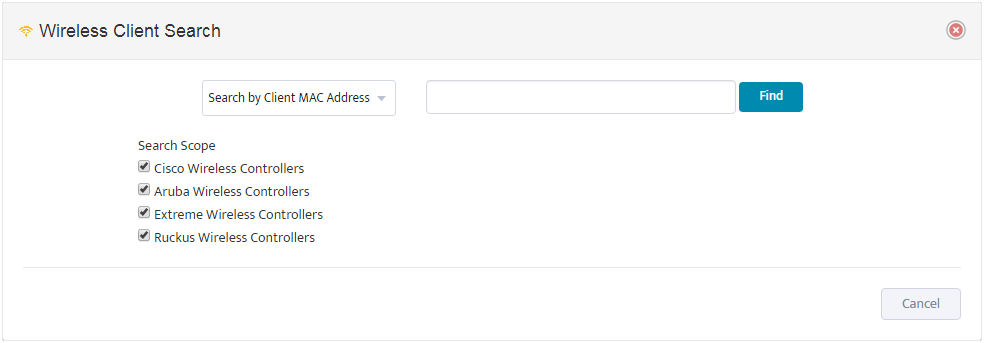
Search for the wireless object by entering all or part of the Client MAC Address, IP Address, or Username. Set the Search Scope by checking any of the supported Wireless Controller types.
The search returns any matching objects in a table.
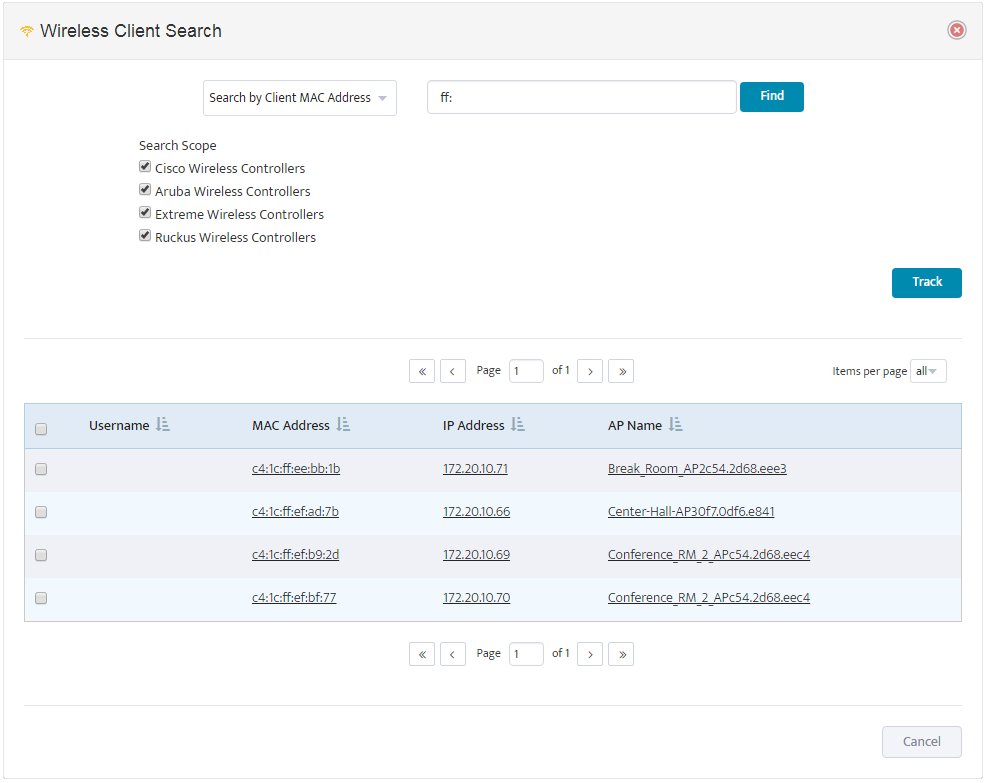
Click the MAC Address of the object to see all the Basic information the system has about that object.
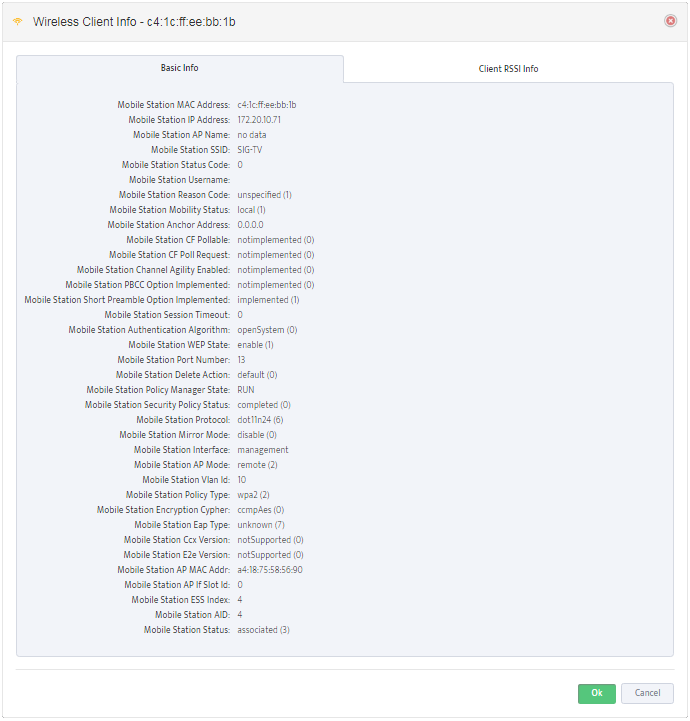
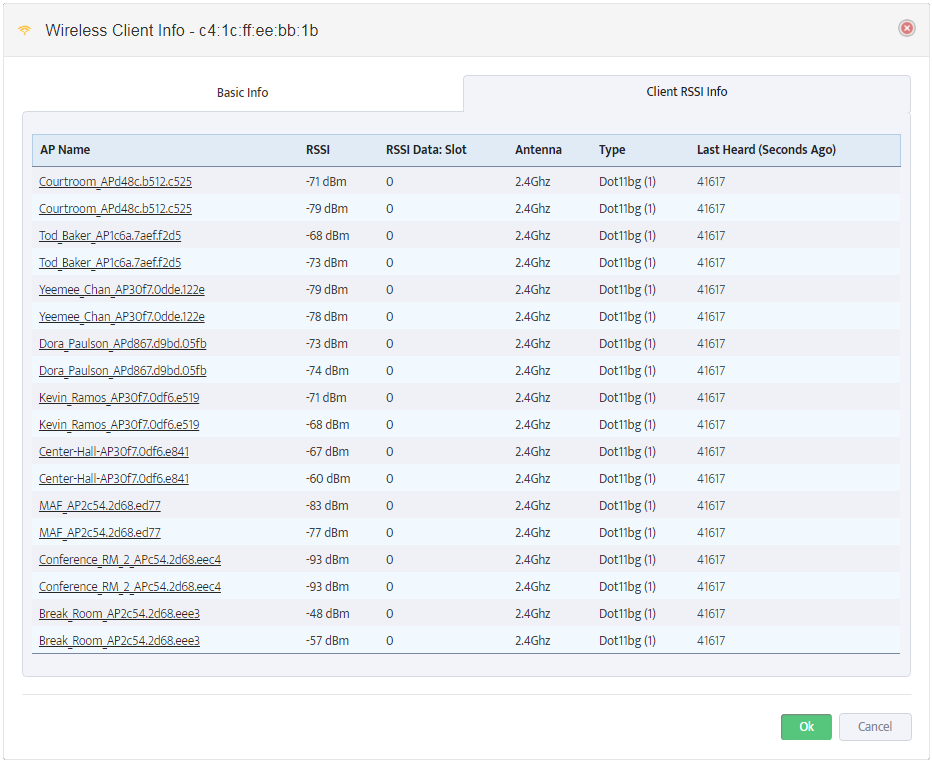
Click the Client RSSI Info tab to see the RSSI (Received Signal Strength Indication) for every access point the object can detect.
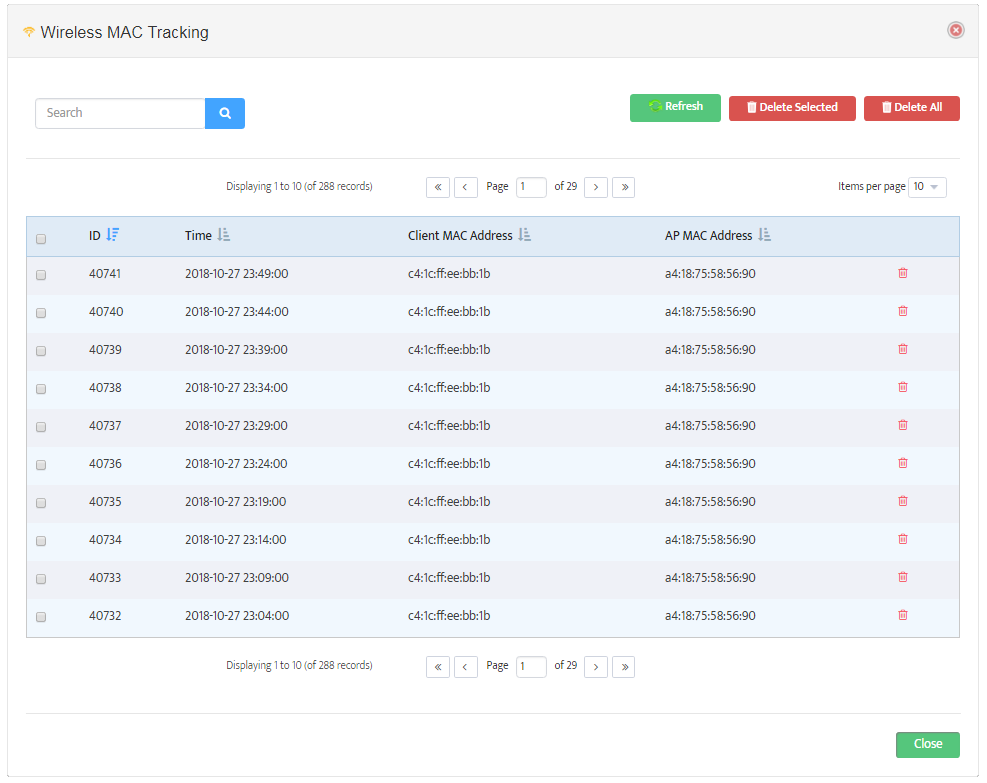
2. Using the Wireless MAC Tracking Tool
The Wireless MAC Tracking tool is useful for troubleshooting intermittent problems. It uses the object’s MAC address to record which AP the object is connected to over a period of time. To use Wireless Client Search go to the Nectus Home Screen and select Tools -> Wireless Tools -> Wireless MAC Tracking.
This opens the “Wireless MAC Tracking” dialog box.
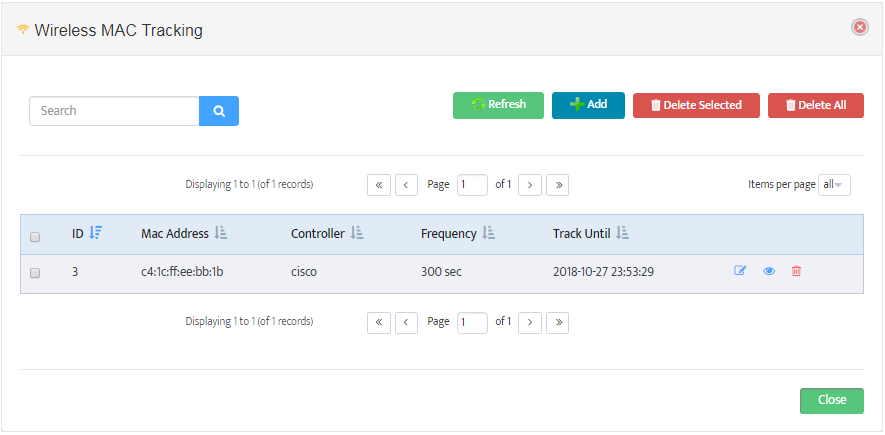
Click Add to begin tracking a MAC Address.
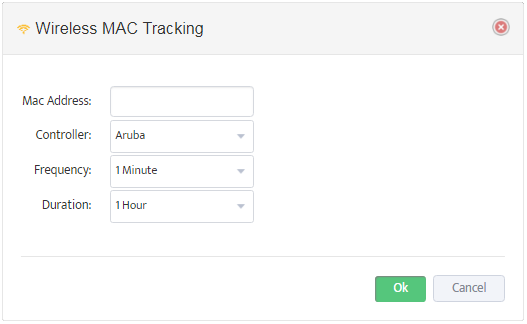
Enter the MAC Address you want to track, the Controller type, the Frequency of recording data, and the Duration of time you want to track the MAC address.
Once the Duration is complete, you can see the results by clicking the View MAC Tracking icon.