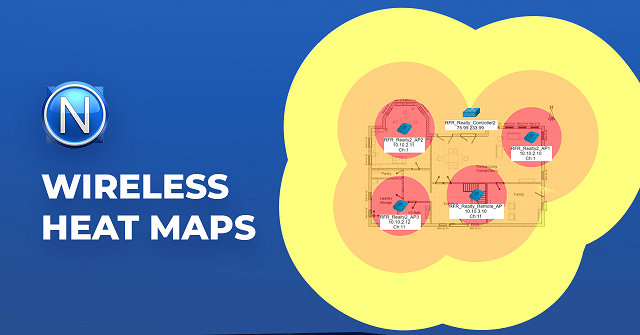
Generating Wireless Heat Maps
Wireless Heat Map is the visual representation of the wireless signal levels at different locations of specific selected area.
Area can be a building floor or outdoors. We read signal level directly at the antennas of the Wireless APs and calculate signal attenuation with a distance
and overlay resulting signal levels on top of area map with a known dimensions.
In this chapter, you’ll learn how to generate Wireless Heat Maps of any area.
The specific topics we will cover in this chapter are:
- Preparing the Background Image
- Creating a New L2 Topology
- Placing the Background Image and Specifying the Scale
- Selecting the Wireless Controller
- Expanding the Topology and Selecting Your Access Points
- Positioning Wireless APs on the Heat Map
1. Preparing the Background Image
The Background Image shows the physical layout of the area that will be included in the Heat Map.
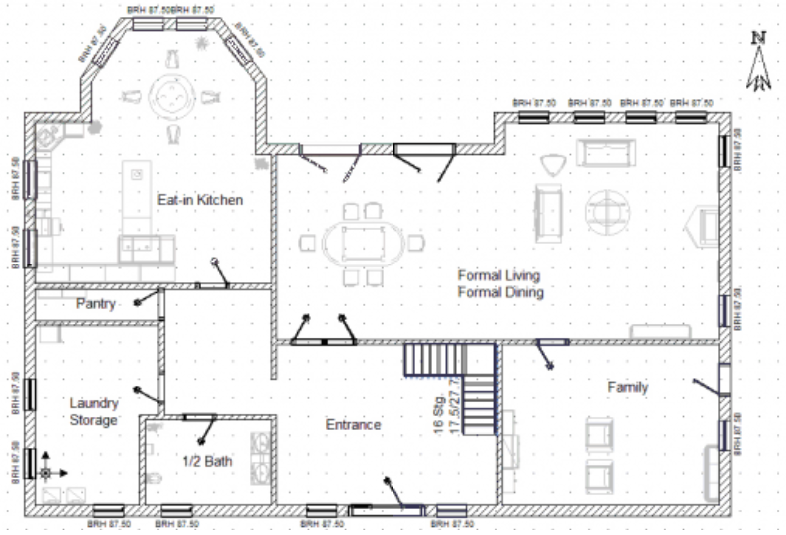
The image needs to be scaled with equal proportions horizontally and vertically. PNG and JPEG image formats are supported. You will need to be able to enter the corresponding length of the image, in feet, to create an accurate Heat Map.
Create the Background Image before proceeding to Step 2.
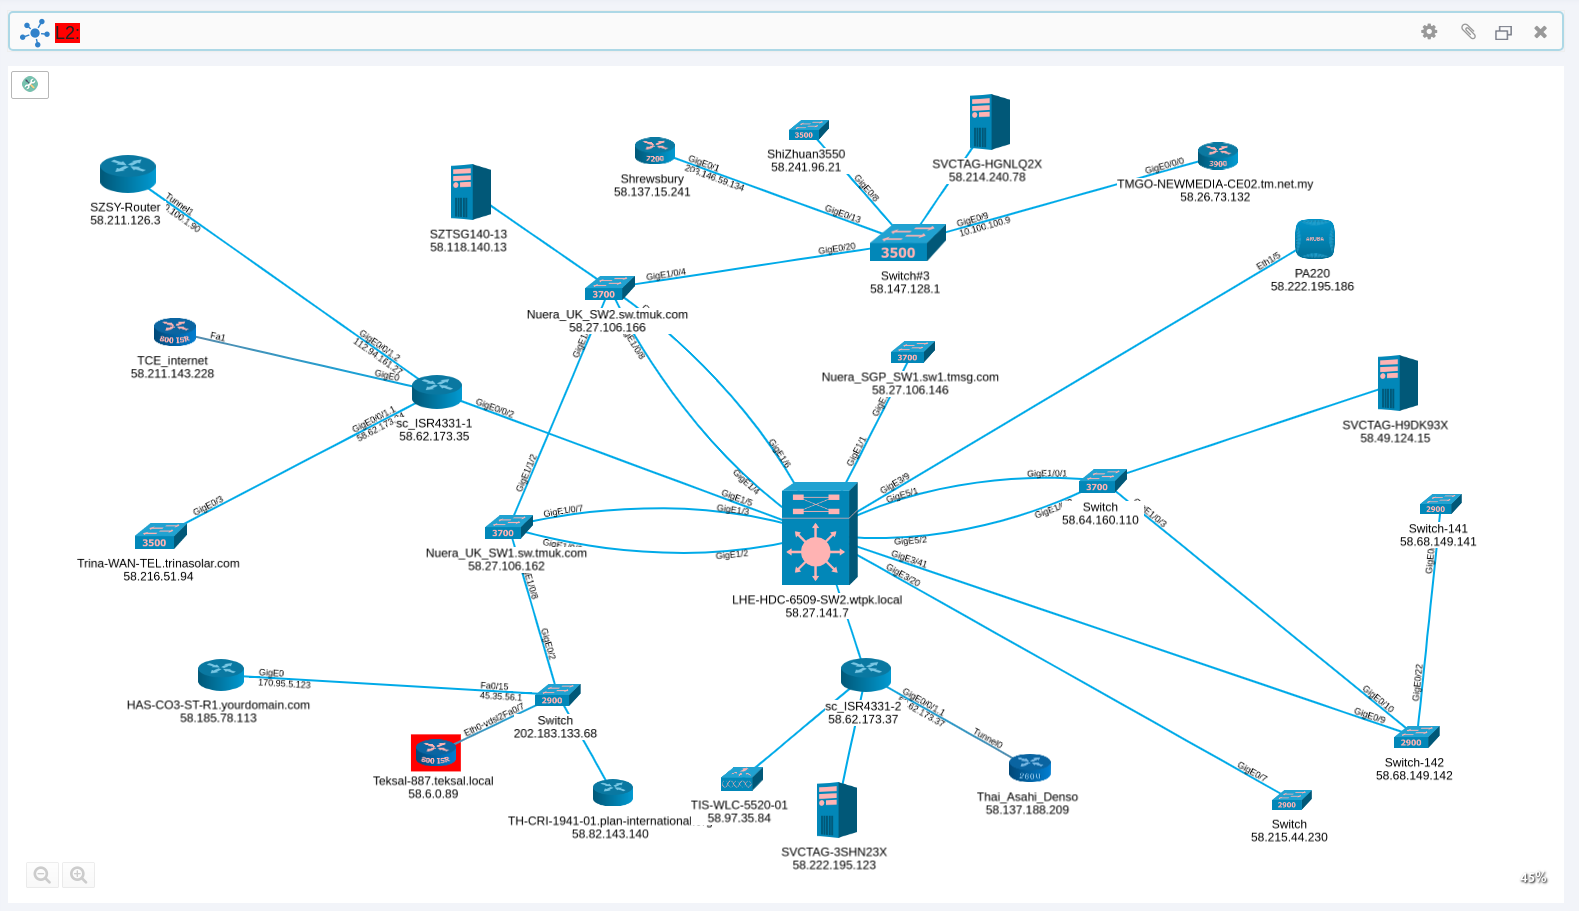
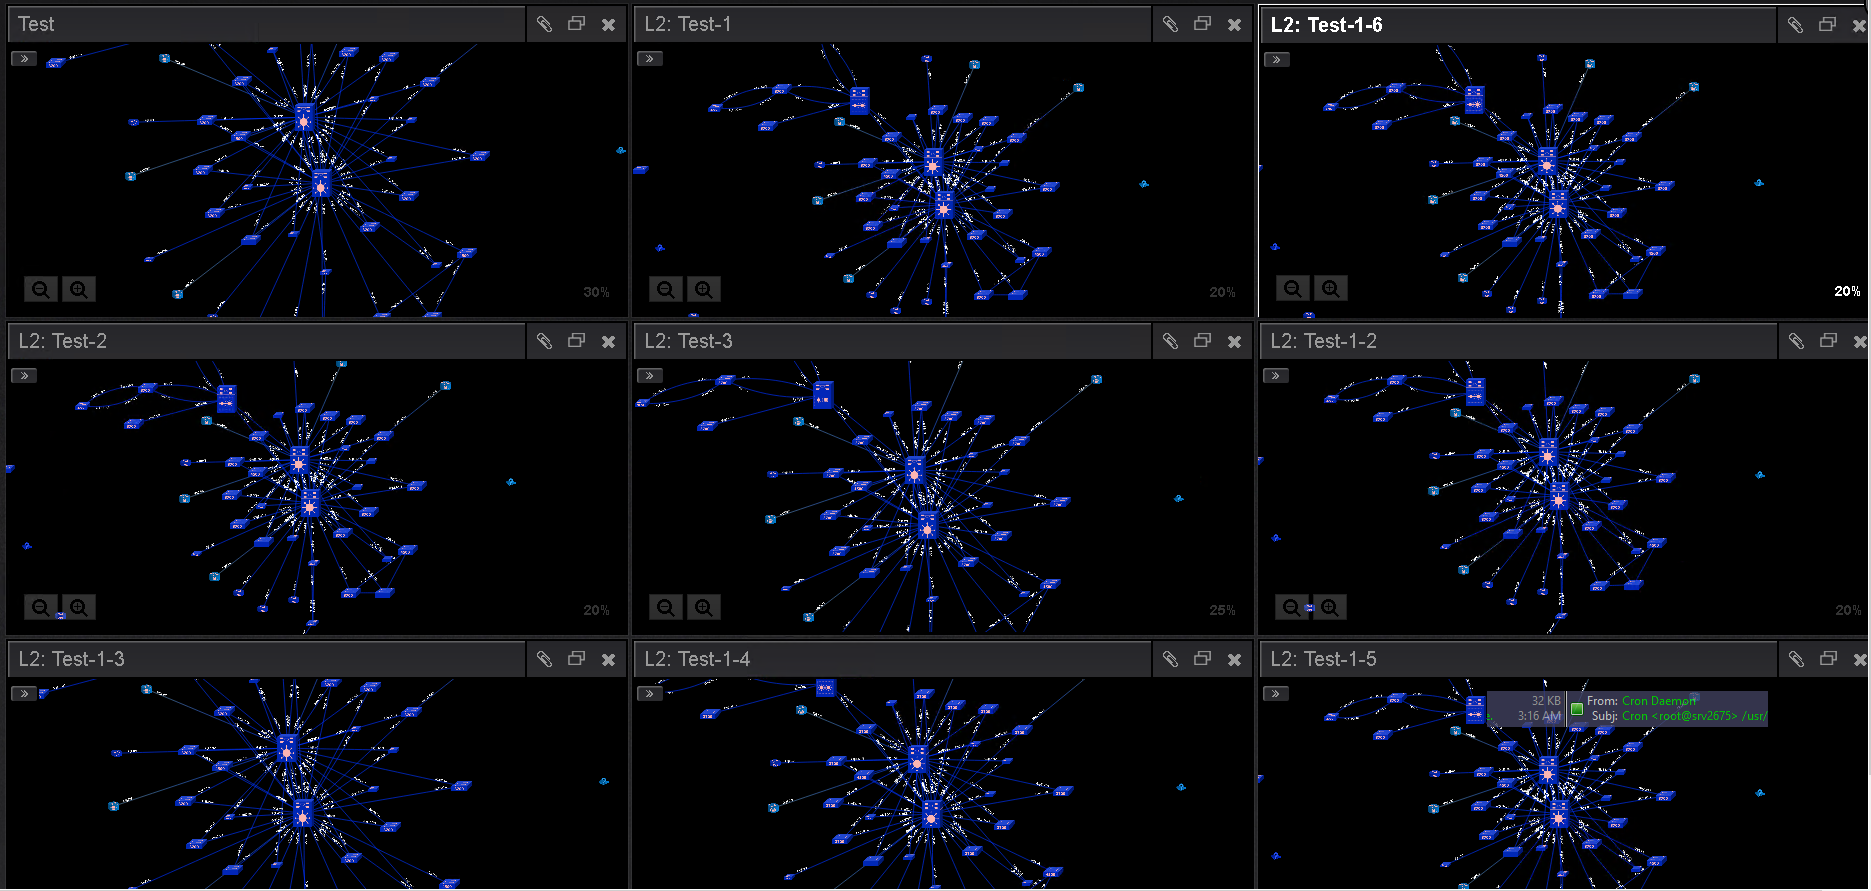
2. Creating a New L2 Topology
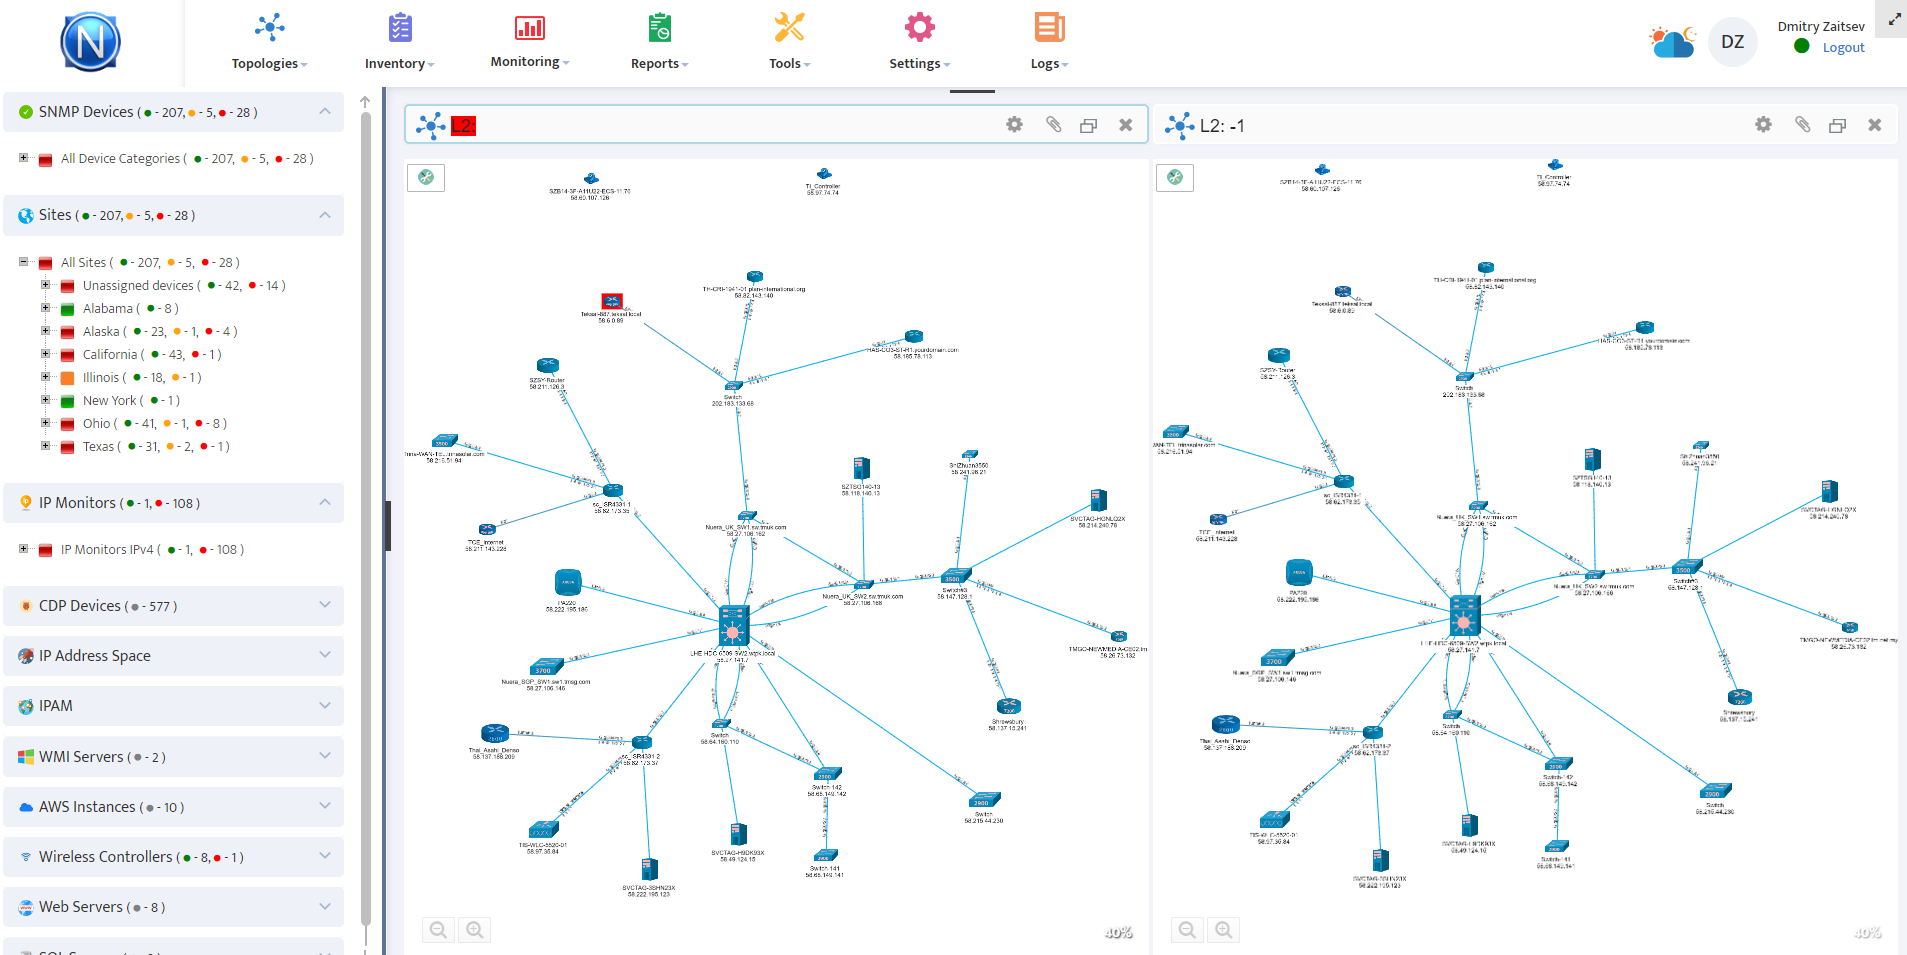
Once you have the Background Image prepared, you will need to create a new L2 Topology for your Heat Map. To create a new L2 Topology go to the Nectus Home Screen and select Topologies -> Start New L2 Topology.
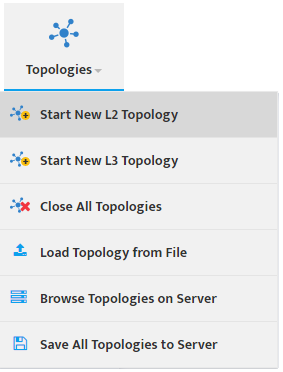
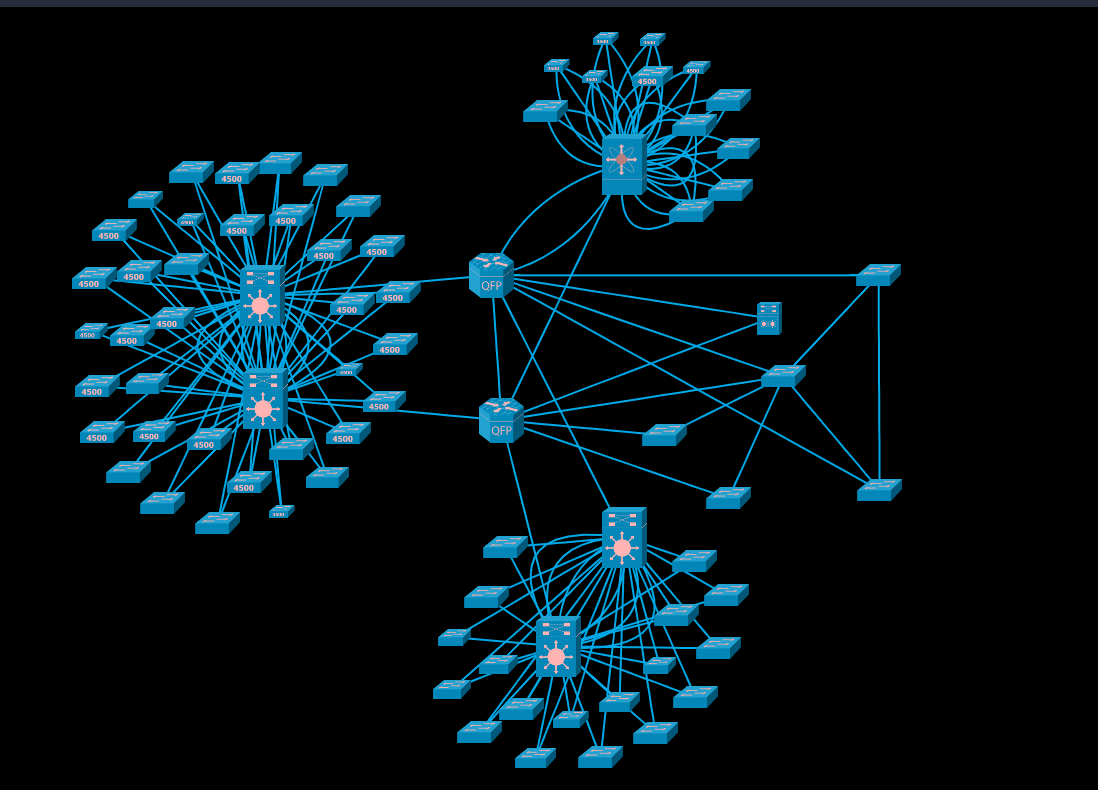
An empty L2 Topology appears.

3. Placing the Background Image and Specifying the Scale
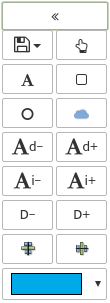
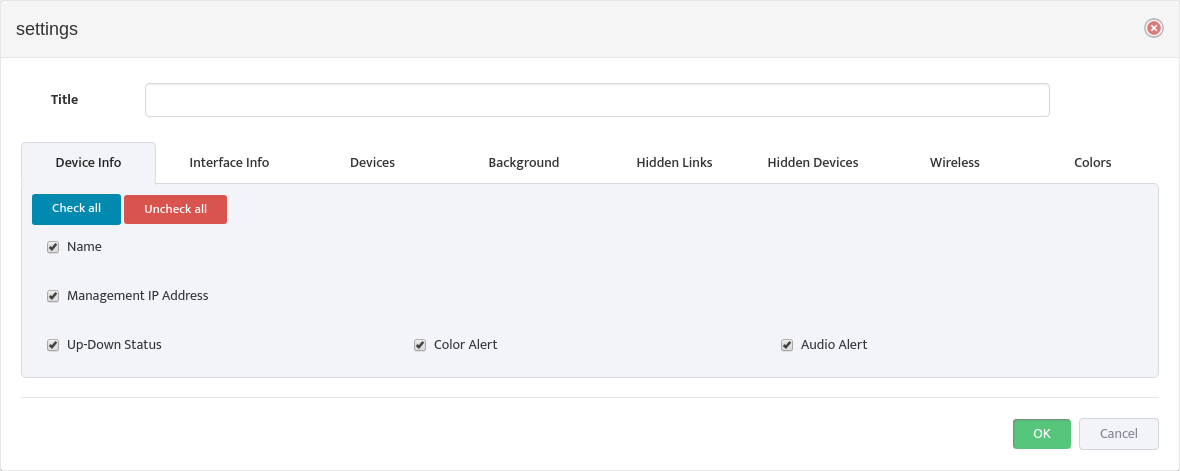
To place the Background Image in the Topology, click the L2 Topology Settings icon to open the “Settings” dialog box then select the Background tab.
Check the Display Image check box and load the Background Image you created in Step 1.
Enter the horizontal length of the Background Image (in feet) in the Background image length in Feet field.
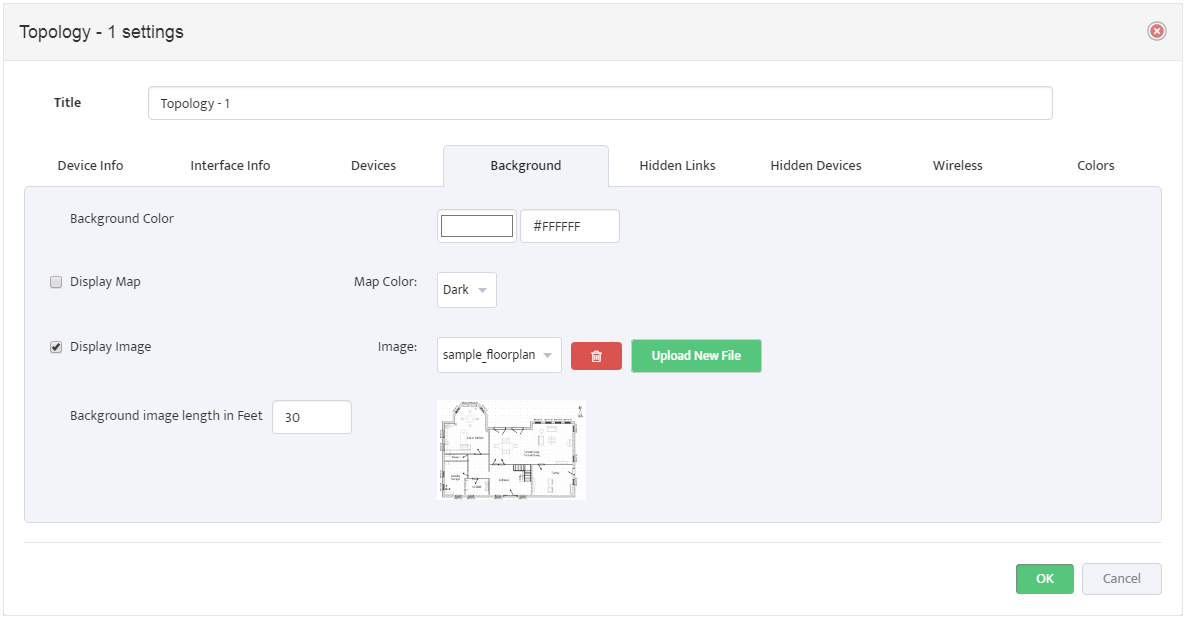
Once the Background Image is visible in the Topology you can resize and reposition it as desired.
4. Placing the Wireless Controller
Find the Wireless Controller for this area in the Wireless Controllers section of the Sites Panel and drag it onto the Topology.
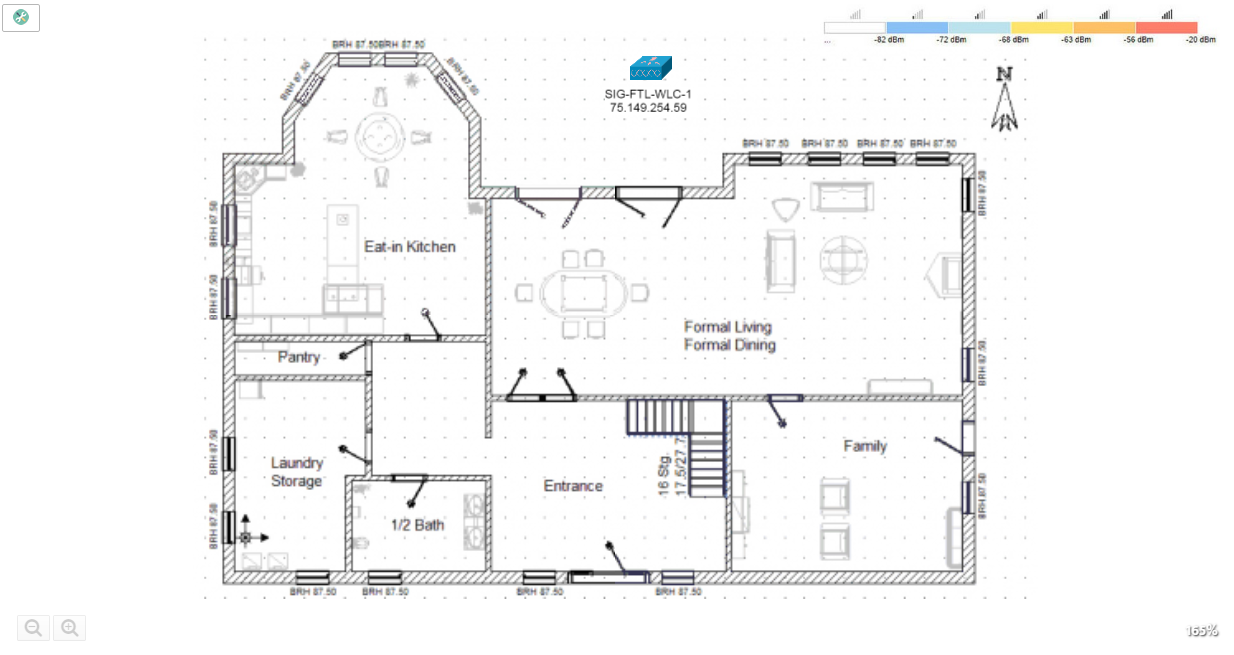
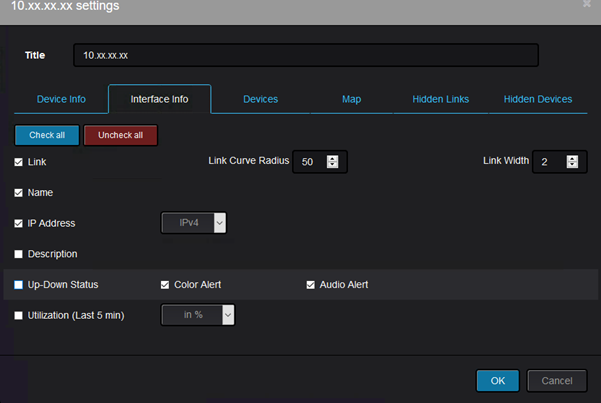
Click the Settings icon to open the “Settings” dialog box. Select the Wireless tab.
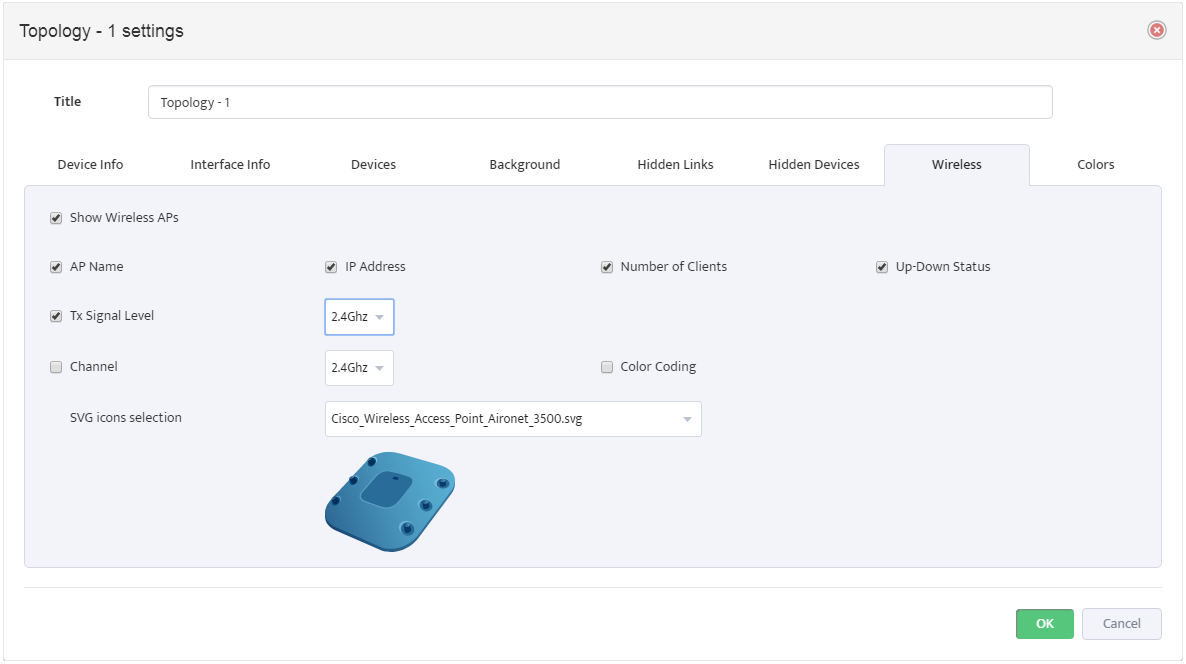
Check Show Wireless APs along with any other options you want displayed on the Heat Map. Nectus includes a large collection of Wireless AP icons you can use to customize the map.
Once you click OK the Heat Map reappears with a color-coded scale of signal levels.
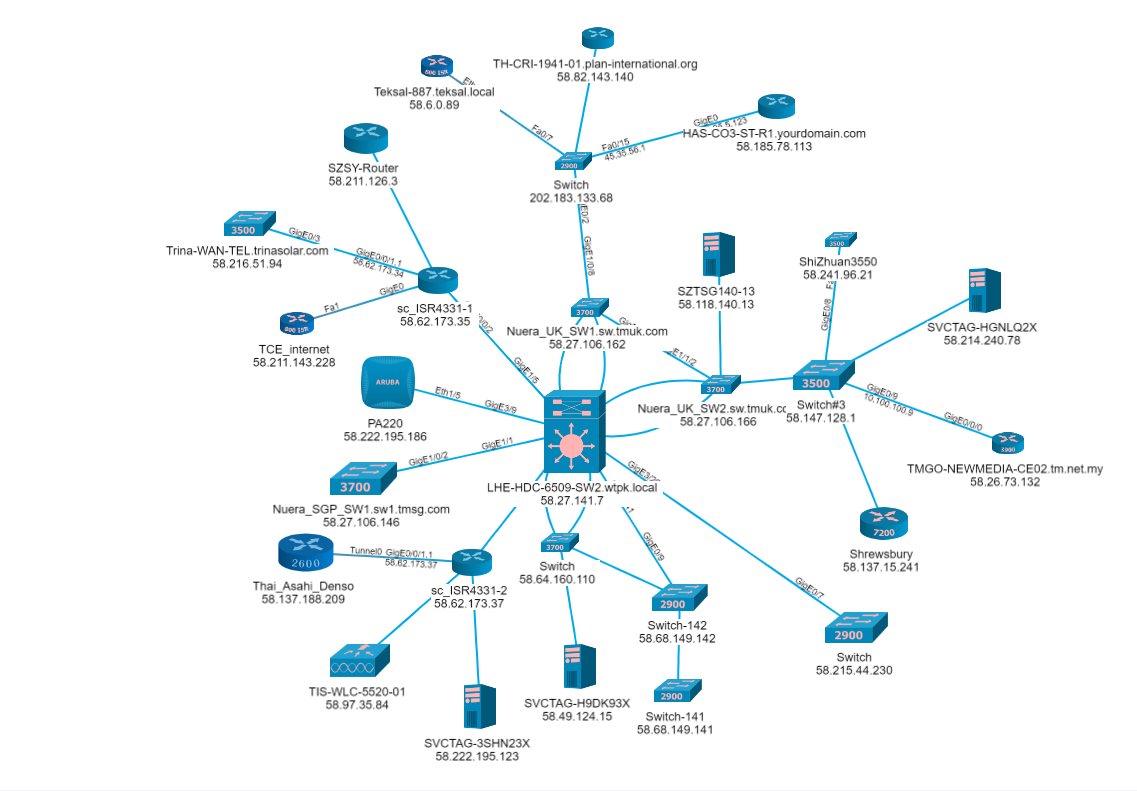
5. Expanding the Topology and Selecting Your Access Points
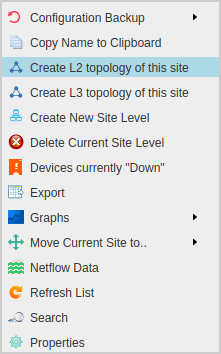
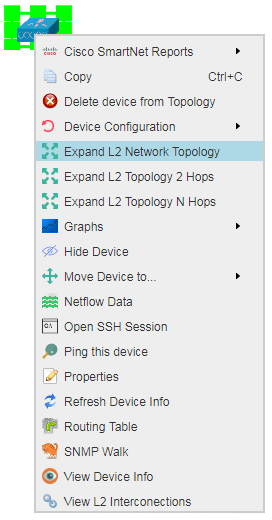
Now you need to expand the Topology. This displays the Wireless Access Points that are connected to the Wireless Controller. To expand the Topology, right-click the Wireless Controller icon and select Expand L2 Network Topology.
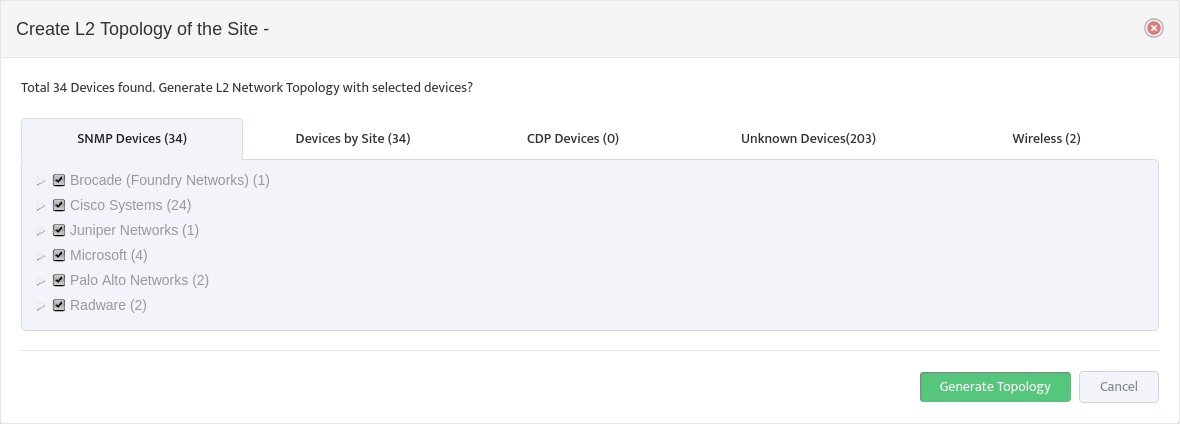
This opens the “Expand L2 Network Topology” dialog box. Select the Wireless tab and expand the All Wireless Controllers list to see the Wireless APs connected to the controllers in the Topology. Check the Wireless APs you want to include in the Heat Map.
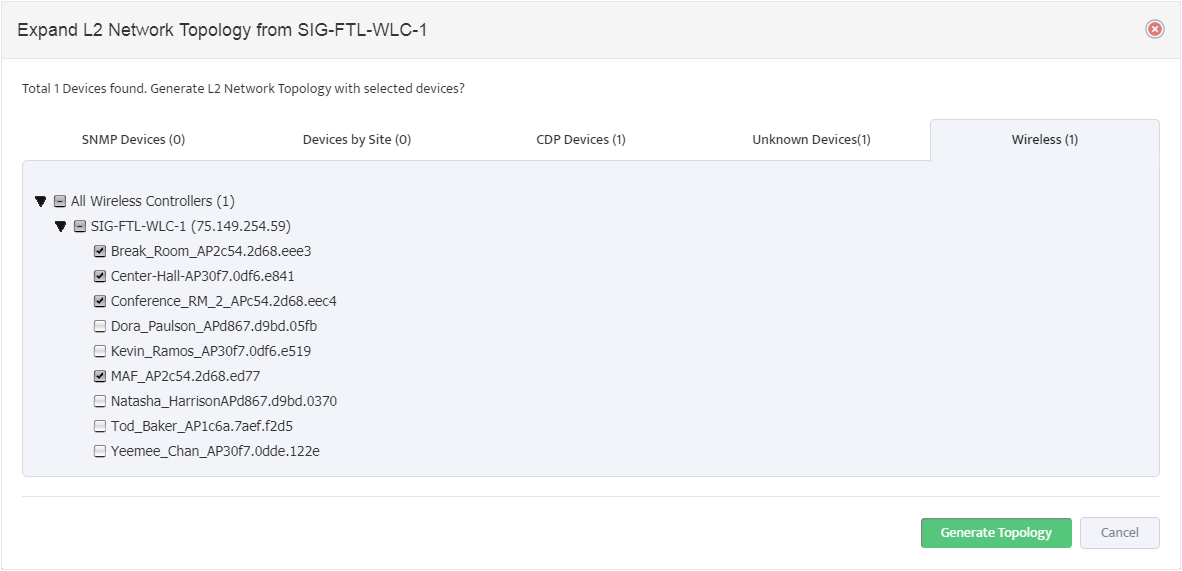
Click Generate Topology to add the selected Wireless APs to the Heat Map.
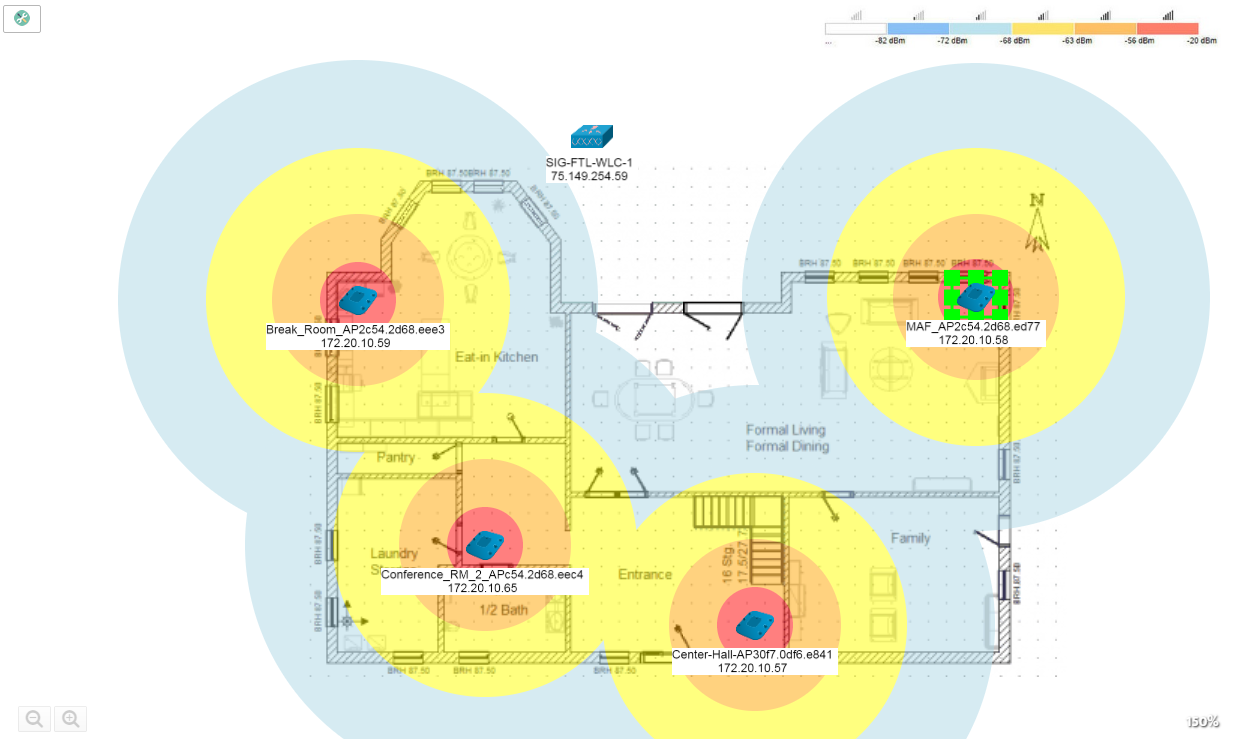
6. Positioning Wireless APs on the Heat Map
Drag each Wireless AP to its physical location on the Background Image. Once you do this, the Heat Map will show wireless coverage for this area.