Enabling Monitoring for SNMP devices
Enabling Monitoring for SNMP Devices
In this chapter, you’ll learn how to enable monitoring and create monitoring groups for SNMP Devices.
The specific topics we will cover in this chapter are:
- Automatic Discovery and Grouping of SNMP Devices
- Creating and Activating Monitoring Groups
- Creating and Customizing Monitoring Profiles
- Customizing Alerts
- Placing Devices in Monitoring Groups
1. Automatic Discovery and Grouping of SNMP Devices
Nectus automatically discovers all live SNMP Devices. These devices are listed in the SNMP Devices Panel on the Home Screen. While Devices are detected automatically, they are not automatically monitored. New SNMP Devices are automatically added to the default “No Monitoring” Group.
To Enable monitoring for a Device you need to move it from “No Monitoring” group to any
of the group where monitoring is enabled.
2. Creating and Activating Monitoring Groups
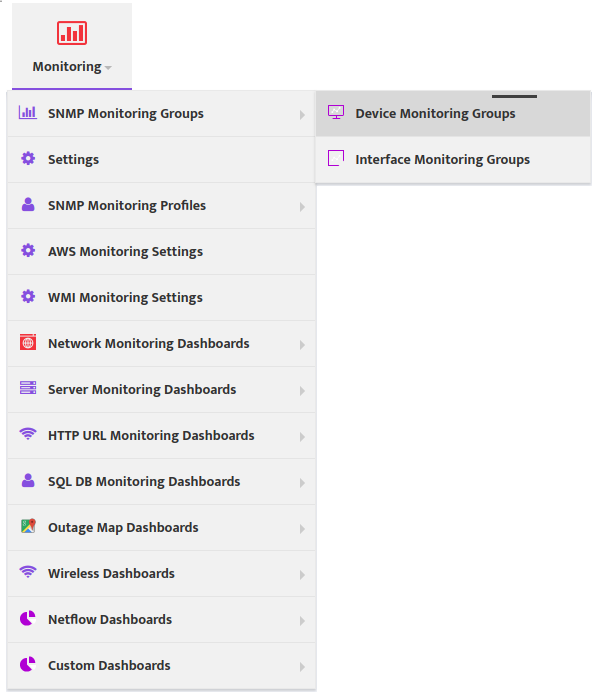
To create and activate SNMP Device Monitoring Groups go to the Nectus Home Screen and select Monitoring -> SNMP Monitoring Groups -> Device Monitoring Groups.
This opens the “Device Monitoring Groups” dialog.
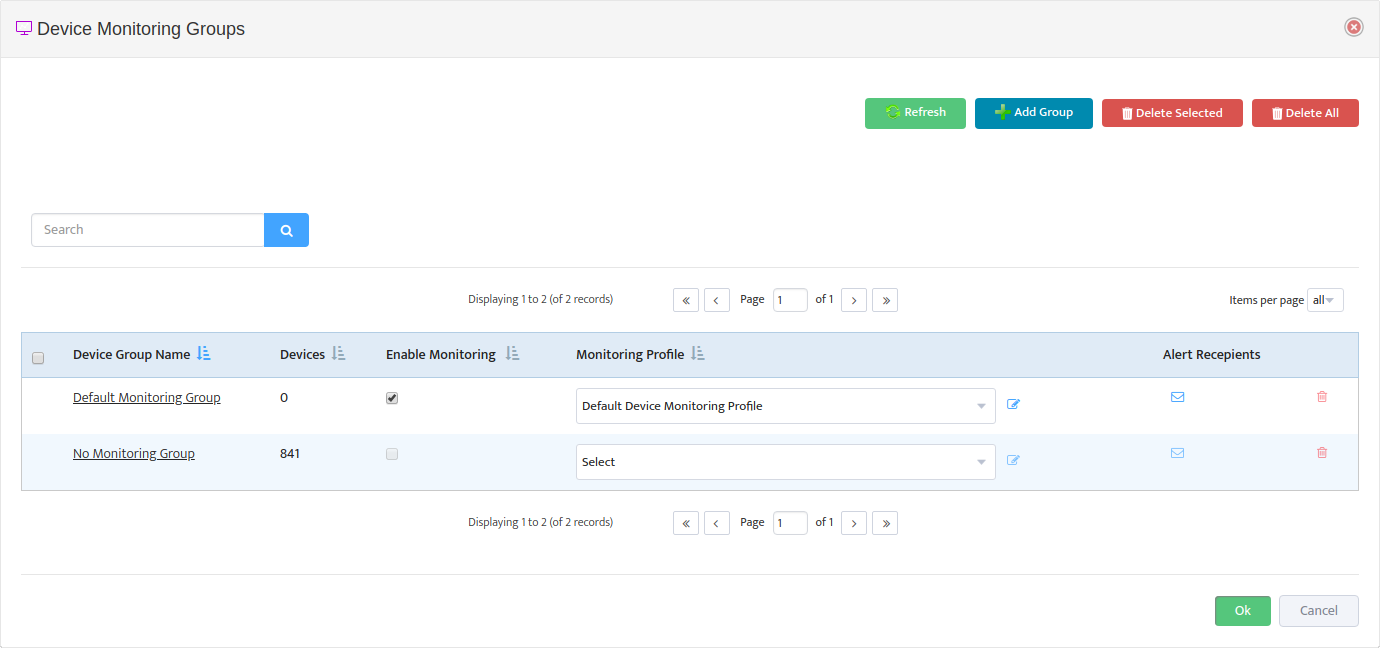
Nectus provides you with two predefined Monitoring Groups:
- No Monitoring Group – Devices in this group are not monitored, and appear with a grey icon in the SNMP Devices Panel.
- Default Monitoring Group – Devices in this group are monitored by Nectus. Their icons are either green or red, reflecting the state of the Device.
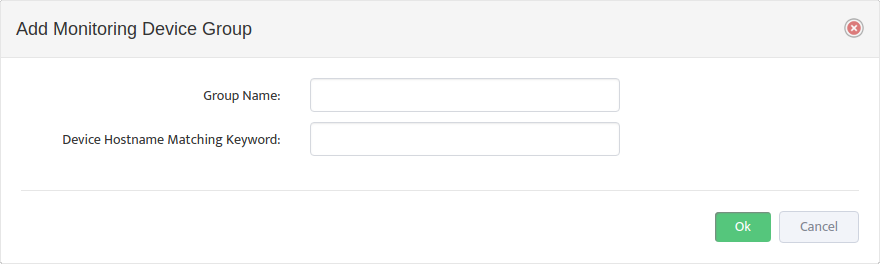
Click the Add Group button to open the Add Monitoring Device Group dialog and create an additional Monitoring Group.
To monitor a group, check its Enable Monitoring box in the Device Monitoring Groups dialog box.
Next select the Monitoring Profile you want to use for the Group. See the next section for more information on Monitoring Profiles.
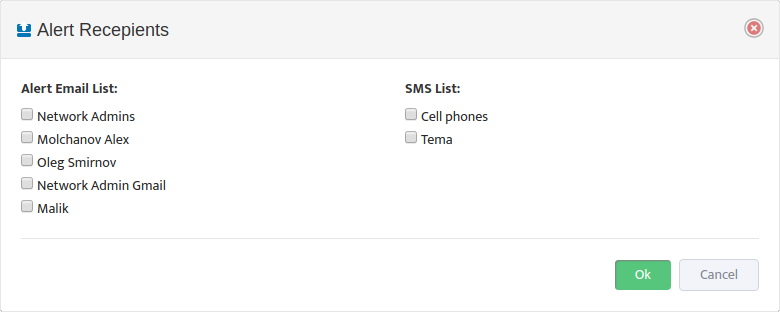
Next click the Edit Alert Recipients icon to open the Alert Recipients dialog box and select lists that specify who will receive alerts from this particular Monitoring Group and Profile.
3. Creating and Customizing Monitoring Profiles
Each Monitoring Group must have a Device Monitoring Profile that determines which parameters are monitored. You can customize this Profile, and create additional Profiles for each Monitoring Group.
To edit the default Profile or create a new one, click the Edit icon to the left of the Monitoring Profile for the Group. This opens the Edit Device Monitoring Profile dialog box.
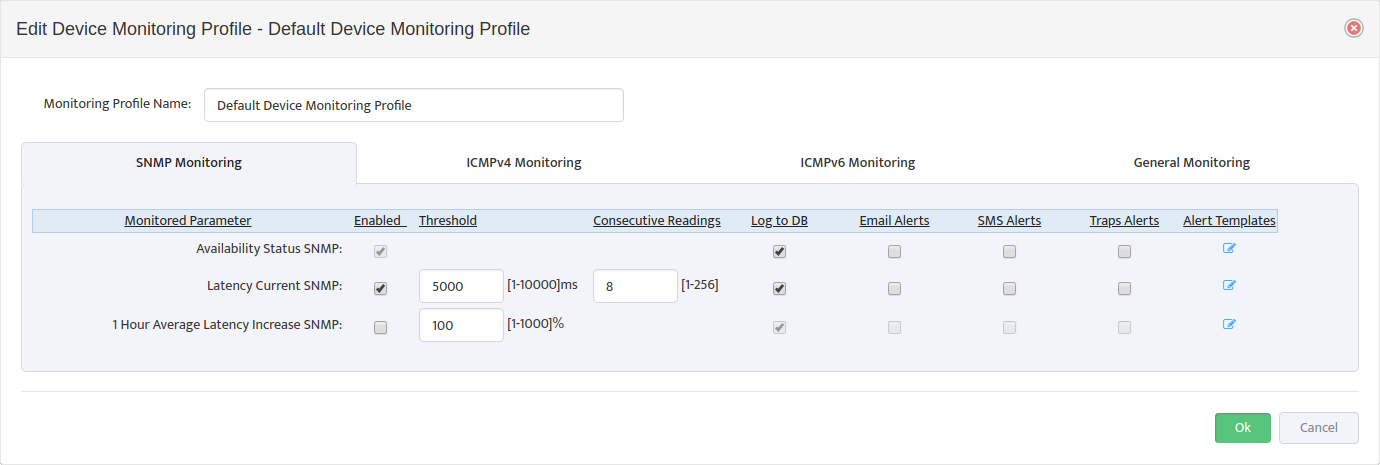
Each of the four tabs in this dialog contains parameters you can monitor. Many of the parameters allow you to set Threshold values or other customizations.
Set the Enabled checkbox next to each Parameter you want to monitor. Check any of the Log to DB, Email Alerts, SMS Alerts, or Traps Alerts boxes to send those types of alerts.
4. Customizing Alerts
To customize the alerts, click the Edit Alert Templates button to open the Edit Alert Handler dialog box.
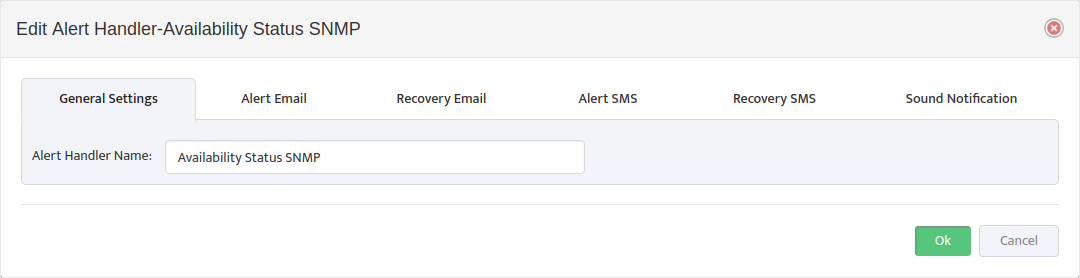
If you select Email Alerts or SMS Alerts, Nectus will generate Alert messages when the Parameter goes out of bounds and Recovery messages when the Parameter returns to normal.
Selecting the tab for one of these messages allows you to customize the appearance of that message.
5. Placing Devices in Monitoring Groups
Once you have created the Monitoring Groups you want to use you need to place Devices in them. To do so, click the Monitoring Group Name to open the Edit Monitoring Device Group dialog box.
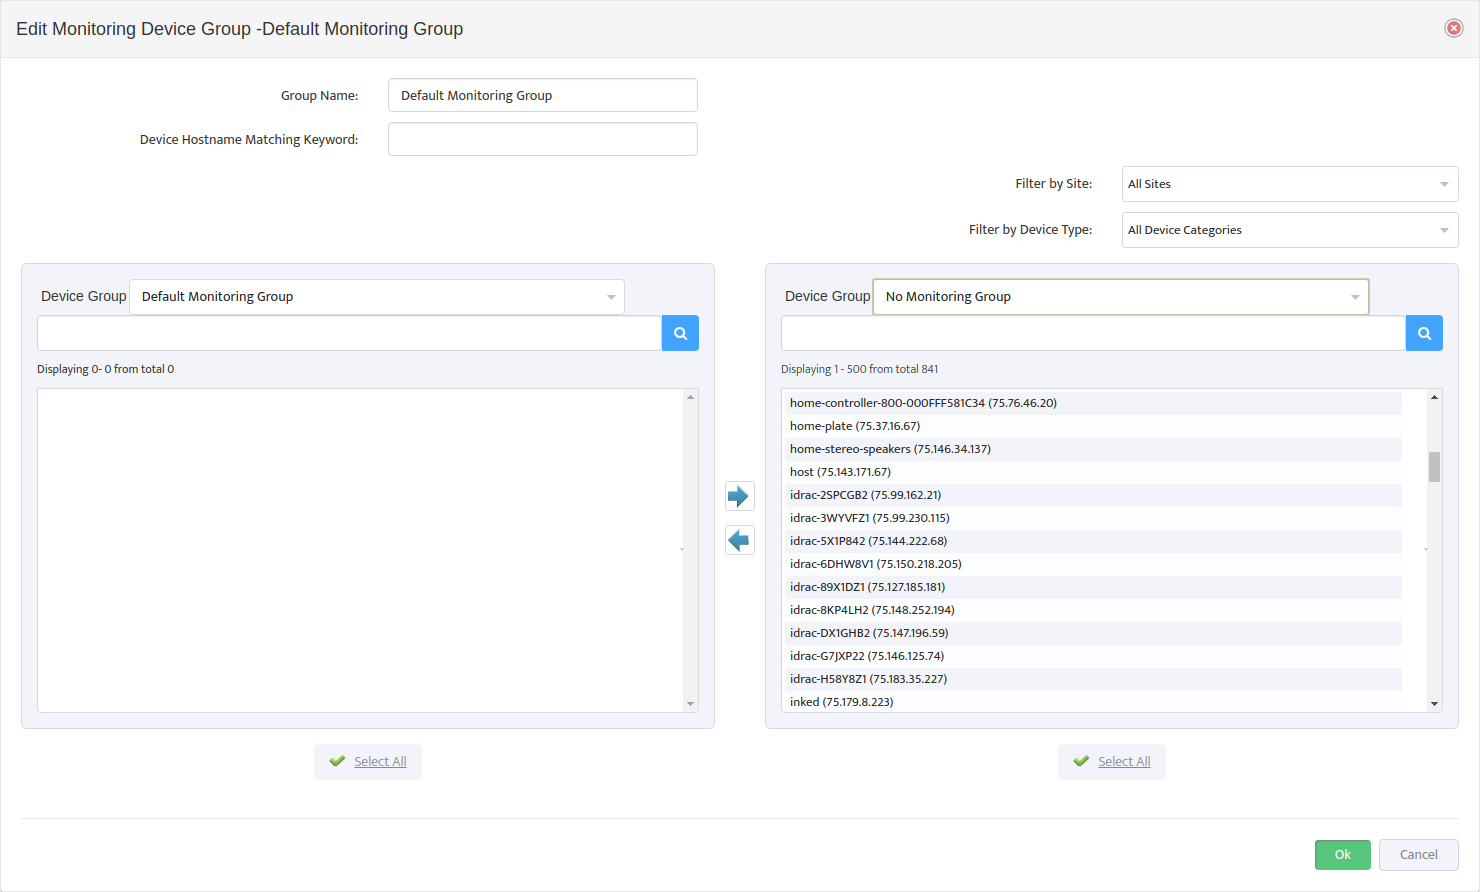
Select the Group you want to add Devices to on the left, and the Group you want to take them from on the right. Use the arrows to move Devices between the two Device Groups.
Note that if you move a Device that is currently being monitoring into the No Monitoring Group, Nectus will immediately stop monitoring that Device. This can be useful for situations where you know a device will be down for some time (extended maintenance, for example) and you don’t want the system to send alerts.