Nectus not impacted by Log4J (CVE-2021-44228) Vulnerability

Nectus doesn’t use Apache LOG4J in any of its modules and is not impacted by recent Log4J (CVE-2021-44228) vulnerability.


Features coming up in next Nectus release

  1. BGP sessions monitoring with UP/DOWN Alerting
  2. Linux Servers Monitoring (CPU, RAM,  Storage, Up/Down)

Tracking Objects in Wireless Networks

, ,

Troubleshooting of any wireless problems usually starts with determination of specific Access Point where client is currently associated with and tracking wireless client’s roaming behavior in time.

Access Point detection helps to understand current RSSI levels at given selected channel and presence of alternative AP at the client’s location.

Nectus provides basic tools that make locating and tracking wireless objects an easy task.

The specific topics we will cover in this chapter are:

  1. Using the Wireless Client Search Tool
  2. Using the Wireless Client Tracking Tool

1. Using the Wireless Client Search Tool

The Wireless Client Search tool shows you which access point (AP) a Wireless Client is connected to right now. To use Wireless Client Search go to the Nectus Home Screen and select Tools -> Wireless Tools -> Wireless Client Search.

This opens the “Wireless Client Search” dialog box.

Search for the wireless object by entering all or part of the Client MAC Address, IP Address, or Username. Set the Search Scope by checking any of the supported Wireless Controller types.

The search returns any matching objects in a table.

Click the MAC Address of the object to see all the Basic information the system has about that object.

Click the Client RSSI Info tab to see the RSSI (Received Signal Strength Indication) for every access point the object can detect.

2. Using the Wireless MAC Tracking Tool

The Wireless MAC Tracking tool is useful for troubleshooting intermittent problems. It uses the object’s MAC address to record which AP the object is connected to over a period of time. To use Wireless Client Search go to the Nectus Home Screen and select Tools -> Wireless Tools -> Wireless MAC Tracking.

This opens the “Wireless MAC Tracking” dialog box.

Click Add to begin tracking a MAC Address.

Enter the MAC Address you want to track, the Controller type, the Frequency of recording data, and the Duration of time you want to track the MAC address.

Once the Duration is complete, you can see the results by clicking the View MAC Tracking icon.


Silicon Valley in 1992

Silicon Valley

Nectus Partner Program

We are very happy to announce the launch of our Nectus Partner Program.

We are inviting all Professional Services Organizations and Independent consultants to become an Integration Partner for the best Network Monitoring Solution of 2018 and take advantage of enormous commissions that we offer to all of our Nectus Partners.

Please contact sales@nectus5.com for additional details.

Nectus Feature List

,


Nectus Feature List (October 2018)

  1. Network Discovery
  2. Basic SNMP Network Monitoring
  3. Basic SNMP Device Monitoring (CPU, RAM, TCAM, Up/Down)
  4. Basic SNMP Interface Monitoring (Errors, Dropped Packets, Traffic Volume, Utilization, Up/Down)
  5. Real Time Network Topology Visualization
  6. Windows Server Monitoring (CPU, RAM, Disk, Network, Services, Processes, Status, Up/Down)
  7. AWS Instance Monitoring and Backup (CPU, RAM, Disk, Network, Up/Down Status)
  8. MSSQL Database Monitoring
  9. HTTP URL Monitoring (Latency, Up/Down Status)
  10. Network Device Configuration Backup and Change Tracking
  11. Network Device Configuration Change Automation
  12. NetFlow Collector
  13. Syslog Collector
  14. Cisco SmartNet Status Reporting
  15. Wireless Monitoring and HeatMap Visualization
  16. CircuitDB (Database of All Telco Circuits)
  17. Network Engineer Toolset (Visual Ping, SNMP Walk, L3 Path Discovery, SSH Client)
  18. Best Practice Audits and Reports
  19. Top 100 Reports
  20. Operational Reports
  21. Email and Text Message based Alerting
  22. Custom Dashboards
  23. Google Map Outage Visualization

Many more coming in 2019 ..  !!!

Network Redundancy Visualization (Pure Art)

, ,

Another piece of art generated by Nectus with a help of D3.JS library. Discovery of small Datacenter was completed under 3 minutes and topology generated under 5 seconds.

Conversion to Visio is supported in Nectus starting  from 1.2.40.

Real-time Device and Link status is overlayed in this  topology making it suitable for NOC level monitoring.

Keeping Track of Your Telco Circuits

, ,

Keeping Track of Telco Circuits

Remember that awkward moment when you discovered that you still paying for the circuit that suppose to be decommed 2 years ago?

I do.

Keeping track of the Telco circuit is important on many levels: financial and technical.

Having Circuit ID ready and knowing where to call when circuit goes down can make a difference between 6-hour outage and 30 minutes.

Keeping track of all the contracts for each circuit is also important for managing your budget. Beyond that, the end of a contract offers you the opportunity to negotiate better contract terms for that circuit in the future.

A typical IT organization can lease dozens, sometimes hundreds or even thousands of circuits from external providers. Whether Internet circuits, Dark-Fiber, MPLS circuits, Telephone circuits, each circuit has a lot of information associated with it.

Nectus includes a built-in database, called CircuitDB, to help you keep track of all the information related to all your circuits. This database can give you both a high-level view and a detailed view for every circuit.

Getting a High-Level View of Your Circuits

The high-level view of your circuits shows the basic information about each end of a circuit. When you open CircuitDB you get a table showing this high-level view for every circuit you have added to CircuitDB.

Opening CircuitDB

To open CircuitDB go to the Nectus Home Screen open Tools and click CircuitDB.

One thing to notice here is that Nectus shows the Up or Down status of a circuit in real time. This is indicated by the red or green icon to the left of Interface A.

If you have a lot of circuits in the database, you can search for a specific circuit by name or ID, or filter the table by Site, Carrier, Circuit Type, or Circuit Status.

High-Level Fields in CircuitDB

The high-level fields in CircuitDB are:

  • Site A – One of the sites that the circuit connects.
  • Device A – The router that the circuit connects to at Site A.
  • Interface A – The name of the circuit interface at Site A.
  • Site B – The other site that the circuit connects.
  • Device B – The router that the circuit connects to at Site B.
  • Interface B – The name of the circuit interface at Site B.
  • Carrier – The name of the outside provider for the circuit.
  • Circuit ID – The ID of the circuit. Provided to you by the Carrier.

Getting a Detailed View of Your Circuits

To get all the details about a particular circuit, click the Edit CircuitDB icon to the right of the Circuit ID. This opens the Update CircuitDB dialog.

Full Set of Fields for a Single Circuit

Here is the full set of fields for a single circuit. It is divided into two sections.

The first section deals with the physical connections of the Circuit and is duplicated for End Point A and End Point B:

  • Site – The name of the site where this endpoint is located.
  • Room – The name or number of the room where the circuit connects.
  • Cage, Cabinet, Rack – User-defined fields dependent on the physical setup of the Site.
  • Patch Panel – The name or number of the point where the circuit terminates at the Site.
  • Device – A Device selected from those listed in the Nectus Device database.
  • Interface – An interface selected from those supported by the Device.
  • Media – Copper or Fiber.
  • Fiber Type – Single-Mode or Multi-Mode.
  • Media Connector – RJ45, LC, SC, MTP.

The second section deals with the contract for the Circuit:

  • Carrier – The name of the external provider for the Circuit.
  • Circuit Type – User-defined name for the type of Circuit.
  • Circuit Status – Decommissioned, Testing, In Production.
  • Circuit Media Speed – Maximum speed of the media in Kbps, Mbps, Gbps.
  • Circuit CIR – Committed Information Rate in Kbps, Mbps, Gbps.
  • Circuit ID – Carrier-defined ID of the Circuit.
  • Contact Info – Name of the Carrier salesperson or other contact.
  • Contract Start & Contract End – Starting and ending dates of Circuit contract.
  • Support Email – Email of support staff at Carrier.
  • PO – Purchase Order number of this Circuit.
  • Price – Price for this contract.
  • Phone – Telephone number of contact at Carrier.
  • Comments – Comments related to this particular Circuit.

Dark or Light? Heated Debate over Dashboard Color Theme

,


Loading poll ...

Generating Site Network Topology in Nectus

, ,

Visualizing Network Topology

In this chapter, you’ll learn how to generate a map of the L2 Topology for your site. An L2 Topology shows the physical connections between devices, which can be extremely useful for maintenance and troubleshooting. The topology can display real-time up/down status information along with other relevant information about the site.

The specific topics we will cover in this chapter are:

  1. Generating an L2 Topology
  2. Manipulating the L2 Topology
  3. Changing L2 Topology Settings

Generating an L2 Topology

You can generate an L2 Topology for any site in just a few steps. The devices that appear in this topology are those that were found during the nightly site discovery operation.

1.1 Generate the L2 Topology

Follow these steps to generate the L2 Topology for a site:

  1. In the Sites Panel on the Nectus Home Screen, open Sites and right-click the Site you want to work on.

  1. Click Create L2 topology of this site to open the Generate Topology dialog.

  1. Select the devices you want to appear in the topology then click Generate Topology. After a moment Nectus displays the site’s L2 Topology.

Manipulating the L2 Topology

The L2 Topology displays the physical connections between the devices at the site, along with information about those connections. You can drag the entire Topology around the window, as well as drag and resize individual devices.

Open the Topology toolbar in the top left of the window for the additional options shown here:

Changing L2 Topology Settings

Click Settings in the L2 Topology window to open the Settings dialog and customize the information that appears in the Topology.

Assign the Topology a Title if you plan to reuse it.

In the Device Info tab, check Up-Down Status and the type of alert (Color Alert, Audio Alert) for real-time alerts when a device in the Topology is down. With Color Alerts, both the device that is down, and the title of the Topology will flash red as shown in the Topology image above.

Be sure to click the Save icon in the Topology Toolbar to save your changes.

AWS Backup Automation with Nectus

, ,

AWS Instance Backup Automation with Nectus

Having your data backed up and secured is crucial for business-critical systems. If your servers run in AWS infrastructure,

then you already have an advantage of performing backup of the hosted instances using Amazon built-in features.

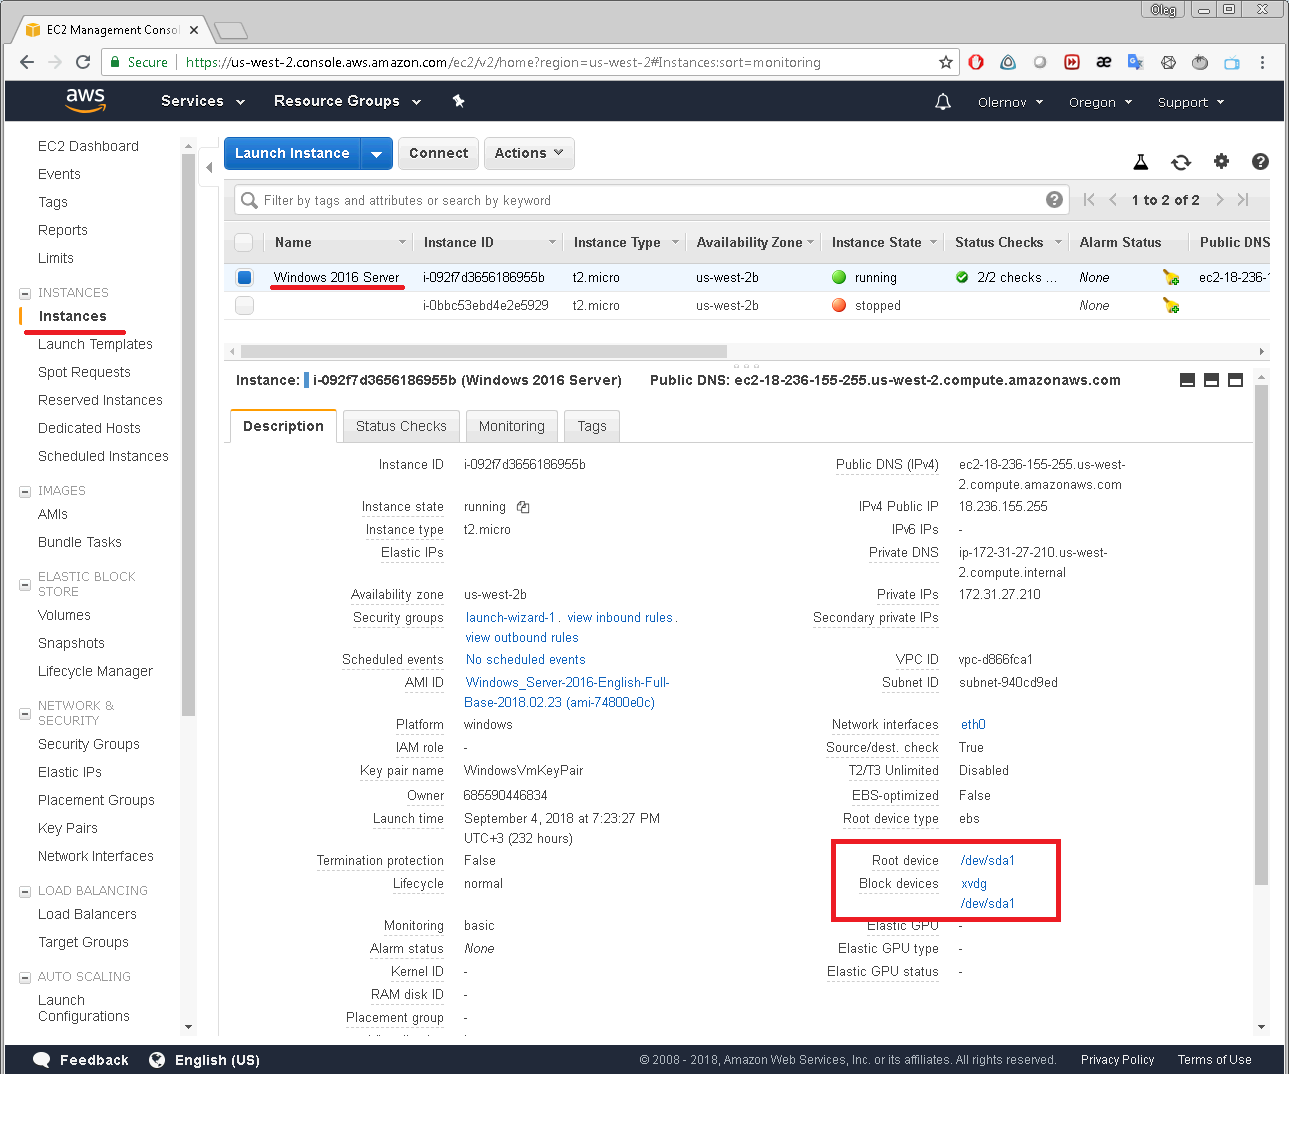
This can be performed manually using AWS console the following way. First, select Instances menu from EC2 Dashboard.

Then select an instance you would like to backup.

In Description tab you will see the Block devices attached to the selected instance.

Clicking on one of the block devices will bring up the window displaying the block device’s EBS ID:

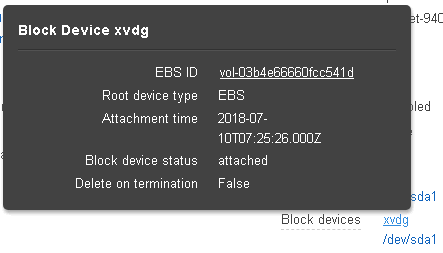
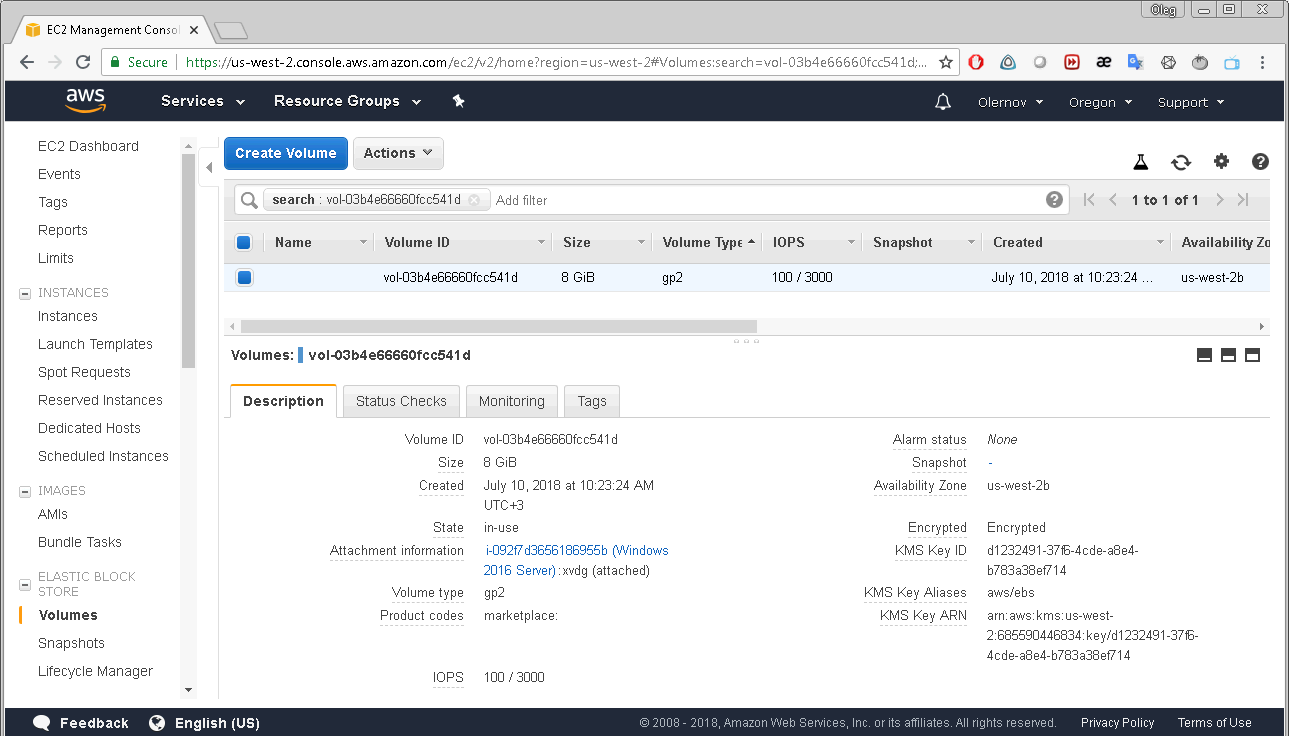
By clicking that EBS ID you get to the Volumes menu of the EC2 Dashboard:

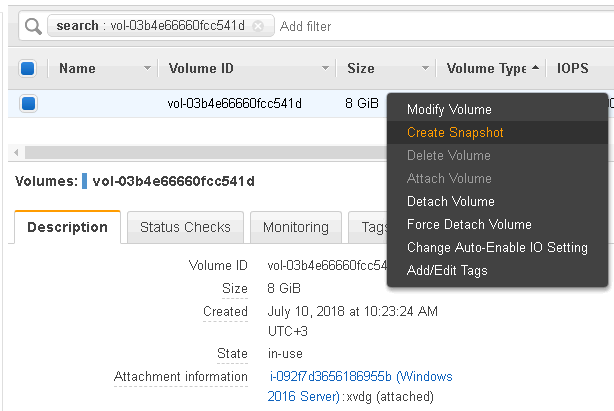
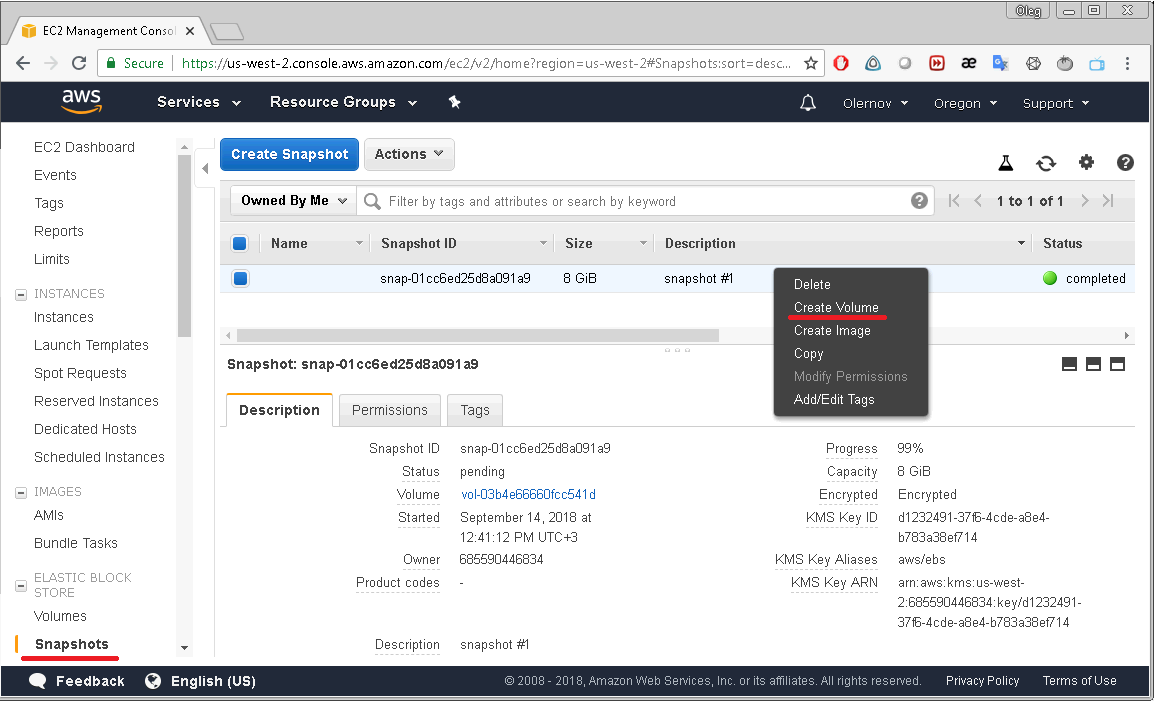
Right-click on the selected volume will display a menu with “Create snapshot” option.

After selecting this option you have to enter a description of your snapshot and the snapshot will be created.

After that the snapshot created will appear on the list displayed on the EC2 Dashboard/Snapshots page. To restore data from that snapshot you should select

“Create Volume” option from the snapshot’s context-menu. A new volume will appear with exactly the same data you had on your volume when snapshot was created.

But taking snapshots manually is hardly an option, especially if you deal with a lot of the EC2 instances. This process must be automated.

One of possible solutions is utilizing the Nectus AWS backup functionality. Nectus is able to take snapshots of your volumes constantly and

regularly with the required periodicity according to the backup profiles you set.

The following steps will show how to enable and set up the automated backup of AWS instances using Nectus. First you need to set up your backup profiles.

Select Settings/General Settings/AWS Integration menu.

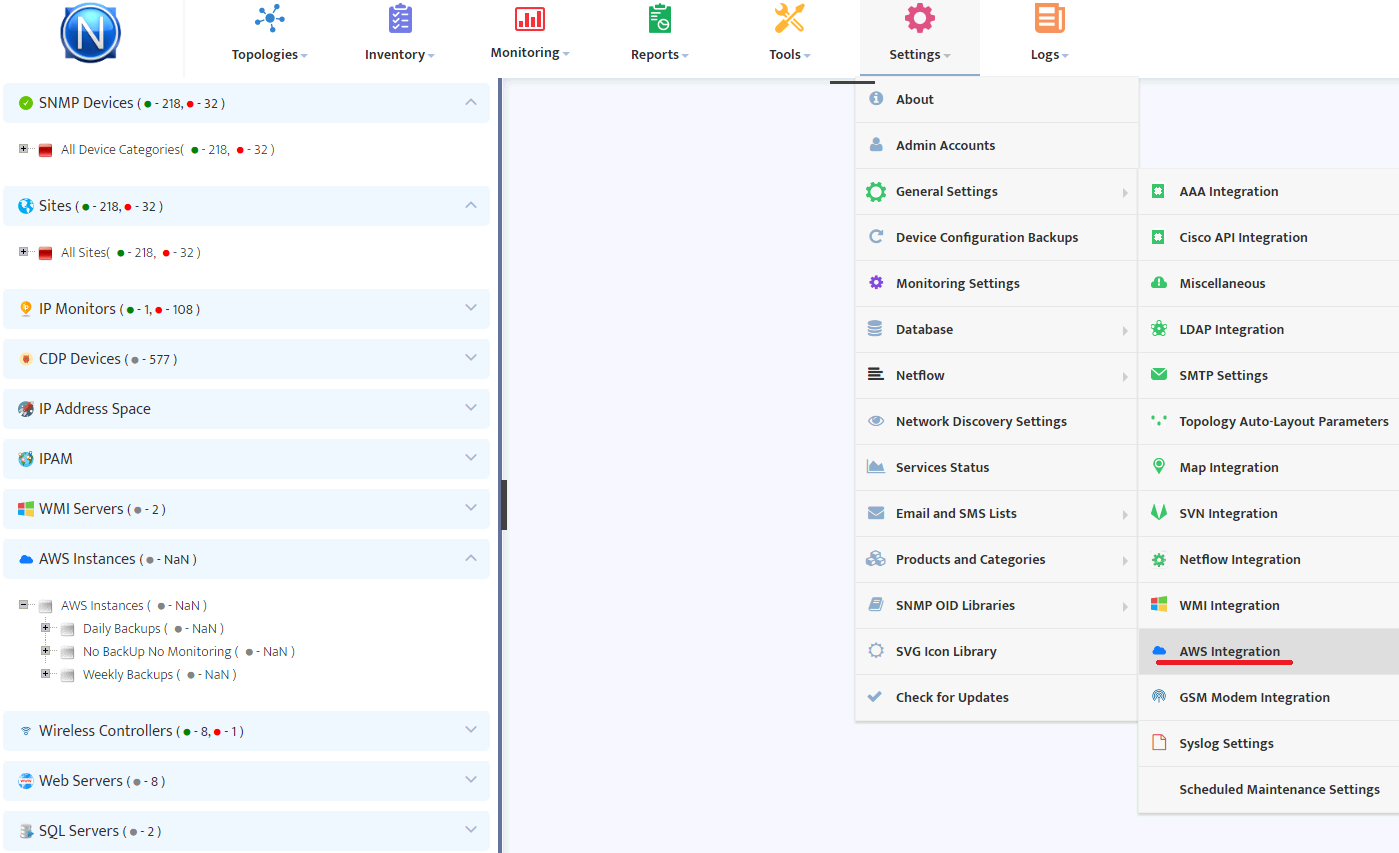
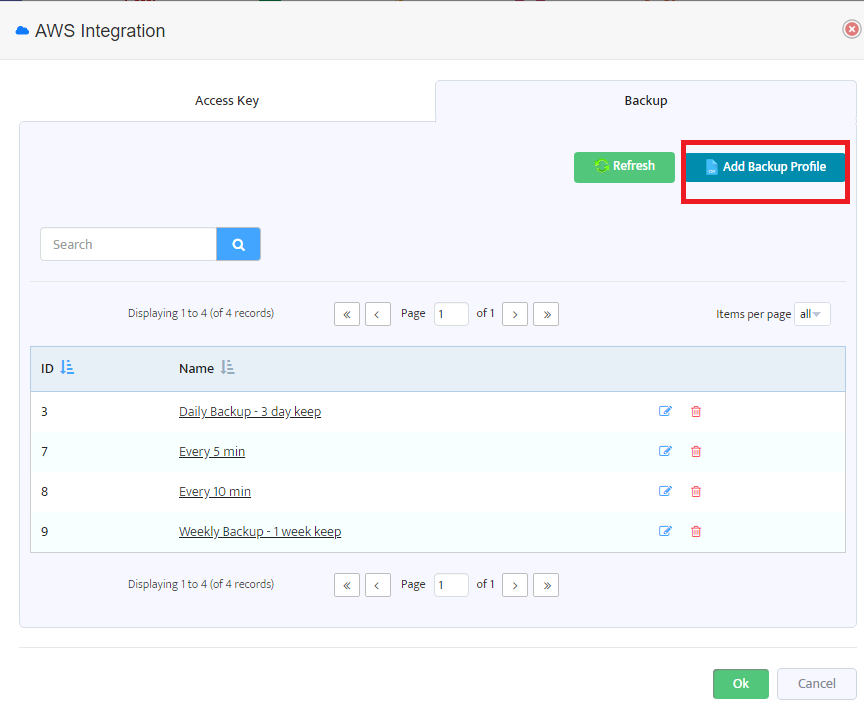
In the “Backup” tab you will see backup profiles already created and also the “Add Backup Profile” button.

Pressing this button will open the following “Add New AWS Backup Profile” dialog.

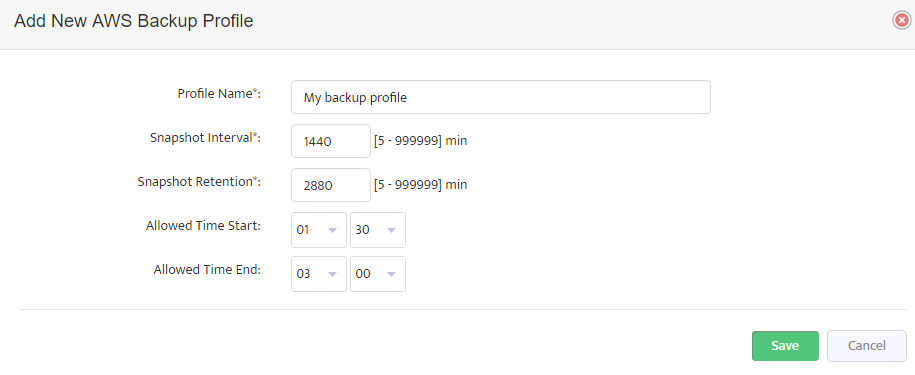
Here you can enter a name for a new backup profile, periodicity of snapshots creation (Snapshot Interval), period of retention for snapshots created (Snapshot retention)

and the allowed time interval to take snapshots (this setting is available only if Snapshot Interval is 1440 minutes or more).

Pressing “Save” button will add the new backup profile to the list. Editing of existing profiles is also possible.

You can create any number of backup profiles for different purposes.

For example, you may want to backup your most critical production instances quite often (every 5 minutes) but your test servers rarely (once a day or maybe even once a week).

The procedure of taking a snapshot is free of charge from Amazon but storing them is charged depending on the volume (see AWS EC2 pricing).

That should be considered when choosing the Snapshot retention period.

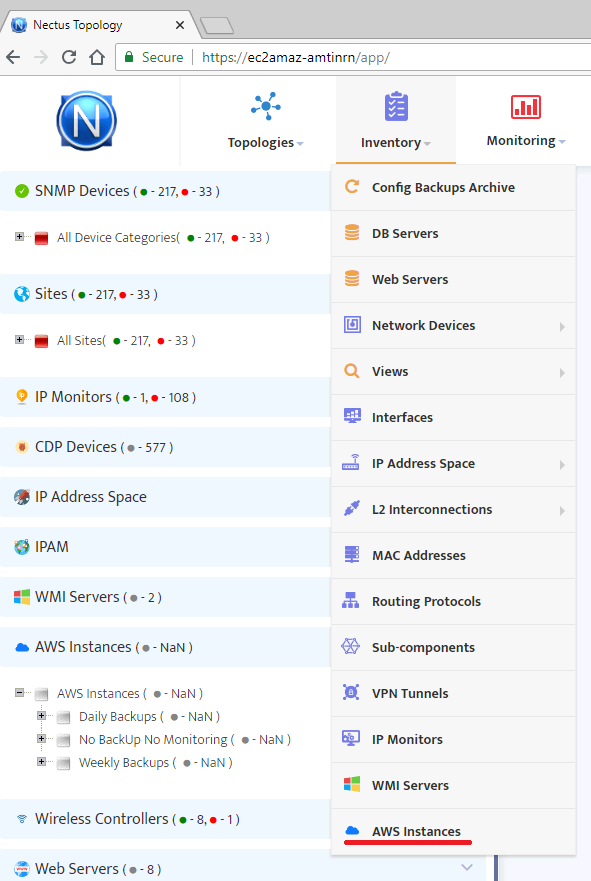
After you have set the required backup profiles, it is time to assign them to your instances. To perform it select “AWS Instances” from the “Inventory” menu.

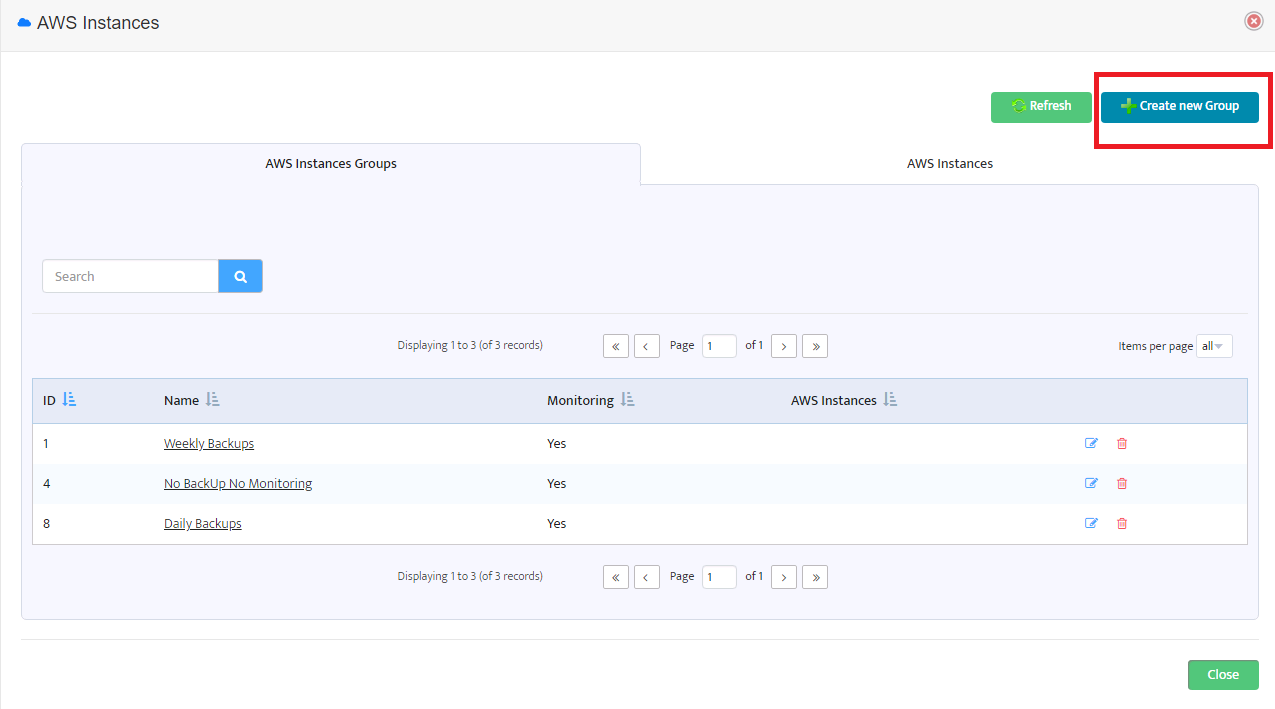
In the form displayed you can see a list of already existing instance groups. To create a new AWS instance group press the button “Create new Group” at the top-right of the form.

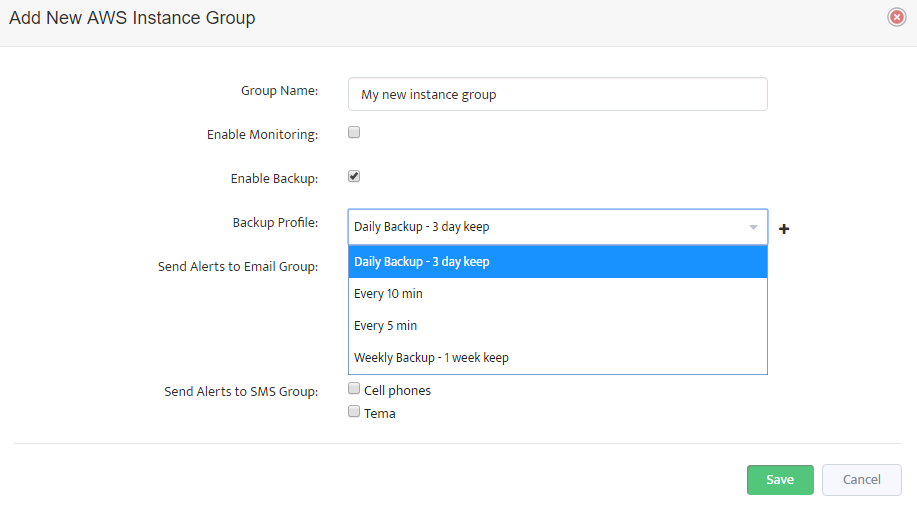
In the window opened you should set a new group name, check the “Enable Backup” box and choose one of the backup profiles created earlier.

If the box is not checked, then no backups will be performed for instances of this group.

Now when you have backup profiles assigned to AWS instance groups you can switch to the next tab “AWS Instances”.

The next window displays a list of AWS instances.

Each instance belongs to one of the AWS instance groups and so the group settings affect the instance backup policy.

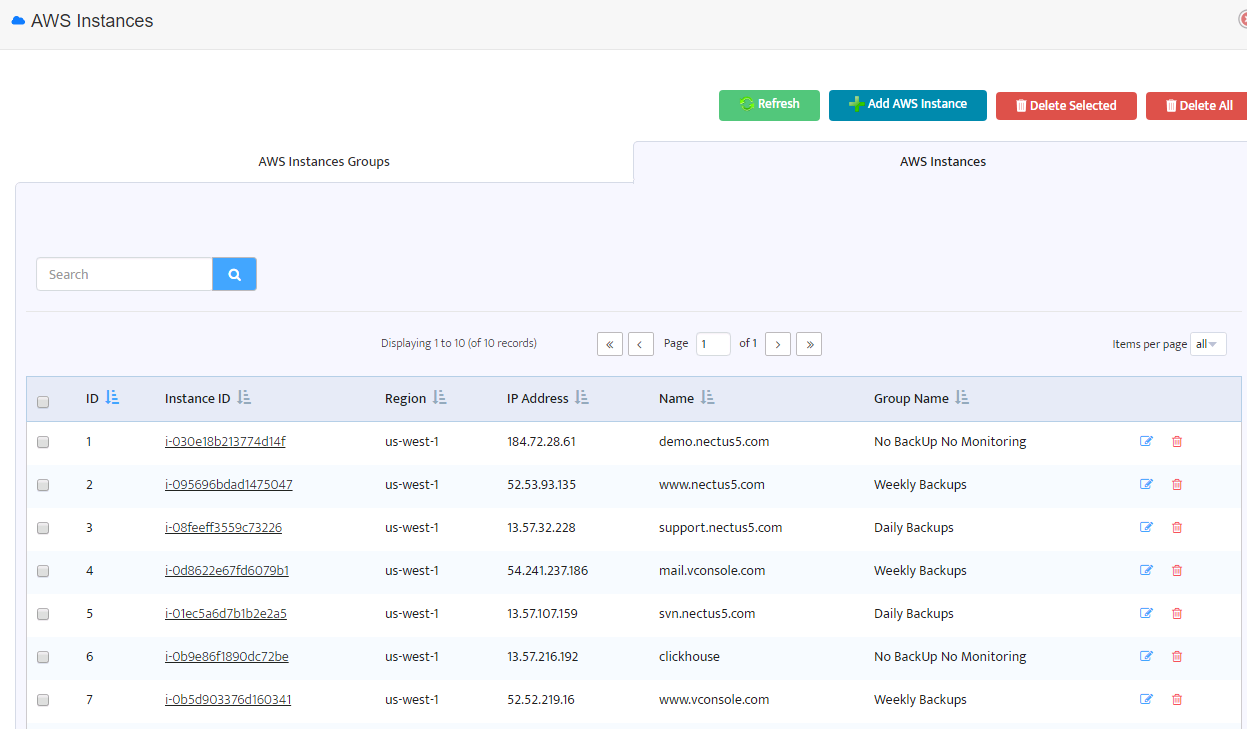
To change backup profile for an instance you should move it to another instance group with appropriate backup profile.

For example, if you want to change backup profile for “www.nectus5.com” from “Weekly Backups” to “Daily Backups”

just click on the Instance ID and change AWS instance group.

After such setup Nectus will automatically start creating new snapshots and deleting old ones.

You will see those snapshots in your EC2 Dashboard.

Creating custom Dashboards in Nectus

, ,

Creating Custom Dashboards

In this chapter, you’ll learn how to create Custom Dashboards. Nectus lets you create an unlimited number of Custom Dashboards, making it easy to focus on exactly the information you need at any time.

This chapter covers how to:

  1. Create a New Custom Dashboard
  2. Add Widgets
  3. Manage Widgets
  4. Manage Dashboards
  5. Available Widgets by Category

1. Create a New Custom Dashboard

You create and configure Custom Dashboards using the Dashboard Widgets dialog box.

  1. To create a new Custom Dashboard, go to the Nectus Top Menu then navigate to: Monitoring -> Custom Dashboards -> Manage Custom Dashboards and click the Add Dashboard button.

  1. Enter a Title for the Dashboard then add widgets to it as described in Section 2.

2. Add Widgets

The Dashboard Widgets dialog includes all the available Widgets grouped by Category. You can enable any number of Widgets from any number of Categories in the Dashboard.

Many Widgets have settings you can enter when you add them to the Dashboard. They may also have additional settings you configure once the Widget is live in the Dashboard. See the next section for more details.

3. Manage Widgets

Once a Widget is live in a Dashboard, you can drag it, resize it, or remove it.

You can customize any Widget by clicking its Settings icon. Most Widgets have a Style setting you can configure. Some Widgets also have Views. Views filter the information that appears in the Widget.

In the following example, the View filters the High Utilization Interfaces Widget so only interfaces that have had utilization levels of 70% of above in the last hour appear.

To keep any changes you make to widgets, click the Dashboard’s Save icon.

4. Manage Dashboards

You manage a Dashboard by clicking the Dashboard’s Settings icon to open the Dashboard Widgets dialog box. You can change the Title, as well as add or remove Widgets.

To keep any changes you make to the Dashboard, click the Save icon.

To make this Dashboard the default, click the Open by Default icon.

5. Available Widgets by Category

Nectus gives you over 60 Widgets, divided into over a dozen Categories. This section lists the Categories and the Widgets in each Category.

5.1 Device Widgets

  • Device Outages
  • Devices Down
  • High CPU Devices (Ave. CPU > 90%)
  • Low RAM Devices

5.2 Interface Widgets

  • High Utilization Interfaces
  • Interface Outages
  • Interfaces Down
  • Top 5 Interfaces by Dropped Packets
  • Top 5 Interfaces by Errors
  • Top 5 Interfaces by Utilization
  • Traffic Volume

5.3 SQL DB Widgets

  • Resource Pool Stats
    • Avg Disk Read/Write IO (ms)
    • CPU Usage
    • Disk Read/Write Bytes/sec
    • Disk Read/Write IO/sec
  • Memory Manager Metrics
    • Memory Grants Pending
    • Target-Total Memory
  • Buffer Manager
    • Buffer cache hit ratio
    • Lazy write/sec
    • Page life expectancy
    • Page lookups/sec
    • Page reads/writes sec
  • Databases
    • Active Transactions
    • DB Data/Log size
    • Log Flushes/sec
    • Percent Log Used
    • Running Query count
    • Transactions/sec
    • Write Transactions/sec
  • SQL Errors
    • Errors/sec
  • SQL Statistics
    • Batch Requests/sec
    • SQL Compilations/Re-Compilations sec
  • Services
    • Server Services
  • Sessions and Connections
    • Connections
    • Sessions

Locks (Total)

    • Average Wait Time (ms)
    • Lock Requests/sec
    • Lock Waits/sec
    • Number of Deadlocks/sec
  • Agent Jobs
    • Agent Jobs

5.4 Syslog Widgets

  • Major Syslog Events
  • Syslog (Severity 1-3)

5.5 Wireless Widgets

  • Wireless AP Client Load
  • Wireless Controllers
  • Wireless SSID Client Load
  • Wireless Total Clients

5.6 HTTP Widgets

  • HTTP URL Health

5.7 Server Health Widgets

  • Server Health (SNMP)
  • Server Health (WMI)

5.8 Custom Graphs Widgets

  • Custom Graph 1-10

5.9 Outage Map Widgets

  • Outage Map 1-10

5.10 Netflow Widgets

  • Top 5 Applications
  • Top 5 Protocols
  • Top 5 Sources
  • Top 5 Destinations

5.11 Call Manager

  • Call Manager Health

5.12 AWS

  • AWS CPU
  • AWS Disk
  • AWS Network
  • AWS Status

5.13 Others

  • Maintenance Schedule
  • Network Uptime

WHICH US CITY USES THE MOST IPV4 PUBLIC ADDRESSES?

,

https://www.nectus5.com/wp/wp-content/uploads/2018/01/Map_USA-01-1500x630.png

Note: Information is based on Nectus IP geo-location service

State City IPv4 Addresses
Ohio Columbus 225326103
California Los Angeles 54776440
Arizona Fort Huachuca 54644594
Texas Houston 42689210
District of Columbia Washington 32721834
New York New York City 31867103
Virginia Ashburn 31828300
Indiana Indianapolis 26421929
Georgia Atlanta 25527566
California Palo Alto 25105708
Washington Redmond 24885468
Michigan Dearborn 23705811
North Carolina Durham 21588969
New Jersey Newark 21491795
California San Diego 21485402
Illinois Chicago 20074587
North Carolina Raleigh 18955414
New Jersey Bedminster 17843408
Texas Richardson 17241943
Texas Dallas 16869204
Massachusetts Cambridge 15868348
California San Jose 15336783
Washington Seattle 15260827
Alabama Montgomery 14906638
California Cupertino 13954110
Washington Bellevue 13800919
Connecticut Fairfield 13507953
California San Francisco 12561267
Pennsylvania Philadelphia 12464449
Virginia Reston 11731922
Florida Lake Mary 10572081
New Jersey Mount Laurel 10087552
Colorado Denver 9869523
Missouri Saint Louis 9426794
California Norwalk 9273764
Virginia Virginia Beach 9107341
Michigan Ann Arbor 8772940
California Mountain View 8474238
Connecticut Middletown 8241397
Texas San Antonio 7877211
Texas Austin 7734993
Arizona Phoenix 7649529
Oregon Portland 7600141
New Jersey Rahway 7312241
Florida Miami 6713810
Ohio Cincinnati 6688810
California Concord 6607183
Virginia Dulles 6470388
Missouri Town and Country 5898488
Massachusetts Boston 5557232
Louisiana Monroe 5300043
Colorado Greenwood Village 5070591
Pennsylvania Pittsburgh 4780729
Missouri Kansas City 4578123
Virginia Herndon 4492530
Michigan Detroit 4336217
Pennsylvania Doylestown 4203957
North Carolina Charlotte 4085710
Tennessee Nashville 3916537
Georgia Duluth 3805720
Nevada Las Vegas 3792683
Illinois Naperville 3716723
Florida Orlando 3665033
California Sacramento 3601243
Utah Salt Lake City 3592200
Alabama Redstone Arsenal 3428226
Minnesota Minneapolis 3412363
Florida Tampa 3400441
New Jersey Morristown 3304100
California Santa Clara 3252933
New York Rochester 3189712
Maryland Baltimore 3079657
Minnesota Saint Paul 3019512
Arizona Kingman 2983075
Massachusetts Springfield 2927039
Wisconsin Milwaukee 2811053
Colorado Fort Collins 2752782
Wisconsin Madison 2732615
California Belmont 2725536
Texas Plano 2671935
Virginia Arlington 2668836
Connecticut Stamford 2609471
Ohio Cleveland 2600011
Kansas Overland Park 2528866
Texas Irving 2512563
Kentucky Richmond 2509411
Texas Fort Worth 2494944
Arkansas Little Rock 2446145
Florida Jacksonville 2423627
Missouri Columbia 2266295
Oregon Beaverton 2224613
New York Buffalo 2210272
California San Ramon 2131203
Ohio Akron 2098568
California Pleasanton 2097585
Maryland Rockville 2072266
California San Mateo 2044008
Nebraska Omaha 2020147
New York Albany 2018827


Creating Network Outage Dashboards in Nectus with GoogleMaps

, ,

Create an Outage Map

In this chapter, you’ll learn how to create and use Outage Maps. An Outage Map is a graphical representation of the status of the Sites in your organization. Using real world maps and GPS coordinates, an Outage Map instantly shows you outages for any of your Sites in any region of the world.

This chapter covers how to:

  1. Obtain and Configure a Google Map API Key
  2. Create an Empty Outage Map Dashboard
  3. Place Sites on the Outage Map
  4. Configure Outage Map Parameters

Obtain and Configure a Google Map API Key

Nectus needs an API key to work with Google Maps. Obtaining a Google Map API Key is outside the scope of this guide. Google provides detailed instructions for obtaining a key at:

https://developers.google.com/maps/documentation/javascript/get-api-key

Once you acquire a key, follow these steps to configure Nectus to work with your key:

  1. To open the Map Integration dialog, go to the Nectus Top Menu and navigate to: Settings -> General Settings -> Map Integration.

  1. Enter your API Key on the Google Integration tab.

2. Create an Empty Outage Map

To create an empty Outage Map, go to the Nectus Top Menu then navigate to: Monitoring -> Outage Map Dashboards -> Outage Map Dashboard.

Note: Nectus supports up to 10 maps and can display any or all of them simultaneously. See Section 2.3 for instructions on creating and displaying additional maps.

2.1 Zoom In to the Geographical Area of Interest

  1. Zoom in to the geographical area you are interested in.

  1. Click Save on the Outage Map Dashboard so Nectus will open this map to this geographical location in the future.

2.2 Assign and Save a Map Name

  1. To assign and save a name, click the map’s Settings button to open the Settings dialog.

  1. Enter the new name in the Title field.

2.3 Display Multiple Maps Simultaneously

It can sometimes be helpful to display multiple Outage Maps simultaneously. Nectus can display up to 10 maps at once. Each map has its own adjustable settings and can be zoomed and configured independently.

  1. To display multiple maps simultaneously, open the Dashboard Widgets dialog by clicking the Outage Map Dashboards Settings icon. Select the Outage Map tab.

  1. Check the Outage Maps you want to display. You can also edit their names here if desired. Nectus displays all the checked maps.

3. Place Sites on the Outage Map

To place a Site on the Outage Map, you need to enter the GPS coordinates in the Site Properties. You can either enter the coordinates manually, or you can let Nectus derive the coordinates of the Site from its Address.

3.1 Enter the GPS Coordinates Manually

Enter the GPS coordinates in the GPS Latitude and GPS Longitude fields.

3.2 Derive GPS Coordinates from the Address

If you don’t know the GPS coordinates of the Site, enter the Site Address and click Find GPS from Address. Nectus derives the GPS coordinates from the Address and enters them for you.

3.3 Understand Site Colors

The color of a Site’s icon on the map gives you an easy way to check the status of the Devices at that Site. Each Site icon can have one of three colors:

  • Grey – The Site has no Devices assigned to it.
  • Green – All the Devices assigned to the Site are “Up”.
  • Red – One or more of the Devices at the Site is “Down”. When a Site goes Red, Nectus also increases the size of the Site icon to help you spot it more easily.

3.4 Access a Site Context Menu from a Map

If a Site appears on a map, you can open its context menu directly, without having to navigate through the Sites Panel. Simply right-click the icon of the Site.

3.5 Removing a Site from a Map

To remove a Site from any and all maps without removing the Site from the Nectus database, clear its GPS coordinates in its Site Properties.

4. Configure Outage Map Parameters

An Outage Map has several configurable parameters that control how things appear on the map. You can configure each map independently of the others, giving you maximum flexibility to get exactly the information you need. The following sections show you how to configure these parameters.

4.1 Change the Shape and Size of Individual Site Icons

Changing the shape or size of certain Site icons makes it easy to pick out those Sites on a crowded map. You might make your most important Sites larger than the rest, or assign them a different shape.

To change the shape and size of individual Site icons, navigate to Site Properties. In the Outage Map Icon Size field select the icon size in pixels. Use the Outage Map Icon list to select a Circle, Star, or Triangle for the shape.

4.2 Change the Size of All the Site Icons on a Map

To scale all the icons on a map simultaneously navigate to: Map Settings -> General tab. In the Set Circle Radius (%) field enter a scaling factor that will apply to all the Site icons on this particular map. The following figure shows the map from section 4.1 with the icons scaled down to 50% of their original size.

4.3 Show or Hide Site Names

Every Site must have a Site Level Name, but you control whether Nectus displays those names on a map.

To show or hide all the Site Level Names on a map simultaneously navigate to: Map Settings -> General tab and check or uncheck Site Name.

4.4 Display of Hide Map Objects

Outage Maps can display a huge amount of information, not all of which may be useful to you. You can configure a map to display only those objects that are relevant to you.

To show or hide all the Site Level Names on a map simultaneously navigate to: Map Settings -> Google Map tab. Check or uncheck Map Objects as desired.


Network and Server Uptime Calculation Considerations for Monitoring tools

,

Network and Server Uptime Calculation Considerations for Monitoring tools

Uptime is one of the most important IT infrastructure operational metrics that gives an overview how “stable” or “reliable” your IT infrastructure is with 99.9999% uptime being a platinum standard.

But how do you calculate an Uptime?

In ideal (continuous and none-discrete) world calculation of Uptime is somewhat simple.

Take number of seconds in monitoring period and number of seconds when monitored object was down and use simple formula:

Uptime = 100 – ((Outage duration / Total time) * 100)

Example:

Monitoring Period: 1 year = 31,536,000 seconds

Total Object Outage Duration: 300 seconds

Object Uptime: 99.999%

Monitored Objects achieving “six nines” uptime should only be “down” for a maximum 31.5 seconds in the 365 days.

Uptime % Downtime per Year
99.99% 3120 sec
99.999% 300 sec
99.9999% 31 sec
99.99999% 3 sec

But as you get to “six nines” or higher, capabilities and configuration of monitoring tools starts to play critical role in accuracy of uptime calculations.

Single Server Example

Let’s start with an example of Uptime calculation for a single device such as a Server.

First, we need to define what constitutes a server being up or down and what tools we planning to use to determine its state.

Let assume that we use a classic ICMP v4 probing with ‘Polling Interval” equal to 1 second.

In other words, we will be sending Ping packets from a monitoring agent to the Server every 1 second and if server does not respond we shell consider it down.

Simple enough?

Well, may be in perfect world yes, but we live in real world and packets may get lost for reason other than Server being down.

Packets may get lost due to traffic shaping, CRC errors and many other reasons. So, to prevent influx of false positive Server down events we need to increase number

of consecutive packets that must be missed to consider Server to be “down” to a number greater than 1.

Let’s call this number an “Assurance Multiplier”.

Greater “Assurance Multiplier” values shell result in greater probability that we detect an actual Server down event. But at the same time greater “Assurance Multiplier” will result in slower detection time for Server down events and inability to detect short-lived outages with duration time less than (Assurance Multiplier * Polling interval) seconds.

We also need to introduce two new parameters: “Actual Outage Duration” and “Detected Outage Duration” to reflect the fact that duration of the Server outage calculated by monitoring agent may be slightly greater than actual outage of the Server due to the fact that duration of polling interval is > 0.

Summary

Polling Interval” – Time between two consecutive state polls.

Assurance multiplier” – Number of consecutive polling intervals when object’s state must be Down to consider monitored object to be truly down.

Outage Detection Time” – Time is takes for monitoring Agent to detect an outage of the monitored object after outage has started.

“Actual Outage Duration” – Actual Outage Duration of the monitored object.

Calculated Outage Duration” – Duration of the Outage as calculated by the monitored object.


Considering that Actual Outage Duration > (Polling Interval * Assurance Multiple) worst case scenarios should be calculated as following:

Outage Detection Time = (Polling Interval * Assurance Multiplier) + Polling Interval

Calculated Outage Duration = (Polling Interval * Assurance Multiplier) + 2 * Polling Interval

Lets do the math with following  Monitoring Agent Configuration Example : Polling Interval = 1 Sec and Assurance Multiplier = 3

We get following results:

Outage Detection Time = 4 Seconds

Best Detectable Actual Outage > 3 Seconds

Best Calculated Outage Duration > 5 Seconds

Now we can see that provided example of Monitoring Agent configuration is sufficient for grading Server’s Uptime as 99.9999% but not sufficient for 99.99999% classification.

To classify monitoring tool for 99.99999% accuracy you need to decrease Polling Interval or decrease Assurance Multiplier by at least 30%.

So next time when you see a 99.99999% Uptime calculated by a Monitoring tool with a Polling interval of 5 minutes you know that it is likely not true.

It gets more interesting when we move into calculation of Uptime for a Network rather than a single object like Server.


Creating Hierarchical Site Structure in Nectus

, ,

Creating Hierarchical Site Structure in Nectus

In this chapter you’ll learn how to create a Hierarchical Site Structure in Nectus and populate it with Devices. This activity is fundamental to using Nectus.

Specifically, you will learn how to:

  • Create a New Site
  • Delete a Site
  • Move a Site
  • Add a Device to a Site
  • Delete a Device from a Site
  • Move a Device to a Different Site

Creating a New Site

Like everything in Nectus, creating a Site is fast and simple. Follow these instructions to get it done:

  1. In the Sites Panel on the Nectus Home screen, click Sites. The “All Sites” list appears. Right-click All Sites.

  1. In the menu that appears, click Create New Site Level.

  1. In the Create New Site Level dialog box that appears, enter the Site Level Name and any other information relevant to the Site you are creating.
  2. Click Ok to add the Site to your Nectus Hierarchical Site Structure.

Deleting a Site

Deleting an existing Site is even easier than creating a new one. Follow these steps:

  1. Click Sites in the Sites Panel on the Nectus Home Screen. The “All Sites” list appears.
  2. Open the All Sites list by clicking the plus sign ( + ) to the left of the list.
  3. Navigate to the Site you want to delete and right-click it.

  1. In the menu that appears, select Delete Current Site Level. A confirmation dialog box appears.

  1. Click Ok to delete the Site.

Moving a Site

You can move a Site to a new location in the existing hierarchy. This location can be at the same level in the hierarchy or at any other level. Any Site can be moved to any location within the hierarchy. Follow these instructions to move a Site:

  1. Click Sites in the Sites Panel on the Nectus Home Screen. Open the “All Sites” list and navigate to the Site you wish to move.
  2. Right-click the Site name.

  1. In the drop-down menu that appears, hover the cursor over the Move Current Site to… option. A list of all the top-level Sites in your hierarchy appears.
  2. Hover the cursor over a location in this list to see a list of any Sites under this location.
  3. Click a location to place your original Site under that location. Clicking All Sites in the hierarchy moves your Site to the top level.

Adding a Device to a Site

Here, we are assuming that you have already added your available Devices to the Unassigned Devices list. Follow these steps to add a Device to a Site by taking it from the Unassigned Devices pool:

  1. In the Sites Panel of the Nectus Home screen, click Sites. The “All Sites” list appears.
  2. Open the Unassigned Devices list by clicking the plus sign ( + ) to the left of the list.
  3. Right-click the Device you want to add to a Site.

  1. In the menu that appears, hover the cursor over the Move Device to… option. A list of all the available top-level Sites appears.
  2. Navigate through the Site hierarchy by hovering the cursor over Sites to view their sub-sites. Click the Site you want to add the Device to.
  3. The Device moves from the Unassigned Devices pool into the Site you selected.

Deleting a Device from a Site

Follow these steps to delete a Device from a Site by moving it back to the Unassigned Devices pool:

  1. In the Sites Panel on the Nectus Home screen, click Sites. The “All Sites” list appears.
  2. Open the All Sites list by clicking the plus sign ( + ) to the left of the list.
  3. Navigate to the Site that contains the Device you want to delete.
  4. Open the Site by clicking the plus sign ( + ) to the left of the list. The Device appears below the Site.
  5. Right-click the Device name. A menu appears.
  6. Hover the cursor over the Move Device to… option. A list of your top-level Sites appears.
  7. Select Unassigned Devices in the list to delete the device from the Site and return it to the Unassigned Devices pool.

Moving a Device to a Different Site

Moving a Device between Sites is very similar to deleting a device. Here are the steps:

  1. In the Sites Panel on the Nectus Home screen, click Sites. The “All Sites” list appears.
  2. Open the All Sites list by clicking the plus sign ( + ) to the left of the list.
  3. Navigate to the Site that contains the Device you want to delete.
  4. Open the Site by clicking the plus sign ( + ) to the left of the list. The Device appears below the Site.
  5. Right-click the Device name. A menu appears.
  6. Hover the cursor over the Move Device to… option. A list of your top-level Sites appears.
  7. Navigate through the hierarchy of Sites and click the Site you want to move the Device to.