Working with Syslog
Requirements: Operating System: Ubuntu 22.04.1 LTS RAM: 16GB vCPU: 2
More information about installation: https://clickhouse.com/docs/en/install/#self-managed-install
Step 1
Open terminal and install required packages:
sudo apt-get update
sudo apt-get install -y apt-transport-https ca-certificates dirmngr
Step 2
Import the ClickHouse public key:
sudo apt-key adv –keyserver hkp://keyserver.ubuntu.com:80 –recv 8919F6BD2B48D754
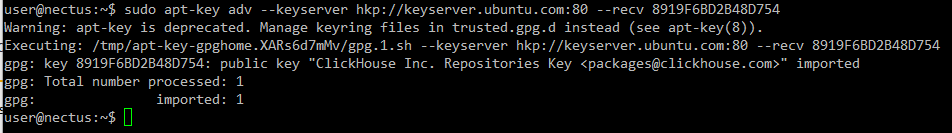
NOTE: It is recommended to import the public key if it’s a fresh Ubuntu install.
Otherwise, you may get the following error when adding the repository:
GPG error: http://repo.clickhouse.com/deb/stable/main/release:
The following signatures couldn’t be verified because the public key is not available:
NO_PUBKEY 8919F6BD2B48D754
Step 3
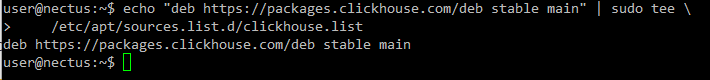
Add ClickHouse repository:
echo “deb https://packages.clickhouse.com/deb stable main” | sudo tee \
/etc/apt/sources.list.d/clickhouse.list
Step 4
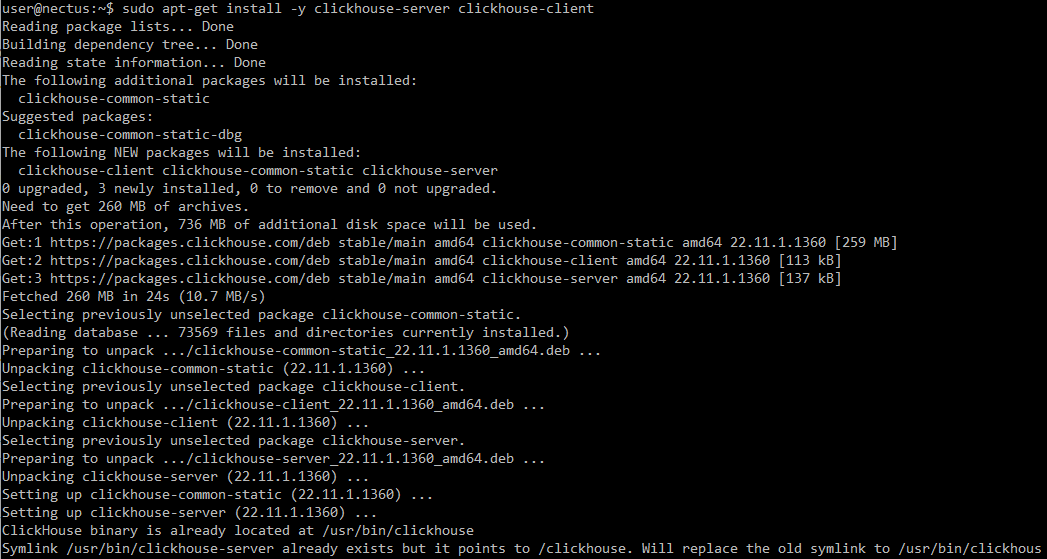
Install ClickHouse:
NOTE: During the installation you will be asked to create a password for default user.
Generate a strong password and save it, it will be used for further configuration.
sudo apt-get update
sudo apt-get install -y clickhouse-server clickhouse-client
Step 5
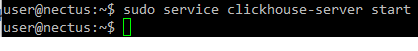
Start ClickHouse server as a daemon:
sudo service clickhouse-server start
Step 6
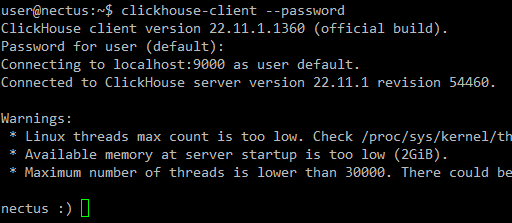
Now after installation it is time to test connection to ClickHouse database.
Start client (use password generated on Step 4):
clickhouse-client –password
NOTE: Use Ctrl+D to exit ClickHouse client.
NOTE: TCP ports 8123 and 9000 must be open
Step 7
NOTE: Use Ctrl+D to exit ClickHouse client.
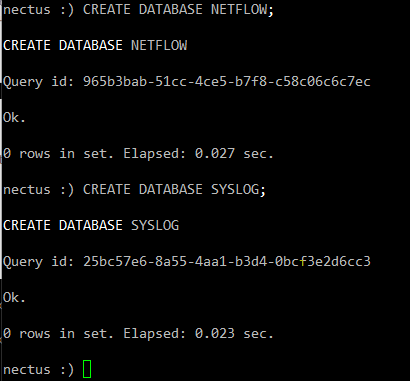
While being connected to the ClickHouse, create required Netflow & Syslog databases:
CREATE DATABASE NETFLOW;
CREATE DATABASE SYSLOG;
ClickHouse Configuration
Step 8
By default, ClickHouse allows inbound connections from localhost only.
To allow connections from remote IP-s
edit /etc/clickhouse-server/config.xml:
sudo vim /etc/clickhouse-server/config.xml
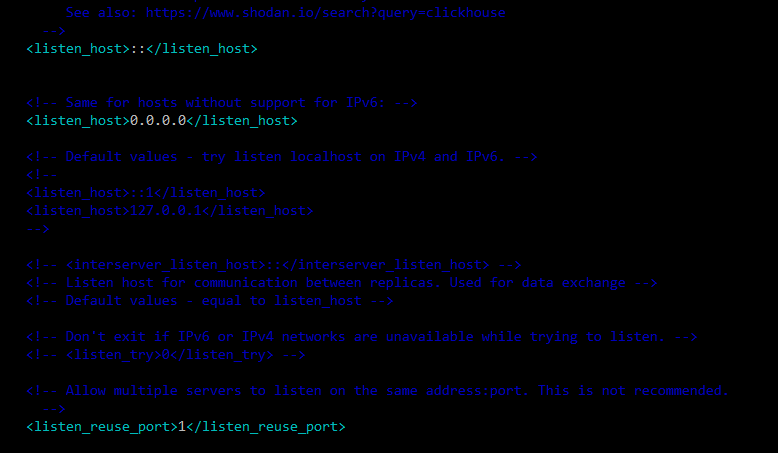
Find <listen_host> parameters (one for IPv6 and one for IPv4) allowing all connections after <logger> section, and uncomment them.
Also uncomment and change to 1 <listen_reuse_port> tag for allowing simultaneous IPv4 and IPv6 interfaces:
<listen_host>::</listen_host>
<!– Same for hosts without support for IPv6: –>
<listen_host>0.0.0.0</listen_host>
<listen_reuse_port>1</listen_reuse_port>
Step 9
Restart ClickHouse to apply new parameters:
sudo service clickhouse-server restart
![]()
Step 10
Add internal ClickHouse user “root” for Nectus server to connect to DB.
For that edit users.xml file:
sudo vi /etc/clickhouse-server/users.xml
Find <users> section right after <profiles> section.
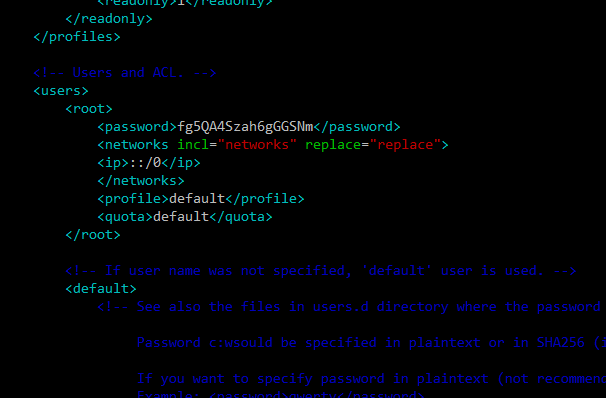
Add code snippet with user configuration from below, right between </users> and <default> tags, as on a screenshot below.
Generate strong password, replace it in snippet below, and then save file:
<root>
<password>**********</password>
<networks incl=”networks” replace=”replace”>
<ip>::/0</ip>
</networks>
<profile>default</profile>
<quota>default</quota>
</root>
NOTE: If file was overwritten by WinSCP or any other similar tool, verify that file has correct ownership:
sudo chown clickhouse:clickhouse /etc/clickhouse-server/users.xml
Step 11
Restart ClickHouse to apply new user:
sudo service clickhouse-server restart
![]()
Step 12
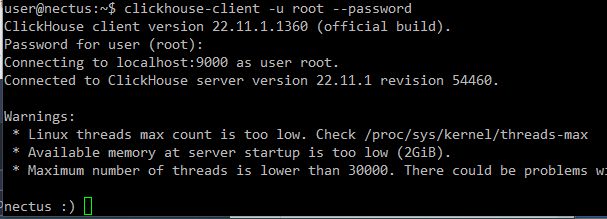
Verify newly created user able to log in:
clickhouse-client -u root –password
Step 13
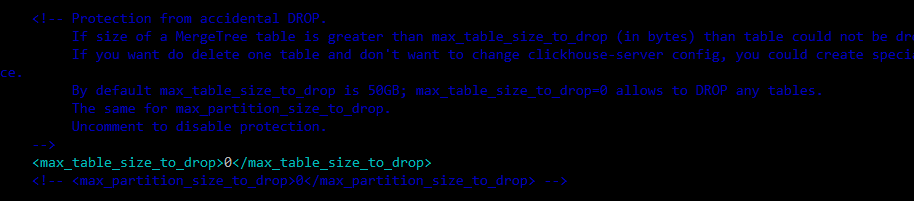
Disable limit of max database size to drop. By default, ClickHouse doesn’t allow to drop table bigger than 50 Gb to prevent occasional data loss.
NOTE: More info here: https://cloud.yandex.com/en/docs/managed-clickhouse/concepts/settings-list#dbms-cluster-settings
To disable it, edit config file /etc/clickhouse-server/config.xml:
sudo vi /etc/clickhouse-server/config.xml
Find and uncomment line to disable limit of max table size to drop:
<max_table_size_to_drop>0</max_table_size_to_drop>
Restart ClickHouse to apply change:
sudo service clickhouse-server restart
Nectus Configuration
Step 14
We have completed the ClickHouse installation. This last step requires login to Nectus to finish the NetFlow/Syslog integration.
Open to “Nectus Settings -> General Settings -> Netflow Integration” page:
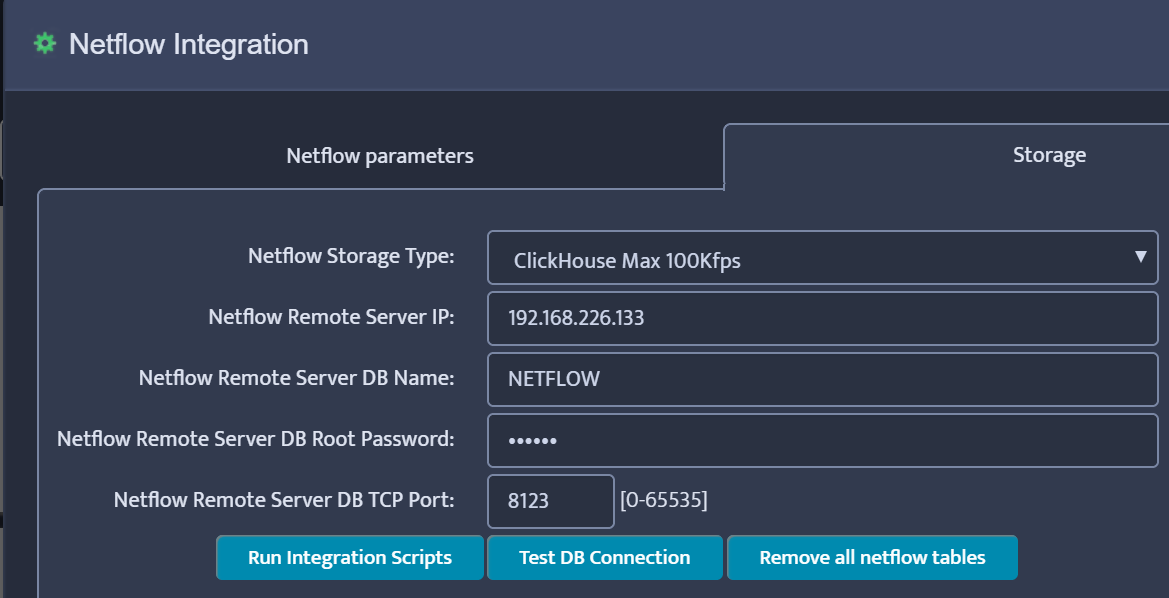
Enter the required information and click Test DB Connection (Remote Server IP is the IP address of the Ubuntu/ClickHouse server). The result should be “Test DB Connection OK”
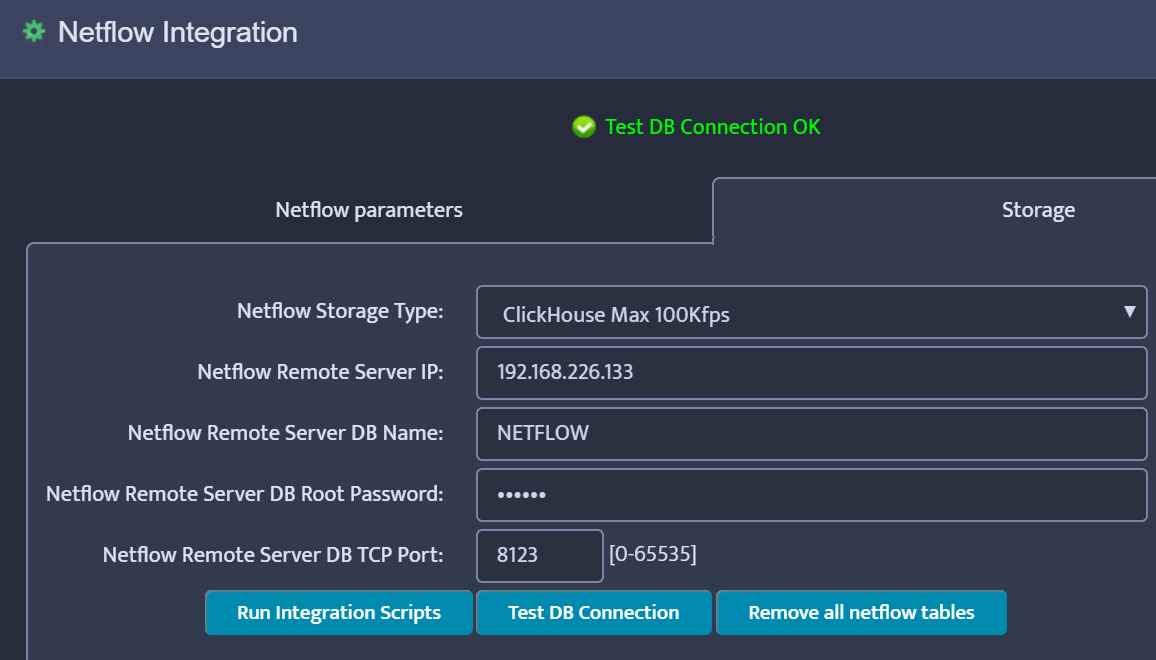
Click “Run Integration Scripts” and finally Save.
Step 15
Restart Nectus NetFlow and Syslog Services.
How to Configure Nectus Syslog Collector to use Local Storage
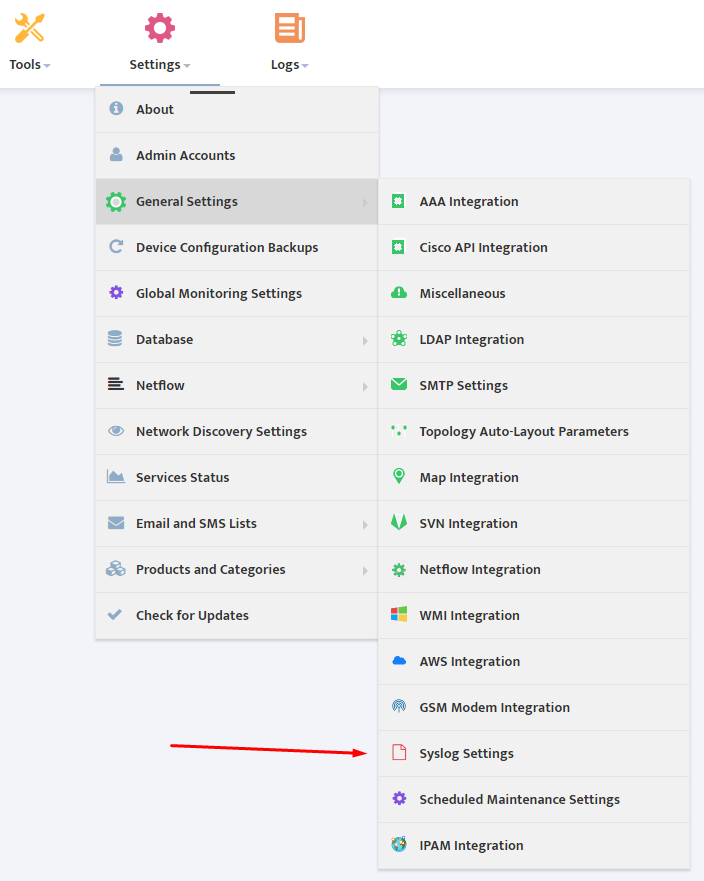
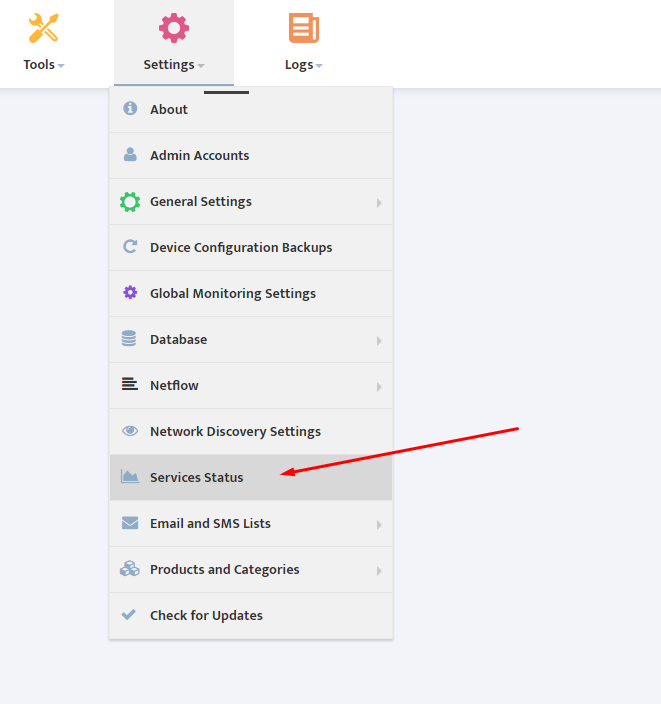
- To configure Nectus Syslog collector storage settings go to Main Menu
Settings → General Settings → Syslog Settings
- Configure Storage parameters according to this example:
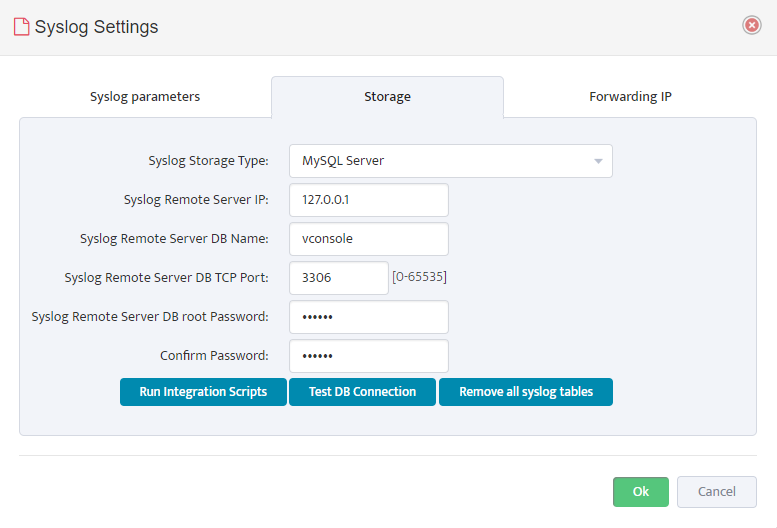
“Syslog Remote Server DB Root Password” should be taken from this file:
C:\Program Files\Nectus\Web\Apache24\htdocs\protected\config\database.ini
- After Configuration is finished press “Test DB Connection” to test connectivity to DB
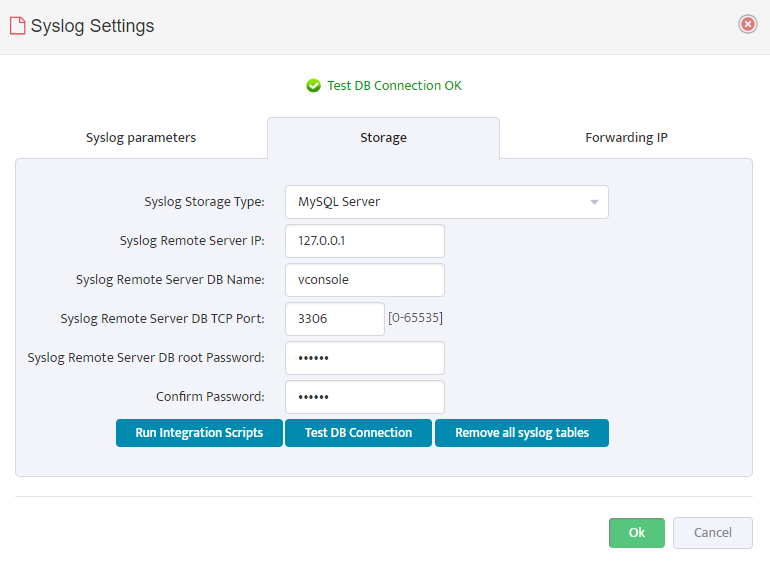
- After DB connectivity is Tested, Press “Run Integration Scripts” button to create required SQL Tables.
- After Integration Scripts has been executed, Restart Syslog collector service in
“Settings → Services Status”
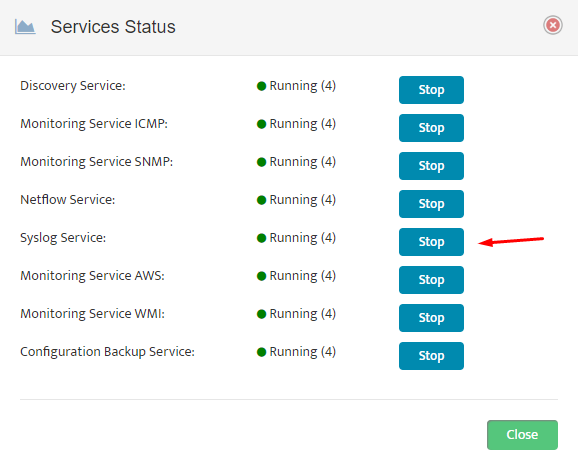
After Syslog Service is Restarted it should be ready to process and store Syslog Traffic.

Cascading Syslog Servers
Introduction to the Syslog Protocol
Syslog is a protocol that allows systems to send Event Notification Messages through IP networks to Syslog Servers (also known as Event Message Collectors). There the messages can be sorted, searched, and analyzed to monitor the state of individual devices as well as the overall system.
Syslog messages contain both status information and a Severity Level, which ranges from 0 (zero) to 7. Level 0 messages are emergencies. Level 7 messages signify that the sender is in Debug mode. The meanings of Levels 1 through 6 are application dependent.
2. Multiple Syslog Servers – The Traditional Approach
In some situations you might want to add additional Syslog Servers to your system. Traditionally you would do this by configuring each connected device or server to send messages to the Main Syslog Server and to each Secondary Syslog Server. This configuration is shown in the following image:
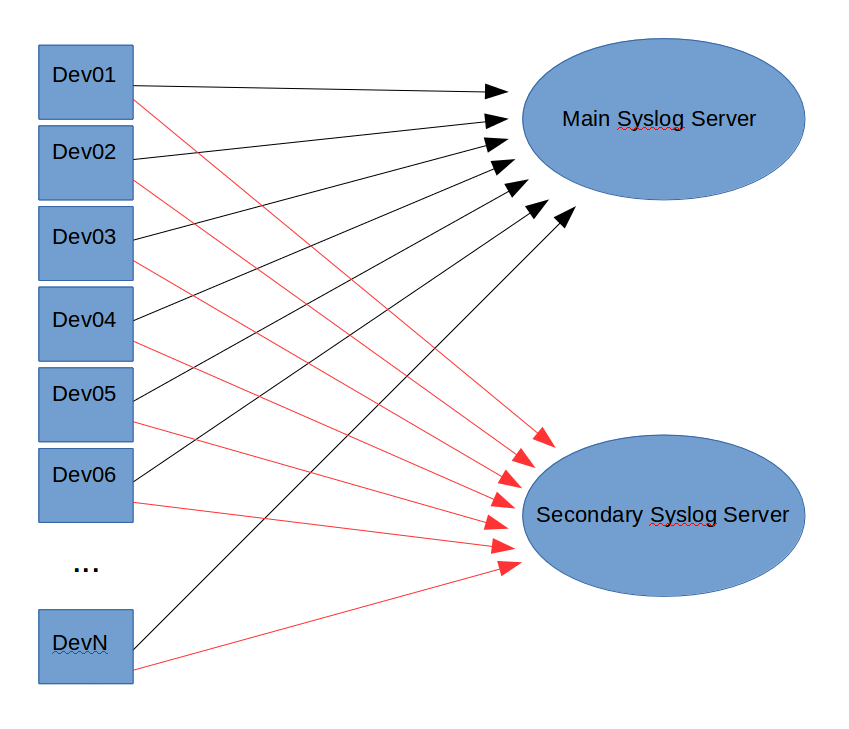
This works fine if you just have a few devices. But it quickly becomes impractical as the number of connected devices grows. Imagine configuring 1000+ devices to send Syslog messages to one or more additional servers for a special project, then disconnecting them all later.
This makes the traditional approach impractical for large installations.
3. Multiple Syslog Servers – The Cascading Approach
To avoid the problems of the traditional approach, Nectus implements Cascading Syslog Servers. Instead of connecting each device to each Syslog server, you need only connect them to the primary Syslog server. The primary server can then forward copies of the messages to any secondary servers, as shown in the following image:
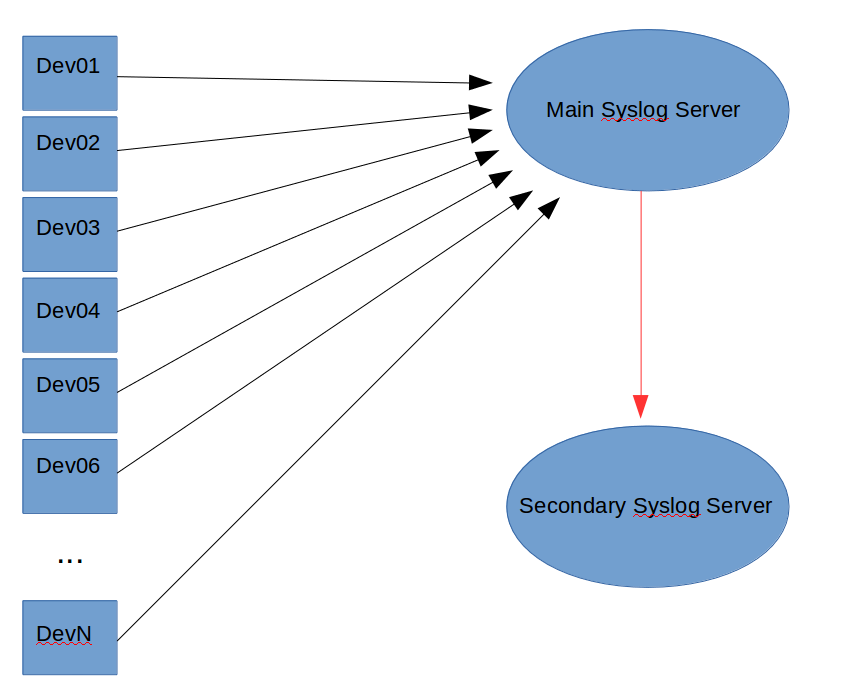
This approach makes adding and removing secondary Syslog servers simple. However, forwarding every Syslog message does increase the load on the primary Syslog server. You need to carefully monitor the primary server to avoid overloading it.
Nectus recommends you cascade no more than 10 secondary Syslog servers to avoid overloading the primary server.
3.1 Configuring the Nectus Cascading Syslog Servers Solution
Follow these steps to configure Cascading Syslog Servers:
- Click Settings in the Nectus Home Screen.
- In the Settings menu that appears, hover the cursor over the General Settings option.
- Click the Syslog Settings option that appears. Select the Forwarding IP tab in the Syslog Settings dialog that appears.
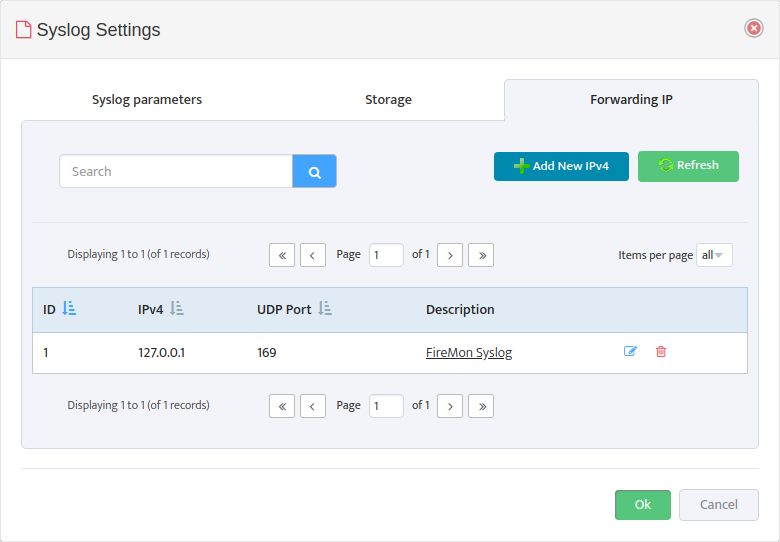
- Click the Add New IPv4 button to open the Add Forwarding IPv4 dialog.
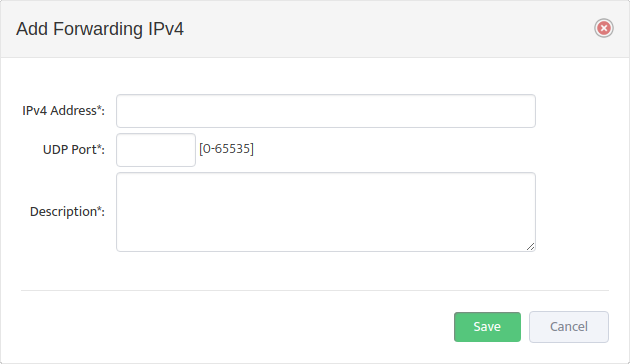
- For each secondary Syslog server add the IPv4 Address of the server, the number of the UDP Port the server is listening on, and a Description of the server.
One of the key features of Nectus is ability receive SNMP traps. This allows the operator to quickly detect physical (links failures, flaps) or logical (adjacencies failures, flaps) changes in the network followed by restoration procedures or root cause analysis.
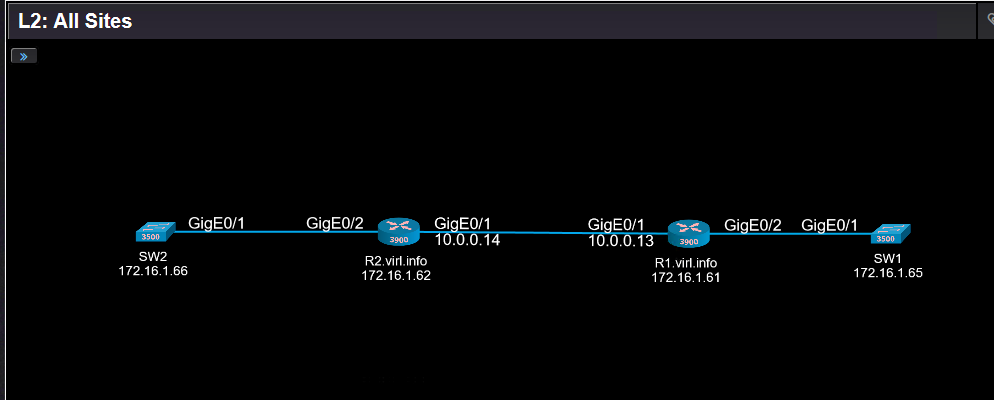
Let’s see how does it work on example of this Layer 2 diagram:
The SNMP traps are located in top menu “Logs” -> “SNMP traps and Syslog”.
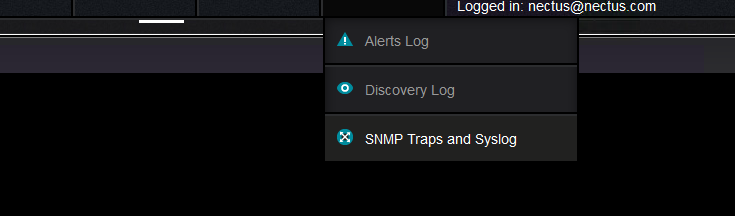
More exactly here:
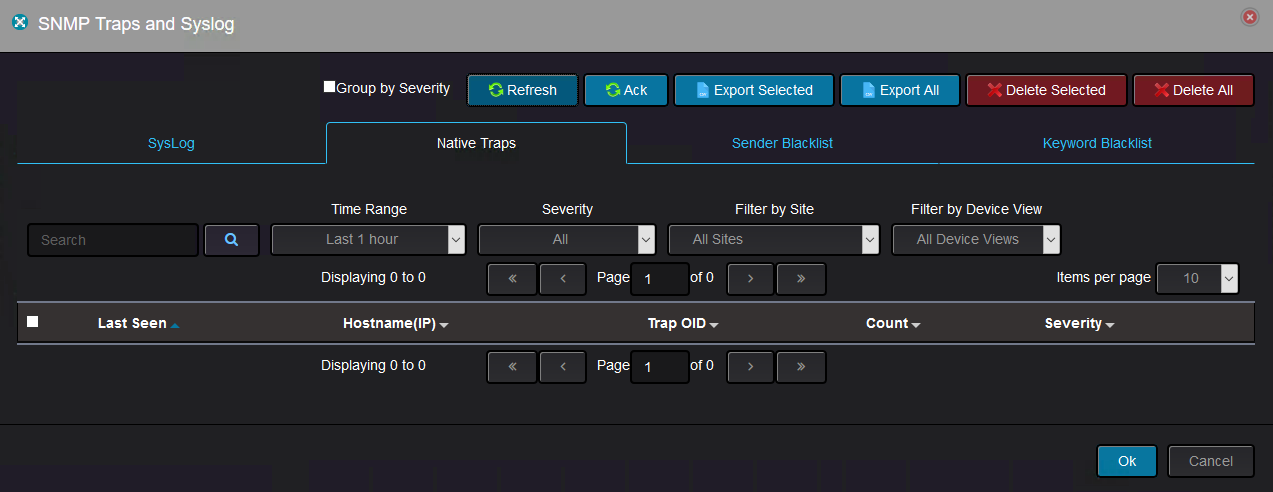
Once the devices starts sending SNMP traps, they appears withing 2-3 minutes in Nectus:
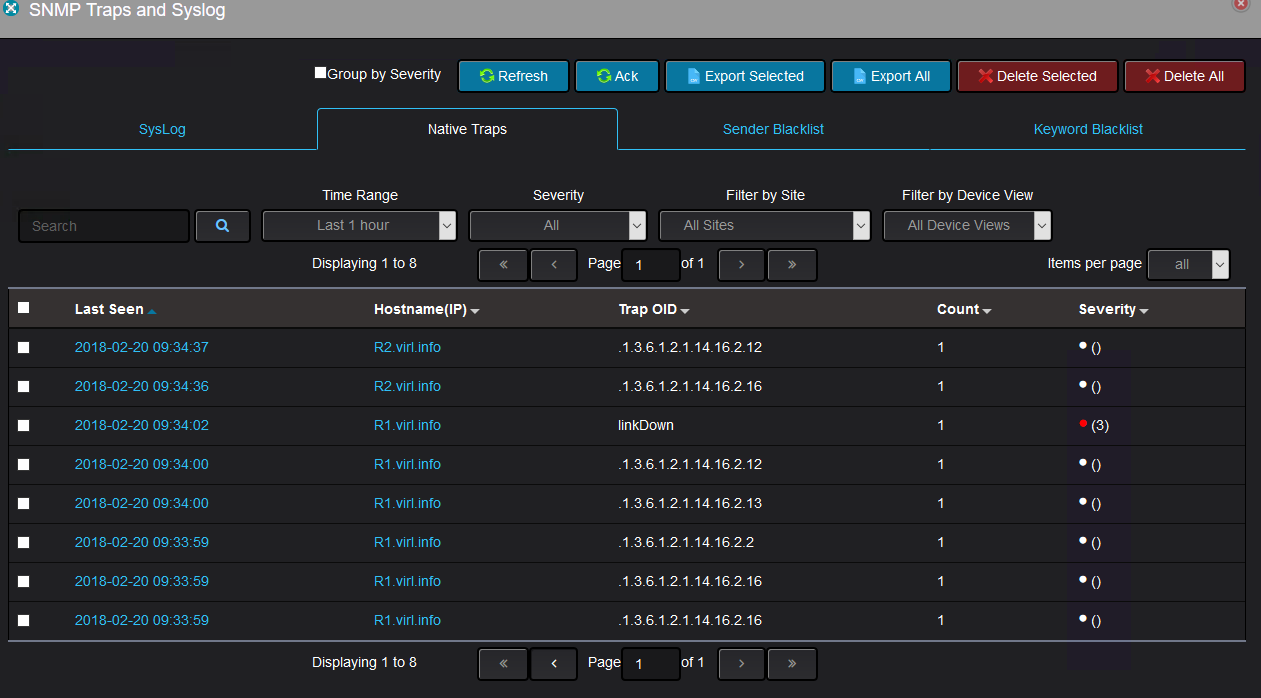
At the time of the writing, the new SNMP traps decoding is added manually by the Nectus support team, but in the future the operator will have the ability to add the traps decoding with no external assistance.
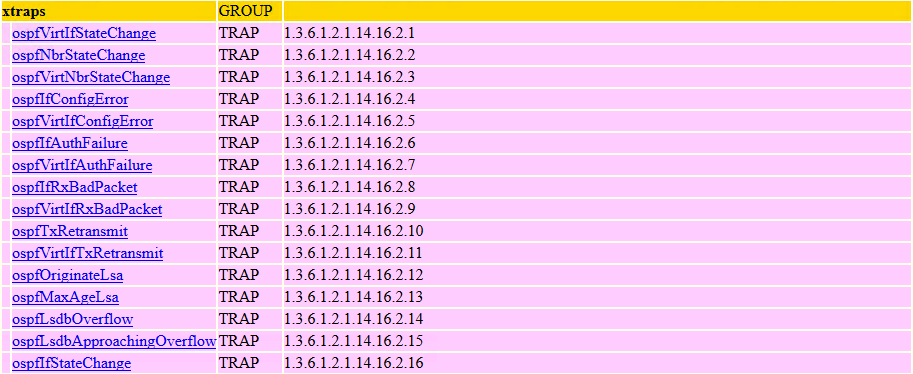
All these traps were sent by R1 and R2 when GigabitEthernet0/1 on R1 was shut down. Because OSPF was running between R1 and R2, disabling the interface lead to OSPF adjacency between the two routers to go down.
As you can see, some OIDs are represented their original format, whereas some OIDs are represented in a more human readable format.
The details of a trap might look like this:
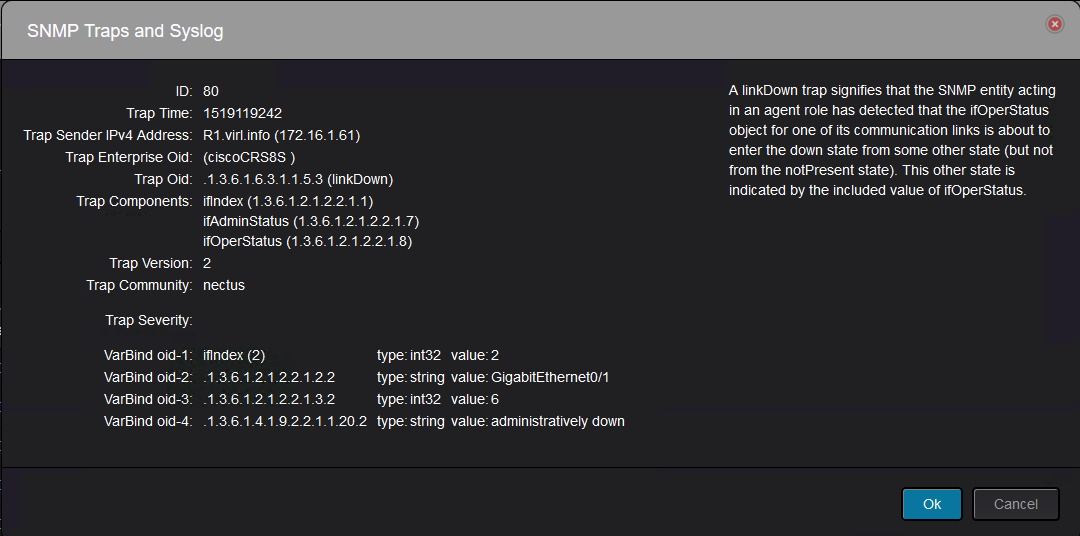
With the above trap details, you can tell that this is “link down” trap.
However, with other traps, you might need additional knowledge to figure what they represent.
Let’s take another example of detailed trap:
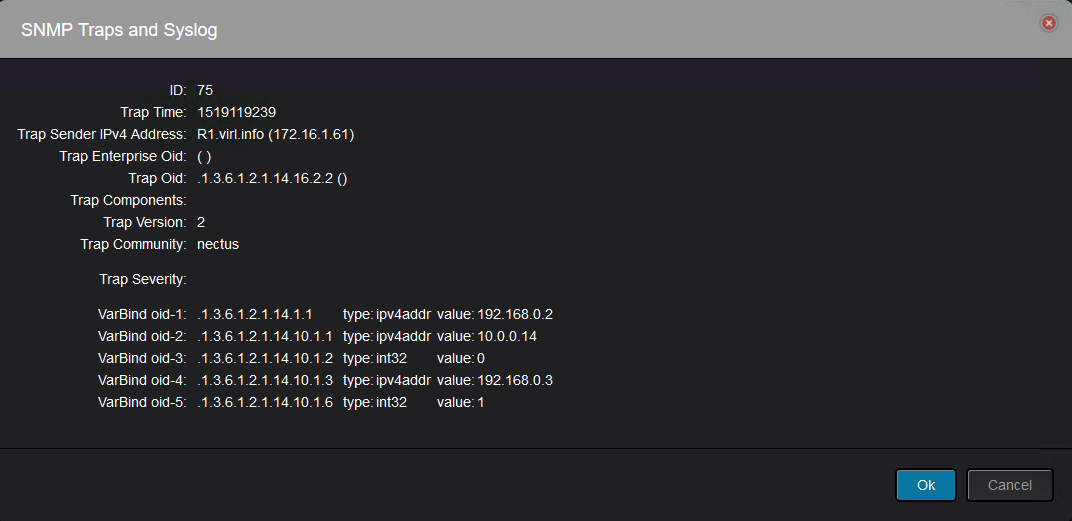
This trap was sent by R1 and it is a neighbor state change(.1.3.6.1.2.1.14.16.2.2):
And it can be read like this: Router-ID 192.168.0.2(.1.3.6.1.2.1.14.1.1) declared neighbor 192.168.0.3(.1.3.6.1.2.1.14.10.1.3) with IP address on the interface 10.0.0.14(.1.3.6.1.2.1.14.10.1.1) as Down(.1.3.6.1.2.1.14.10.1.6 with value of 1).
Obviously this is not very intuitive and Nectus should do all the the decoding so that the operator will not go through all the effort to find what each OID means.
In the future releases user will have an option to add the decoding for new or unknown SNMP traps via GUI.
This post will cover the SysLog server functionality of Nectus network monitoring software.
As with any modern network monitoring software Nectus has the ability to receive and store the syslog messages from routers, switches or servers.
Syslog messages can be accessed from Top menu “Logs”: Read more
One of the unique features of Nectus Syslog service is ability to alert users via Email or Text messages not only
on Syslog message Severity level but on specific keywords inside Syslog message. For example you can configure a rule
to alert via email when there is Syslog message with Severity 2+ and there is string “VPC Peer-Link” inside Syslog message body,
limiting your alerts to only syslog messages related to VPC Peerlinks. You can configure multiple keywords with Alerts going to
different recipients, so the Server team receives the Server specific keywords and Network Team receives the Alerts about
those ugly green boxes locked in MDF closets.
![]()
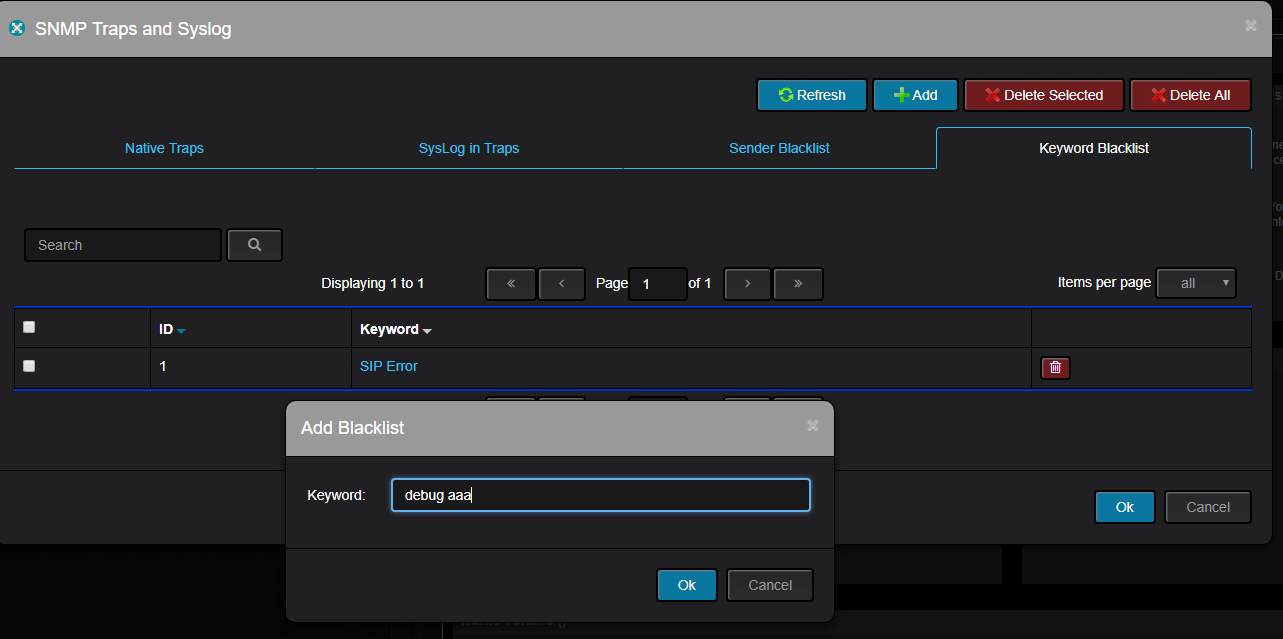
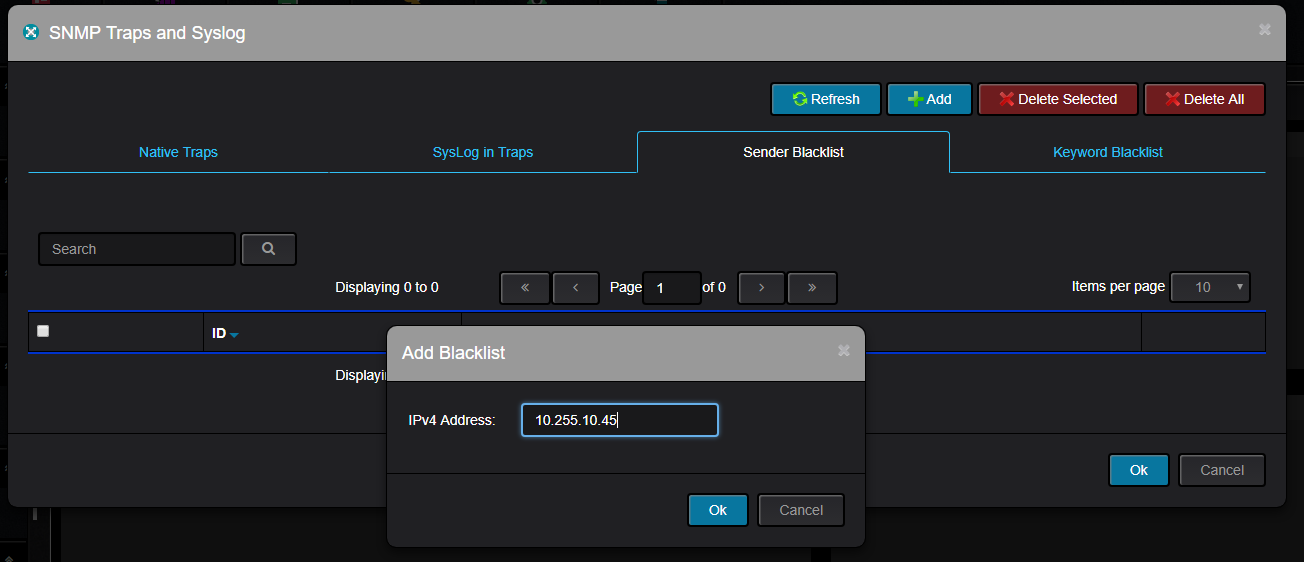
If you want to prevent specific device from sending messages to Syslog, you can add its IP address
to Syslog Sender Blacklist. All messages from that IP address will be discarded.
If you want to prevent specific Syslog messages from being added to Syslog Database,
you can add a specific keyword to a Syslog blacklist and all syslog messages that contain this keyword will be discarded.
This does not have retroactive effect on messages that are already in DB.