Building Dynamic Interactive Network Diagrams
This post will cover how Nectus can dynamically build topologies and how you can check various performance statistics.
Nectus gives the possibility to build automatically L2 and L3 topologies based on the discovered devices.
Additionally, it allows the administrator to create custom topologies by dragging on the map the devices that are required to be on the topology.
Nectus will then connect the devices from the topology based on the information it has gathered using SNMP.
Suppose you want to create a map with only the PE devices from multiple sites and in each site, you have other devices that are platform/model wise identical to the PE devices.
If you would rely on Nectus to create a map by selecting a site, you will get on the map as well other devices than the PE devices and you will not have the PEs from other sites.
If you would select based on model, you will get all the PEs, but also the other devices that are identical from the point of view of platform/model.
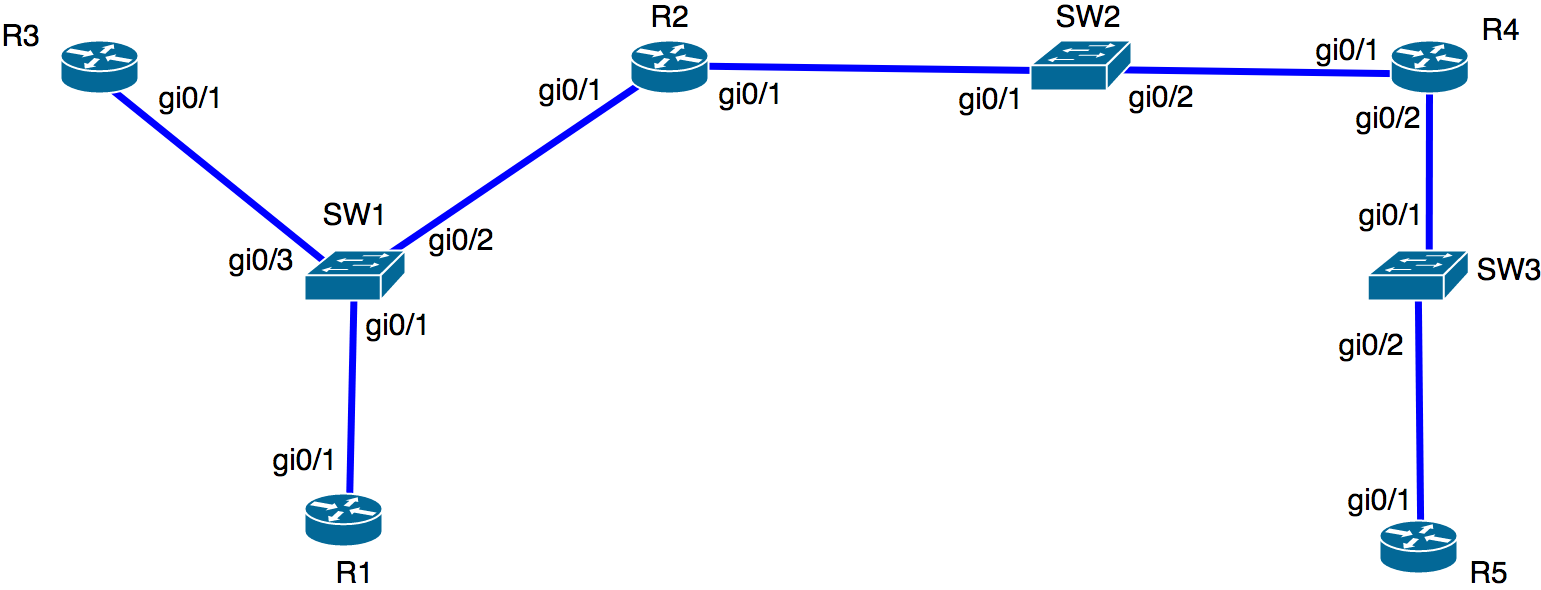
This is the physical topology:
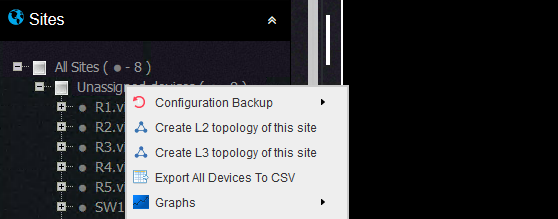
To create a L2 and L3 topology, you can use the context menu on a site level or device level. This is if you want to include the devices from all sites:
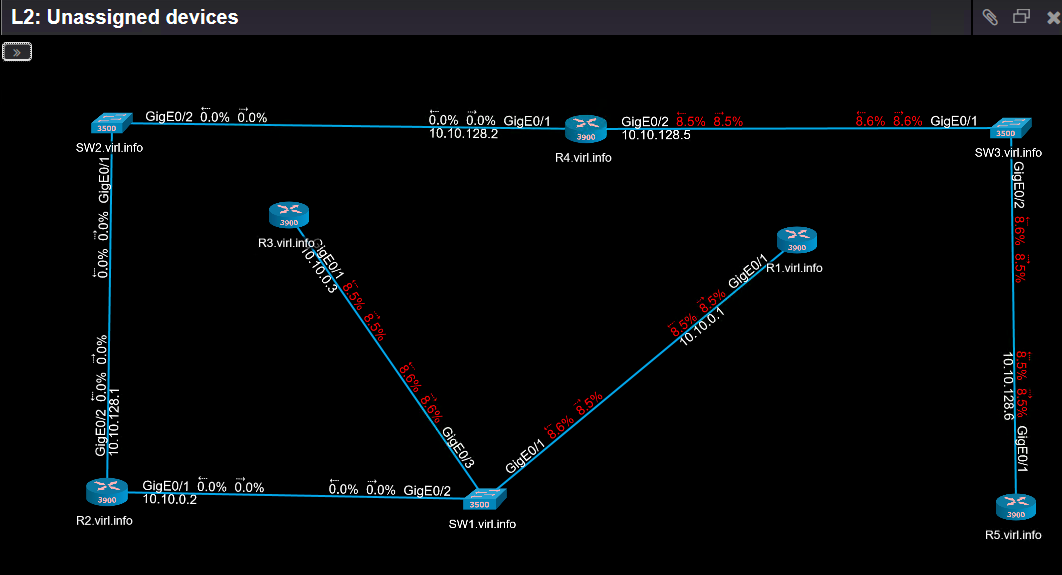
If you want Nectus to build the L2 topology based on what it discovered, then the L2 topology will look like this (you can move around the devices on the map for a better visibility):
For the L3 topology, it looks like this:
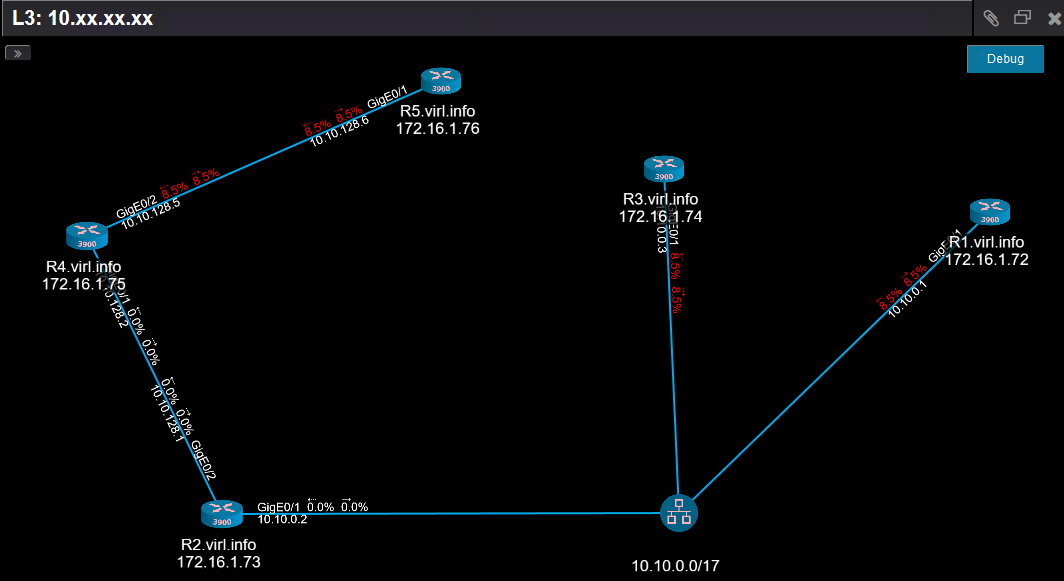
As you can see, on each link between these devices, you can see the link utilization.
When the screenshot was taken, a ping between R4 and R5 and between R1 and R3 were running.
The threshold was set to 1% so this value can be crossed quicker and because the utilization was around 8.5%, the link is colored in red giving you a quick heads-up about a possible congestion on that link.
This is how you can enable link utilization displaying directly on the topology:

As you can see from the L3 topology, one might think that R4 and R5 are directly connected, but L2 topology shows how the devices are connected and
what are all the links where utilization went above the configured threshold.
Nectus can display various information in a graphical way about the links and devices from the topology.
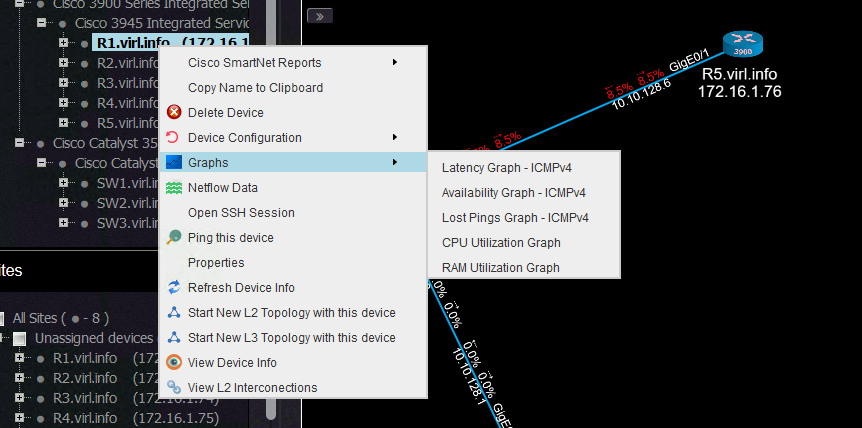
The graphs pertaining to links can be seen here:
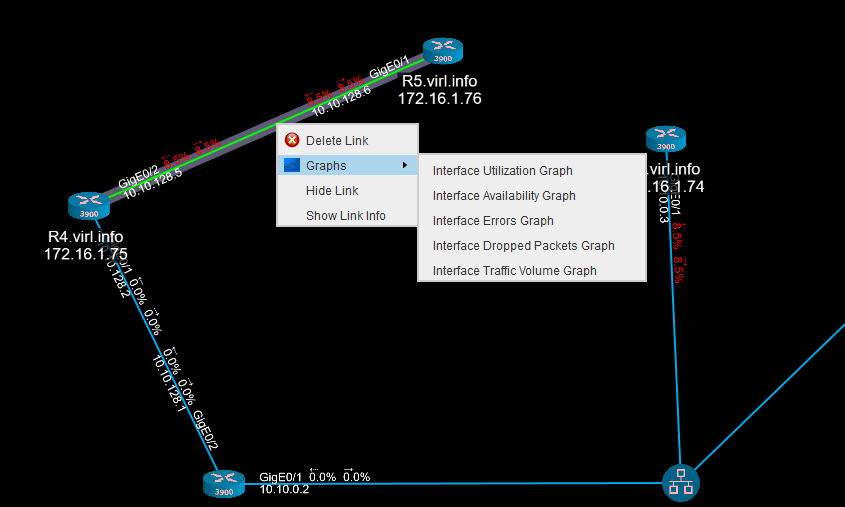
You can see the interface utilization with high level of granularity:
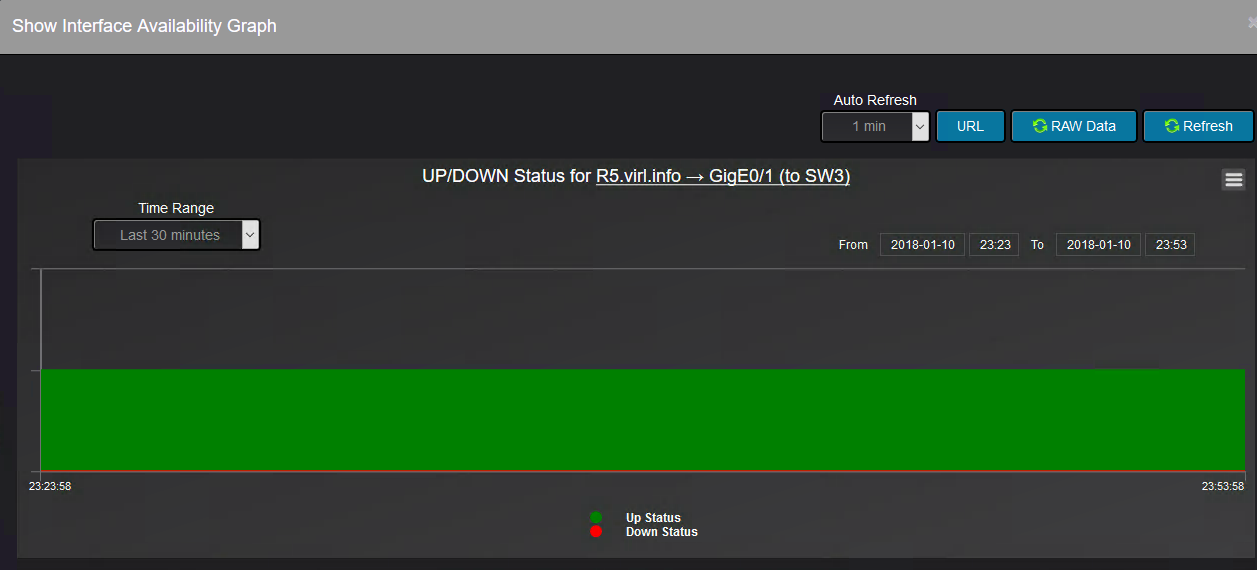
Also, you can see the history of the interface availability:
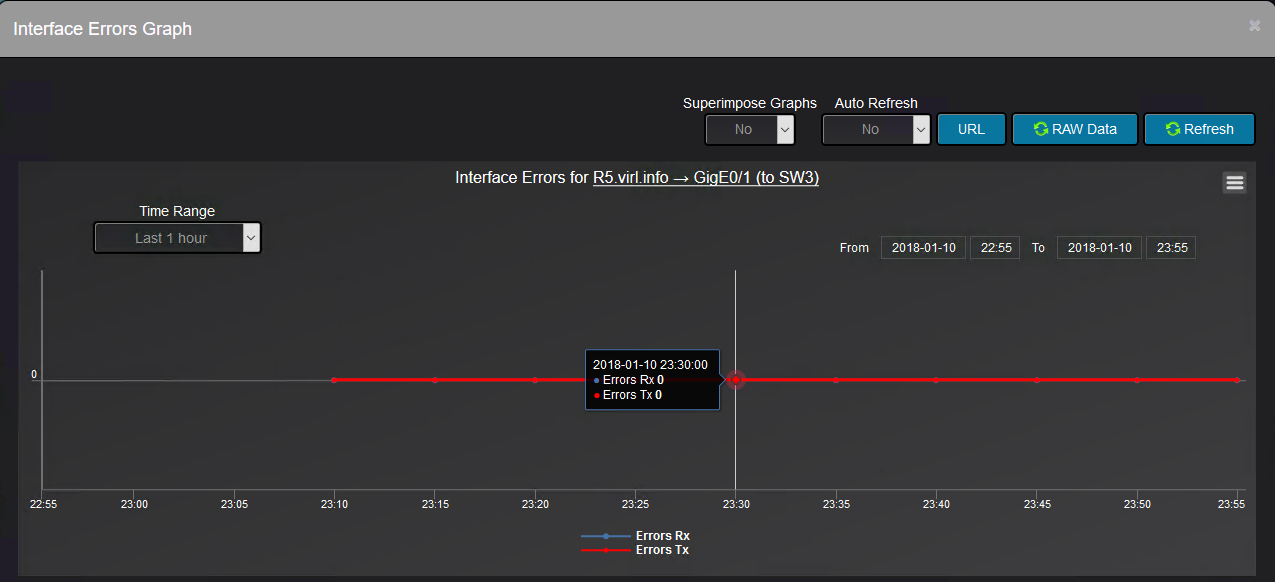
Further on, interface errors are being tracked as well:
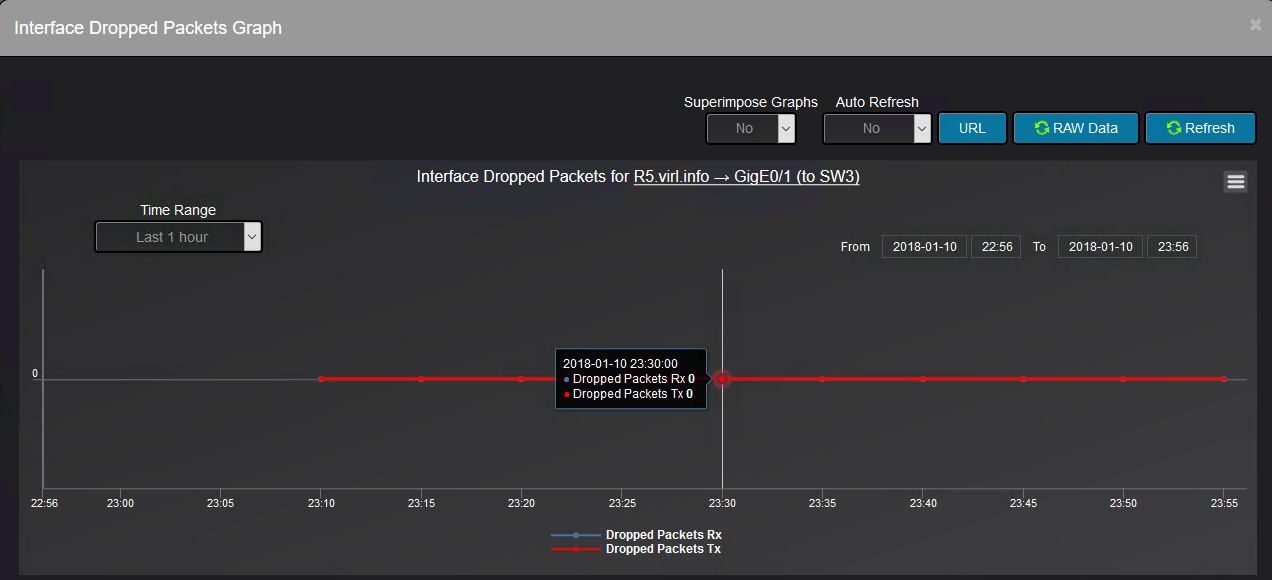
Along with the dropped packets on the interface:
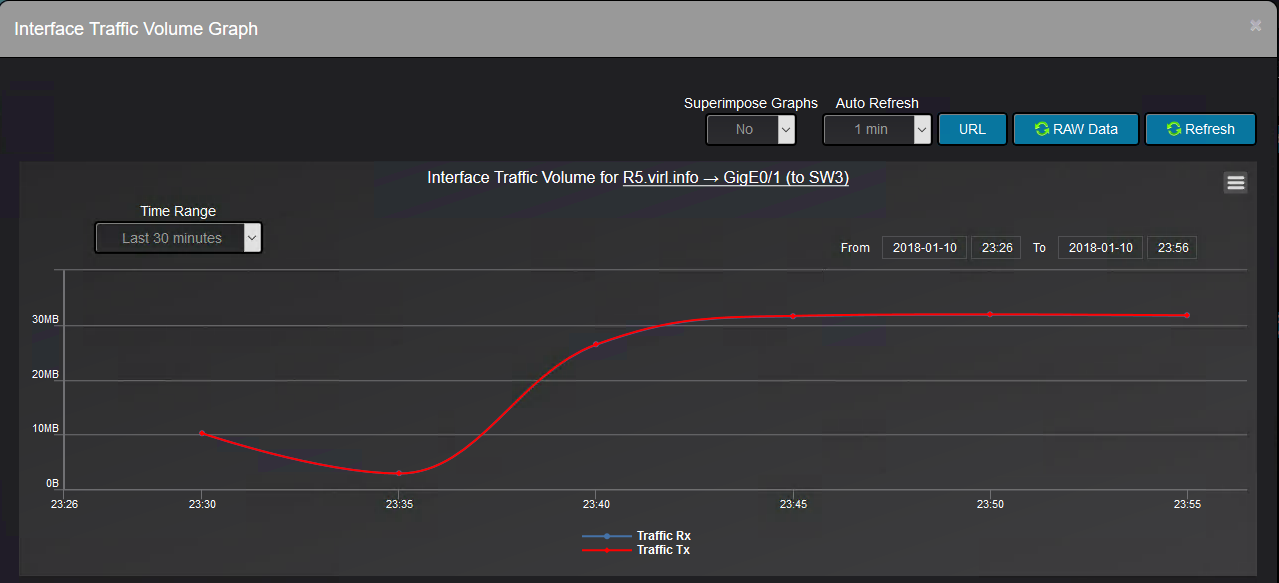
The interface traffic volume is displayed as well:

With regards to the devices from the topology, for each device can be displayed a set of graphs to show the health and status of the device:
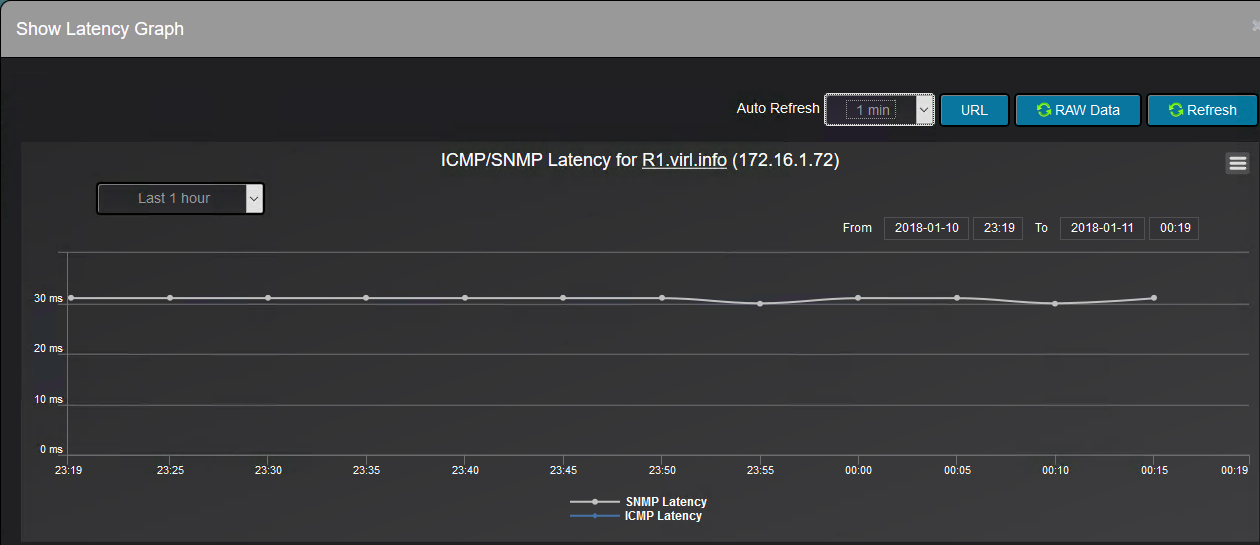
This is the latency graph:
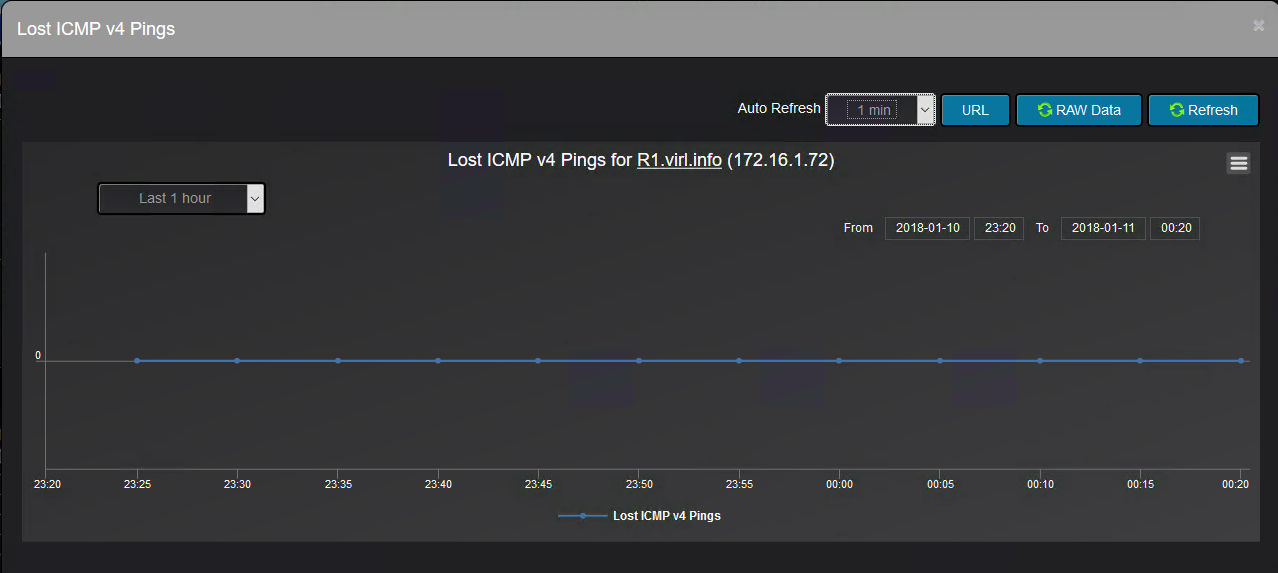
And this one shows if any of the ICMP packets used for device availability tracking were lost:
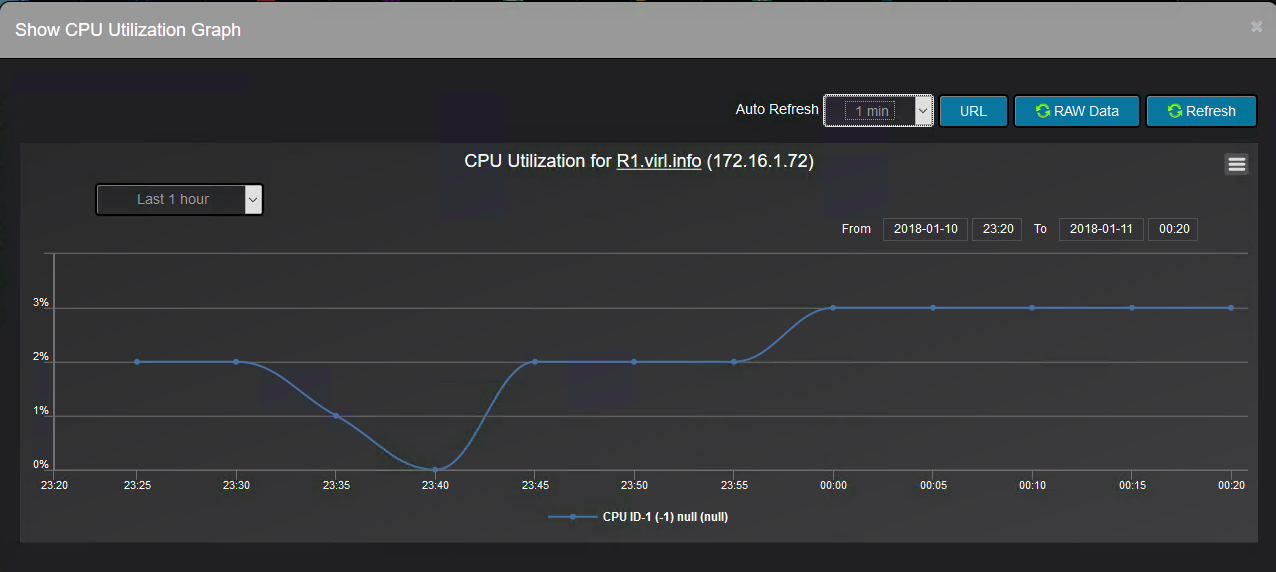
Finally, you can see the CPU utilization:
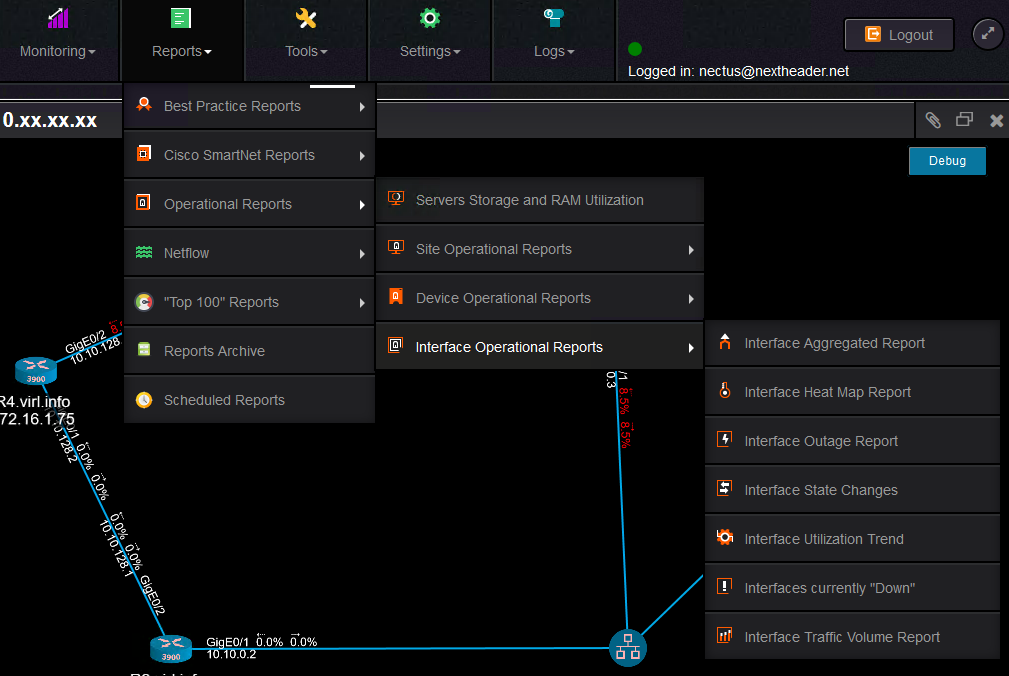
There is another set of reports that one can use to monitor the interfaces. Here you can generate reports for interfaces that went down at one point in time,
for traffic on the interfaces, for the interfaces that are down and even a report that based on previous data utilization information can project the future interface utilization.
And this would be pretty much about how Nectus can dynamically build (L2 and L3) topologies using the information gathered via SNMP and about the
available options to monitor the interfaces and devices from the topology.