Monitoring Scope Utilization on Windows DHCP Servers with Nectus
In this chapter, you’ll learn how to use Nectus to enable and configure DHCP Scopes utilization monitoring on Windows DHCP Servers.
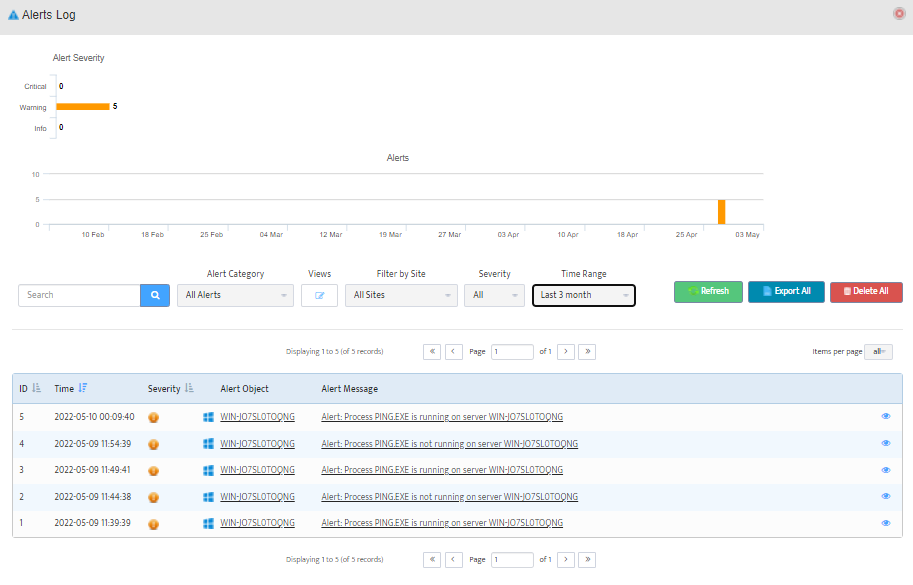
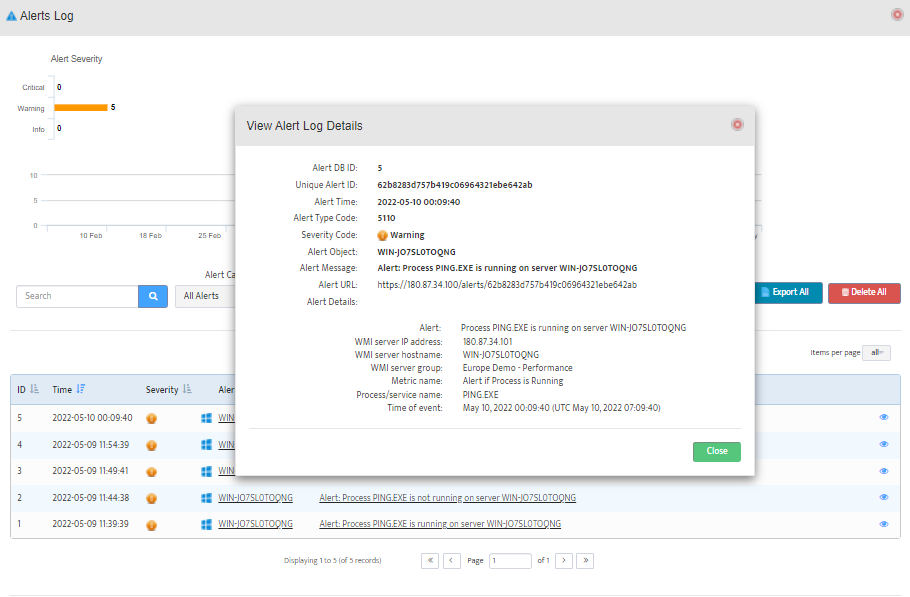
Nectus allows network engineers proactively monitor amount of free IP addresses in DHCP scopes and generate E-mail or Text alerts when number of free IP address falls below preset thresholds.
Nectus can also generate alert when number of free IP address exceeds predefined threshold as it may indicate underlying network operation problems when network devices not able reach DHCP server for leases.
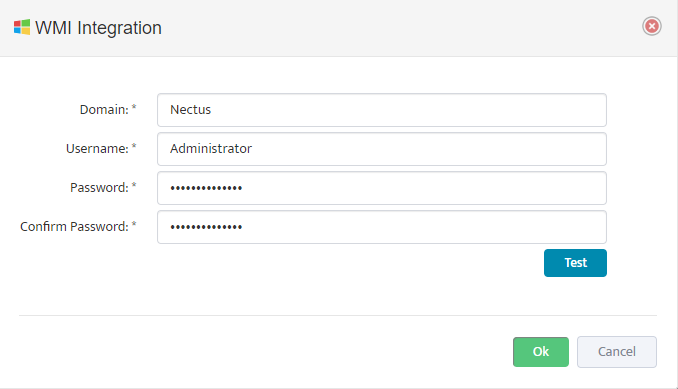
Nectus uses basic WMI interface to collect scope and lease statistics from DHCP servers.
The specific topics we will cover in this chapter are:
- What is WMI?
- Why Monitor DHCP Scopes?
- Creating a DHCP Server Group
- Adding DHCP Server to Server Group
- Creating and Configuring Monitoring Profile
- Assigning Monitoring Profile to Server Group
1. What is WMI?
Nectus uses Windows Server WMI interface to collect basic information about DHCP scopes such as total number of IP addresses and current number of active leases.
WMI (Windows Management Instrumentation) is a set of specifications and interfaces that provides information about the status of local and remote computers running Microsoft Windows. In this chapter we look at how Nectus uses WMI to monitor DHCP Scope Utilization and send alerts based on that information.
Note: WMI is the Microsoft implementation of the Web-Based Enterprise Management (WBEM) standard and the Common Information Model (CIM) standard from the Distributed Management Task Force (DMTF).
2. Why Monitor DHCP Scopes?
Availability of free IP addresses is a critical requirement for modern network. When DHCP scope runs out of addresses users are not able to join your network.
Typical network segments that heavily dependent on DHCP are LAN and Wi-Fi Users.
Several DDOS attack types are specifically targeting DHCP infrastructure and by exhausting DHCP pools with fake lease requests can bring down any network to its knees.
Sometimes regular business growth can cause corresponding grows in IP address utilization and if left undetected can eventual cause an outage and service degradation for DHCP dependent applications.
3. Creating a DHCP Server Group
First step is to create a new Server Group for our DHCP Servers.
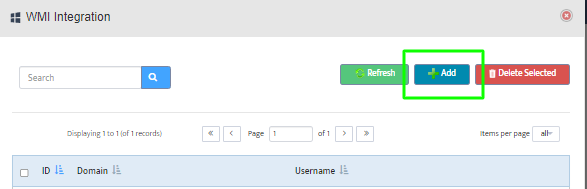
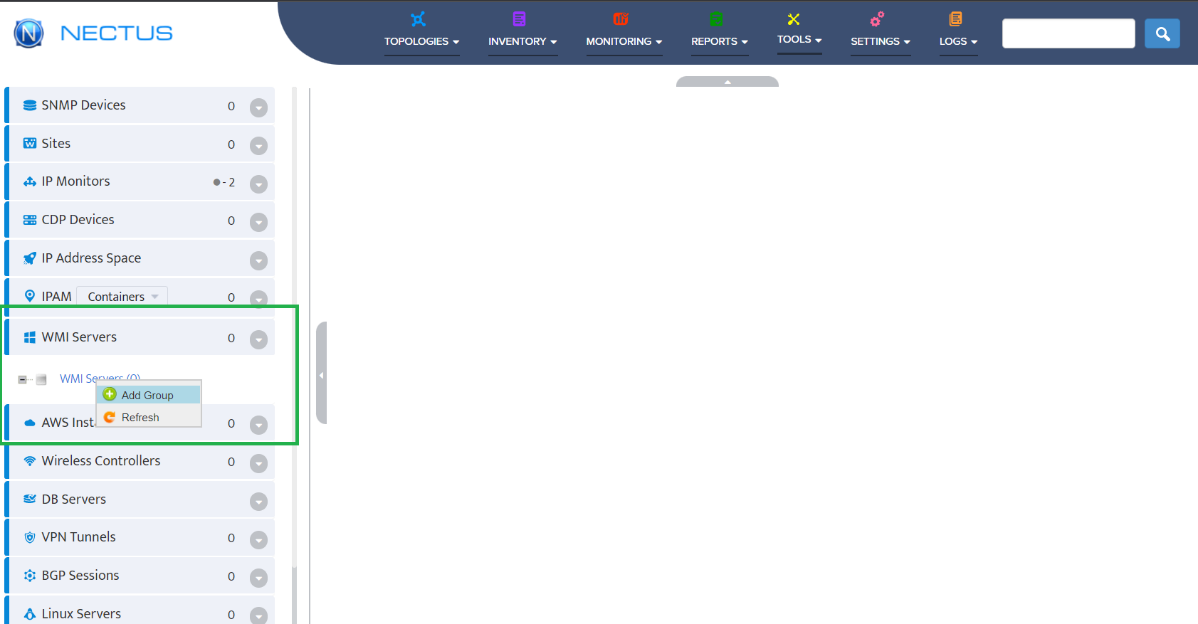
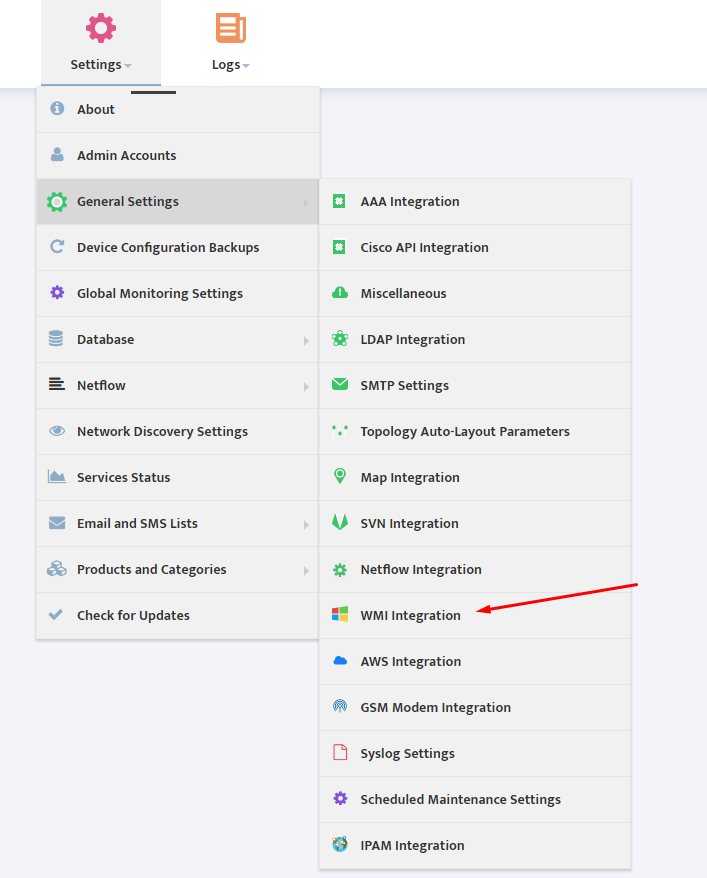
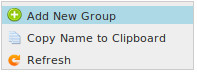
Go to the Nectus Home Screen and select WMI Servers -> WMI Servers. In the menu that appears, click Add New Group.
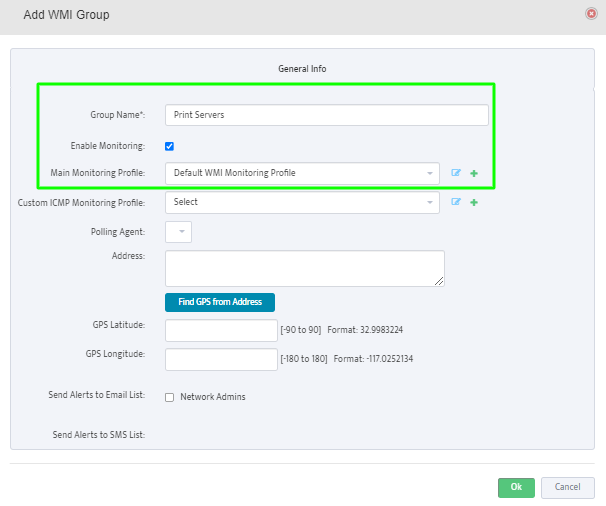
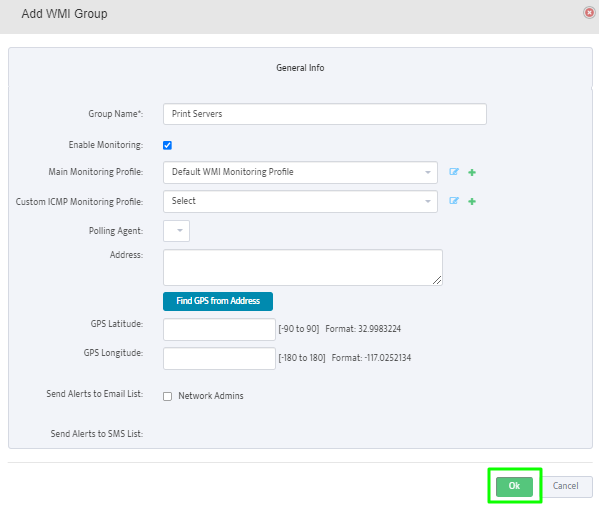
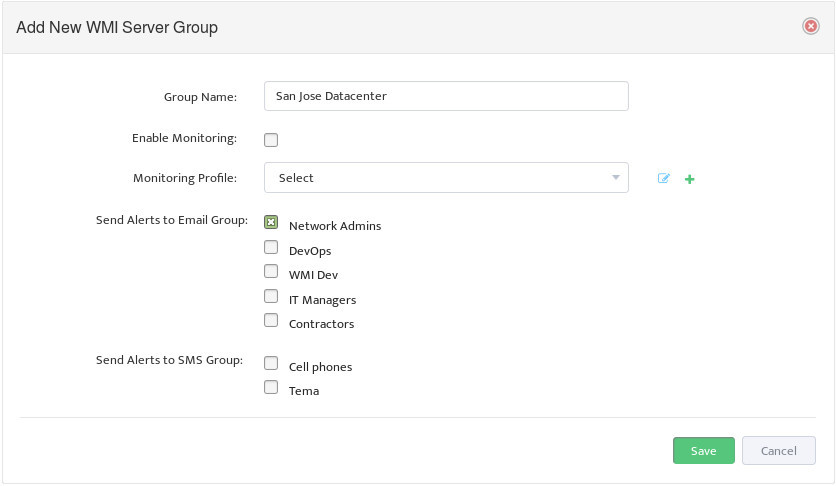
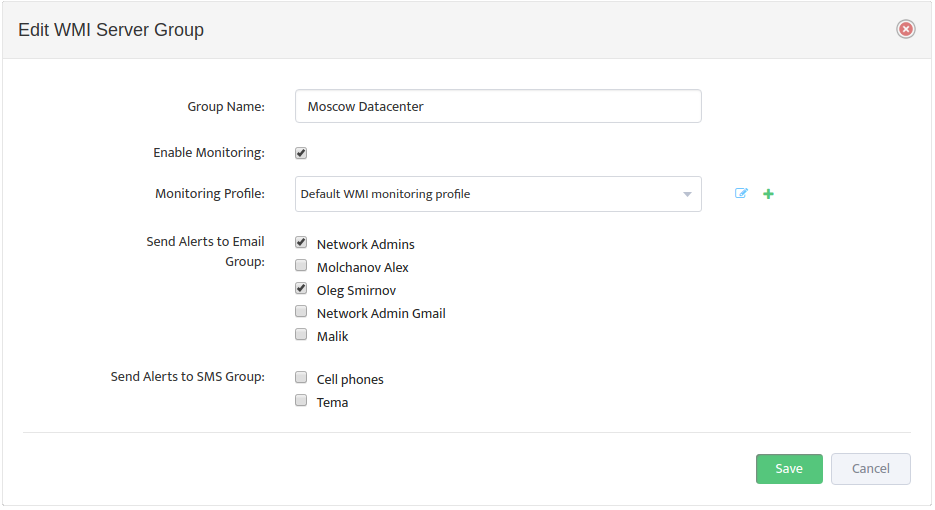
This opens the “Add New WMI Server Group” dialog box.
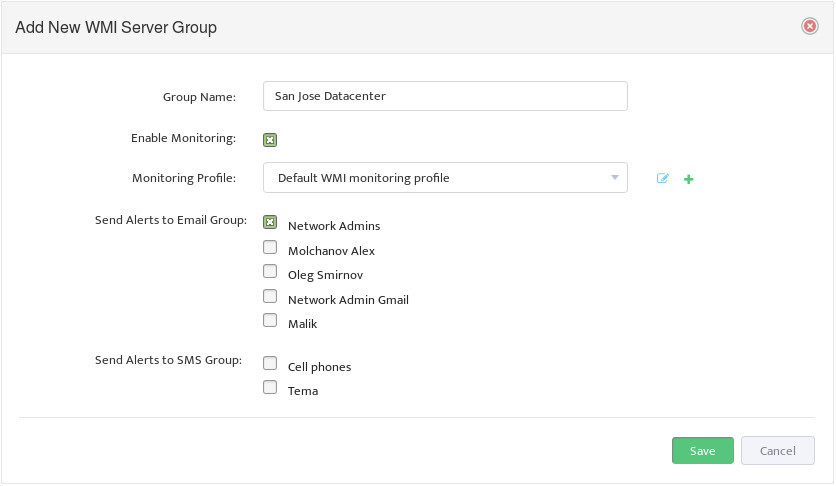
Complete the fields that define the new Group and set Enable Monitoring.
4. Add a DHCP Server to Server Group
Now we need to define our DHCP Server and add those to Server Group.
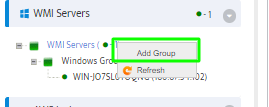
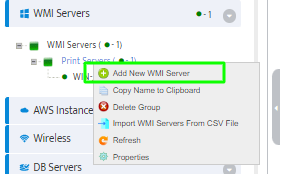
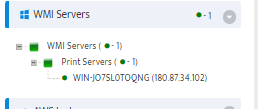
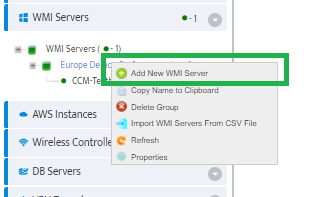
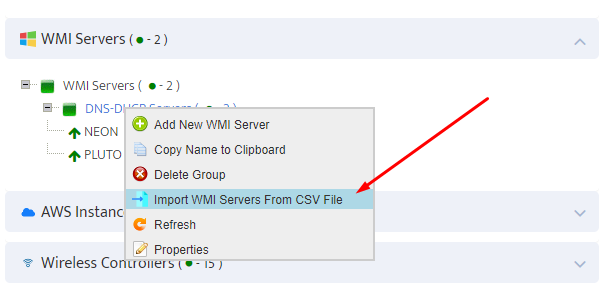
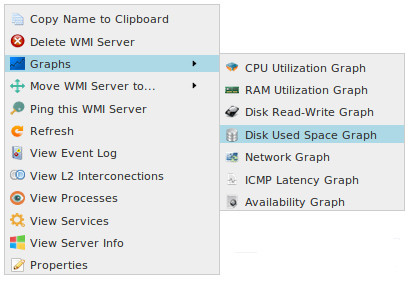
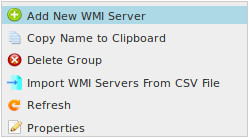
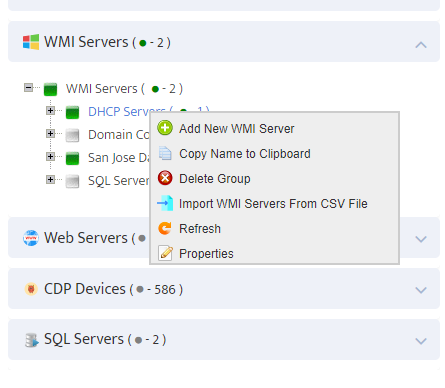
To add a Windows DHCP Server to the Server Group right-click the Group and select Add New WMI Server.
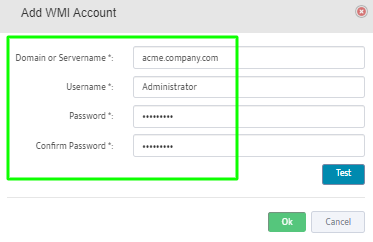
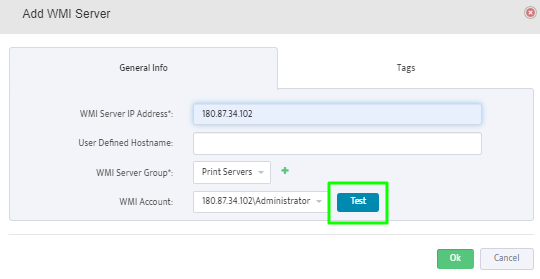
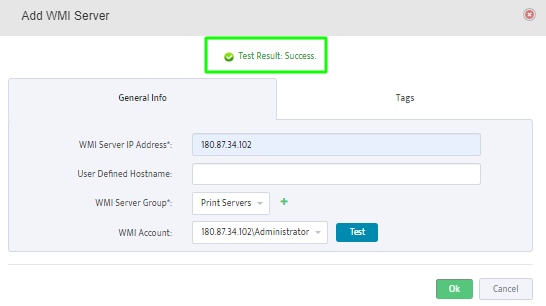
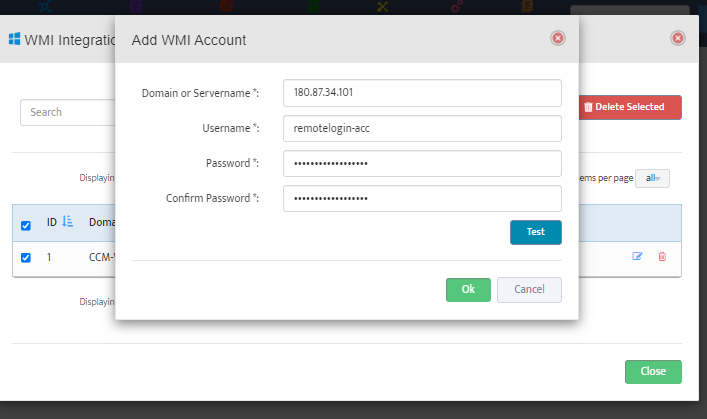
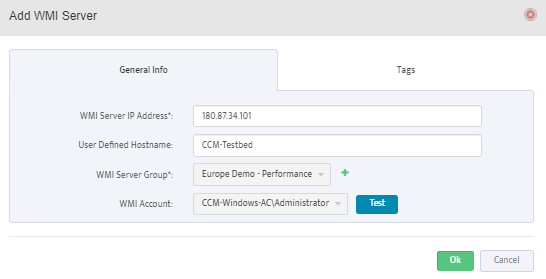
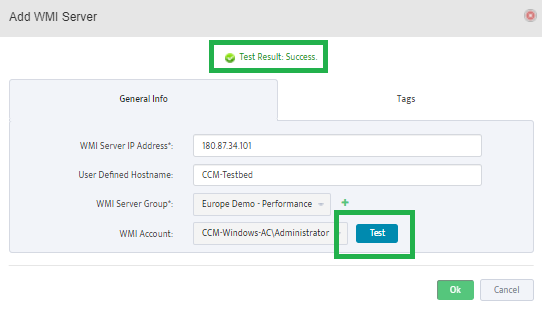
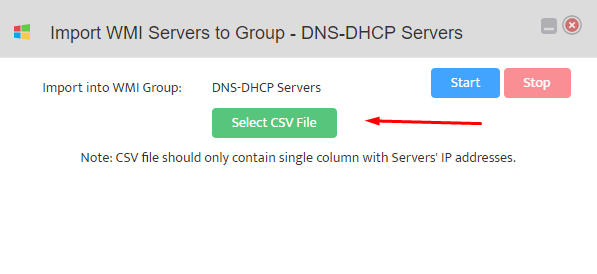
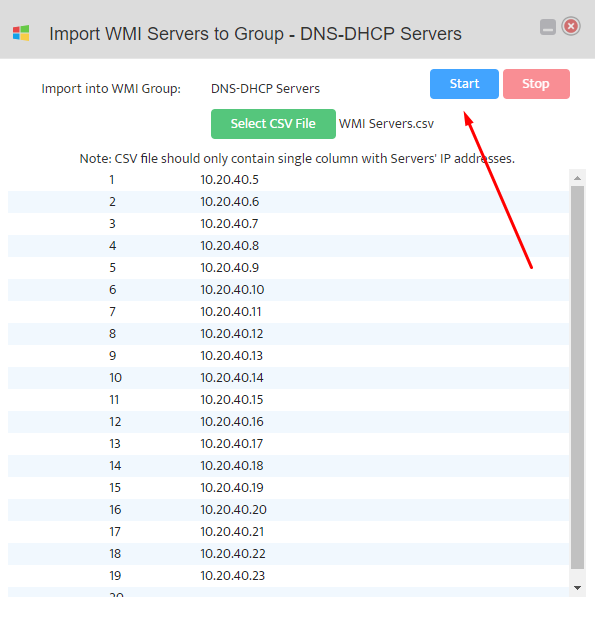
This opens the “Add WMI Server” dialog box.
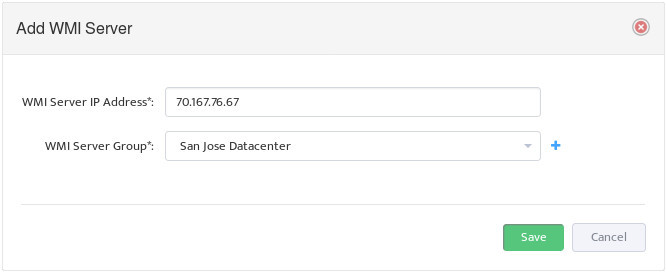
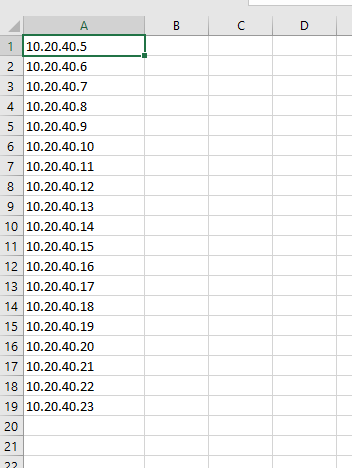
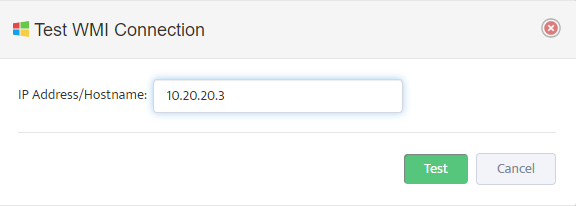
Enter the IP address of the Server you want to add to the Group.
Note: You can move a Server between different Groups by right-clicking the Server and using the Move WMI Server to option.
5. Creating and Configuring Monitoring Profile
Monitoring Profile is a list of Metrics that can be applied to Server Group to tell Nectus which specific metrics must be monitored for given Server Group.
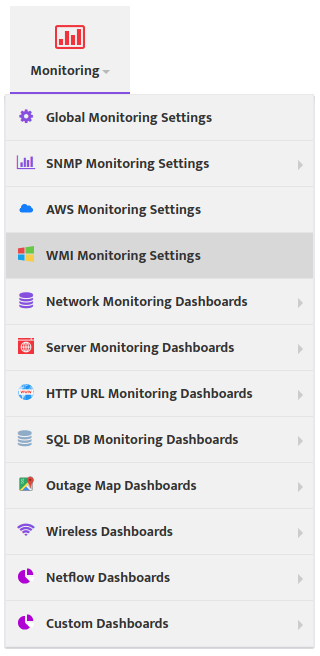
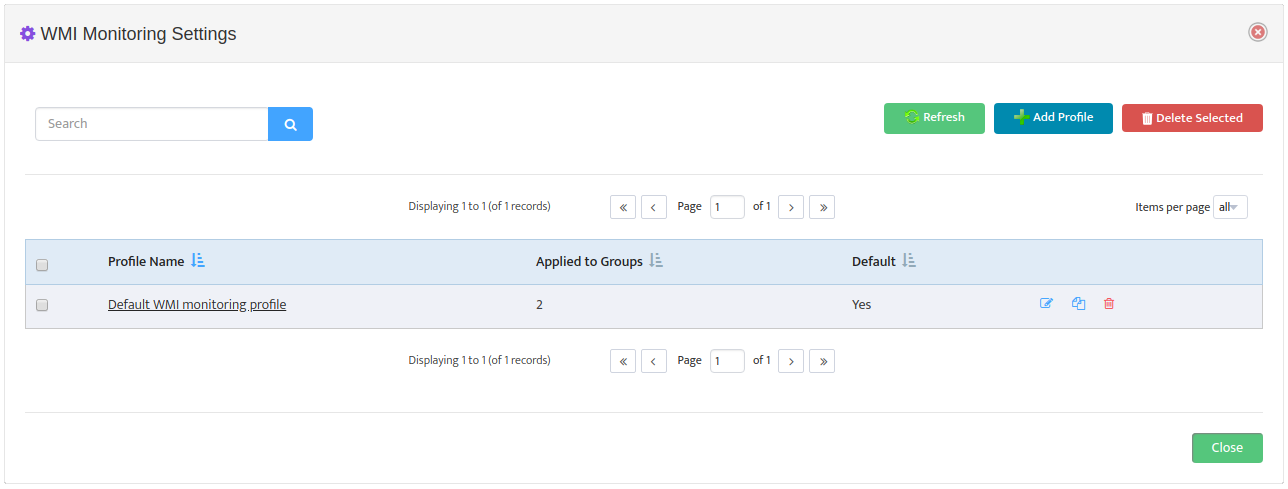
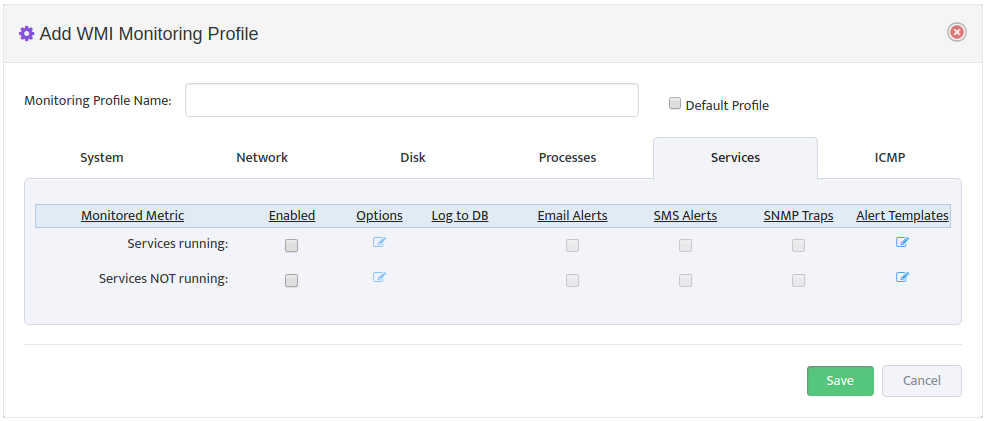
To create new Monitoring Profile to go Monitoring -> WMI Monitoring Settings and press
“Add Profile” button
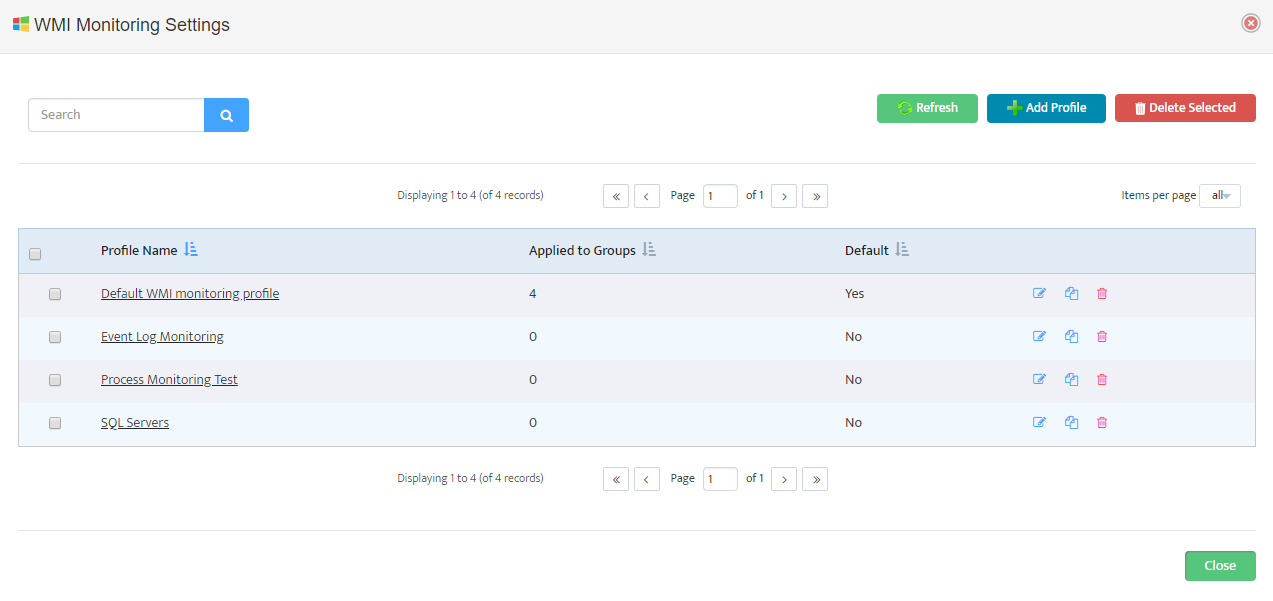
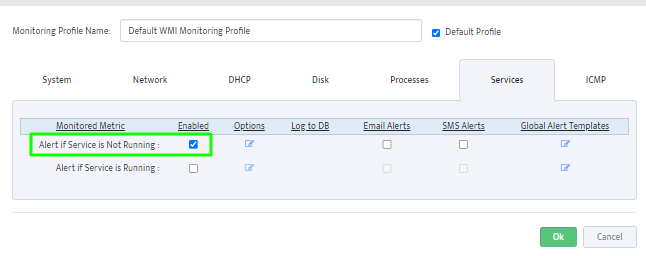
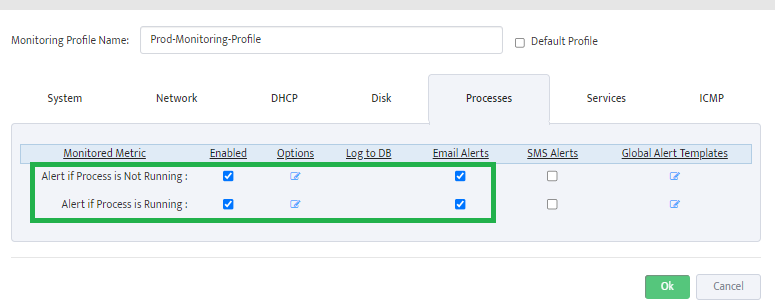
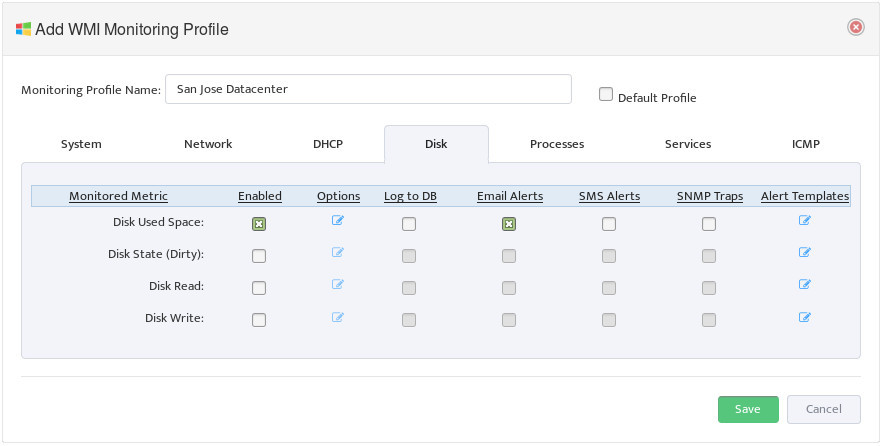
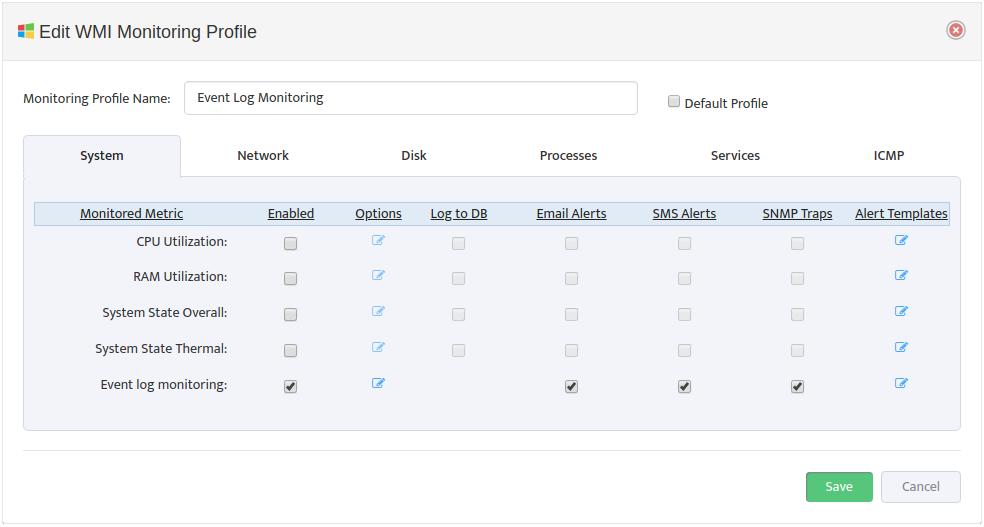
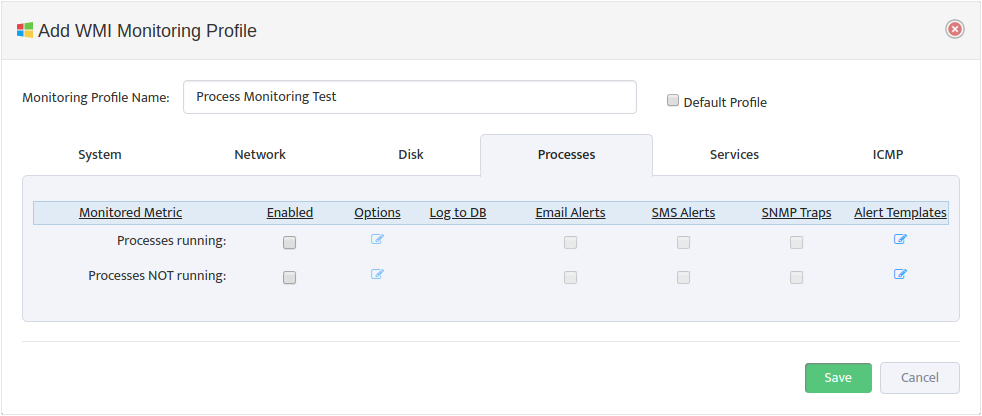
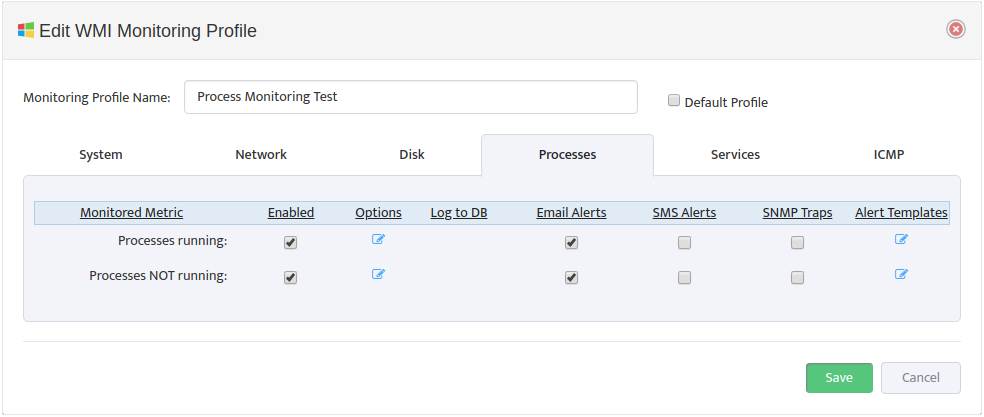
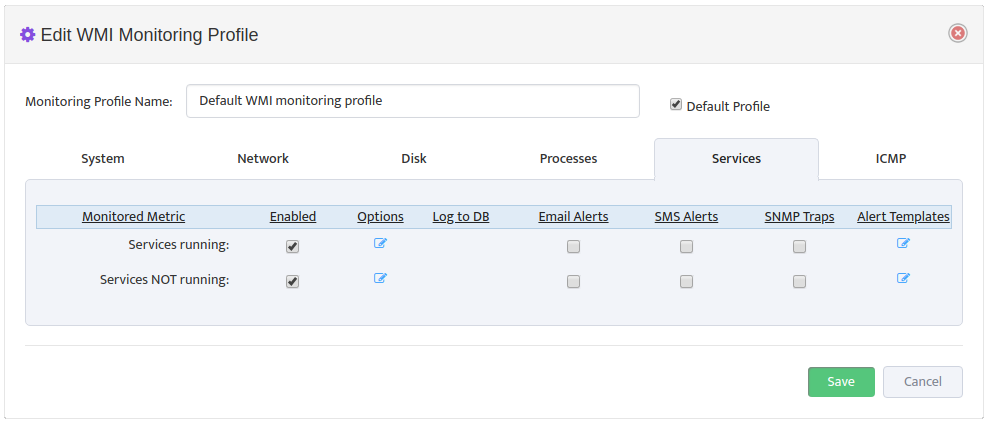
Monitoring Profile Configuration Interface will appear.
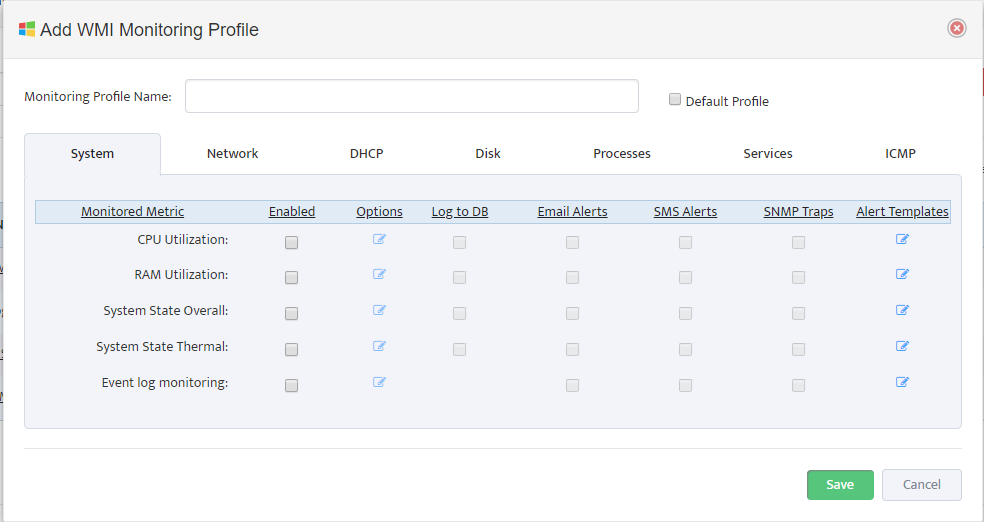
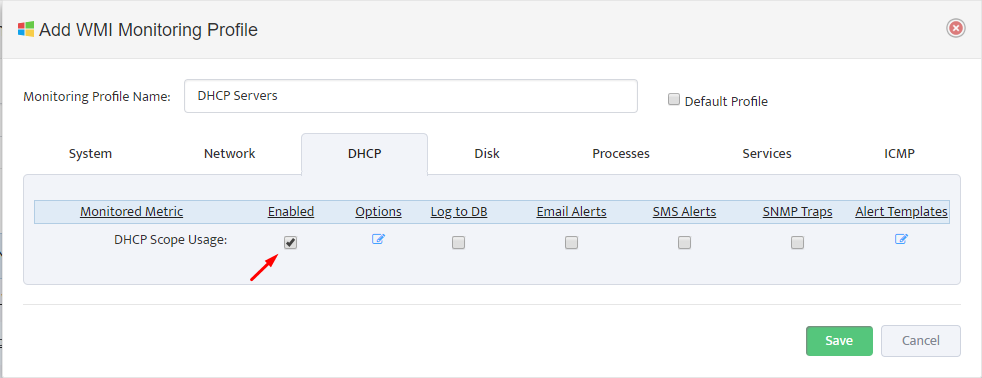
Assign Profile Name and enable “DHCP Scope Usage” check-button on “DHCP” Tab
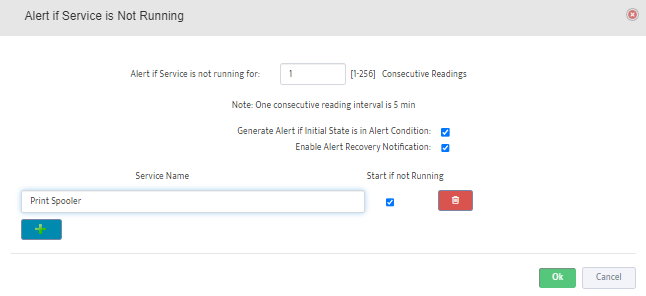
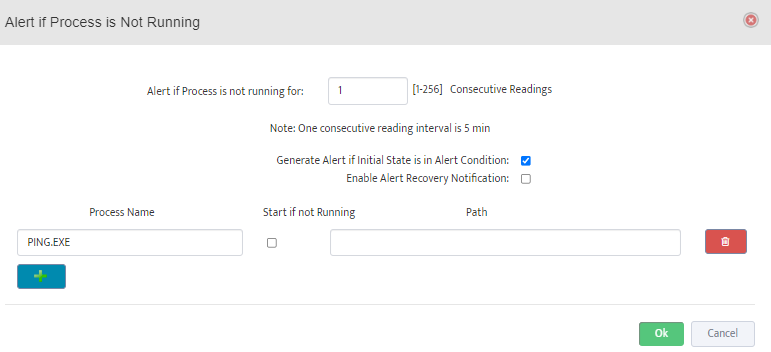
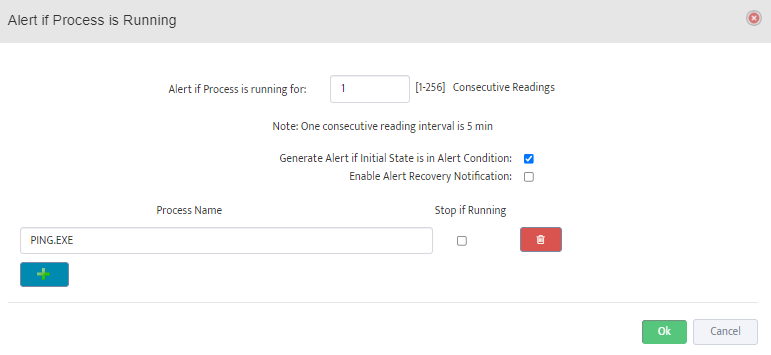
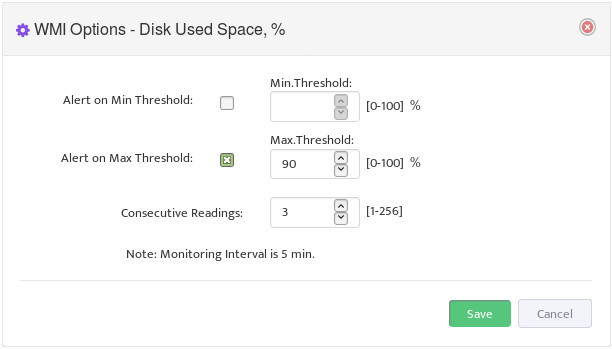
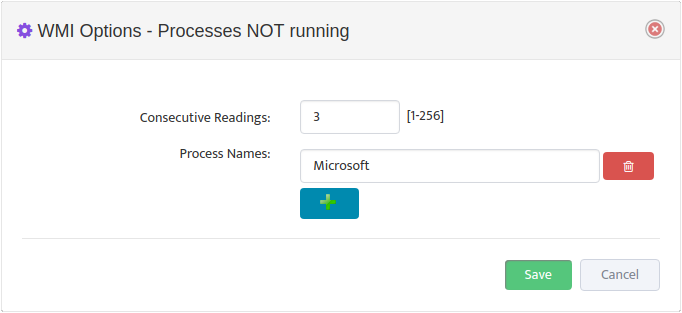
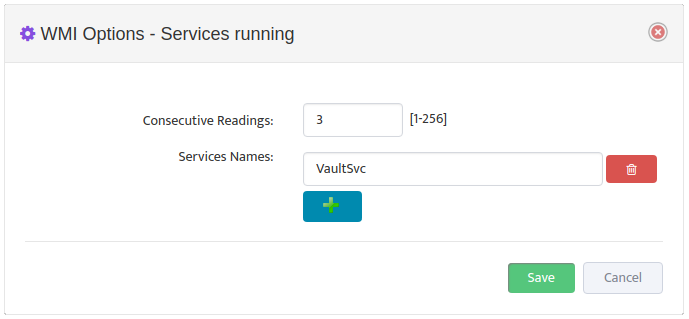
Configure Max/Max Threshold Values for Alerts by pressing on “Options” button
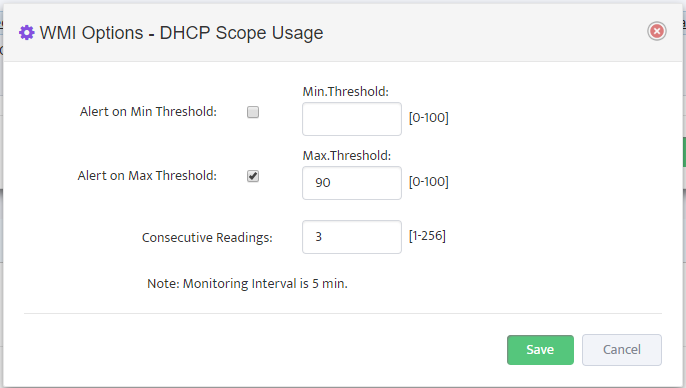
Note: Monitoring Interval is 5 min therefore 3 for “Consecutive Readings” value will trigger Alert
only if Threshold condition are True for 15 minutes.
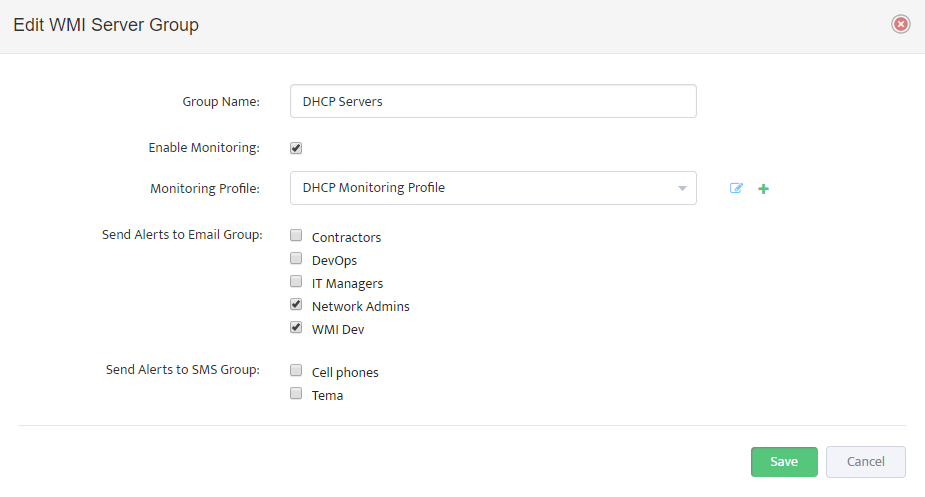
6. Assigning Monitoring Profile to Server Group
Next and the final step is to assign Monitoring Profile to the DHCP Server Group that we created.
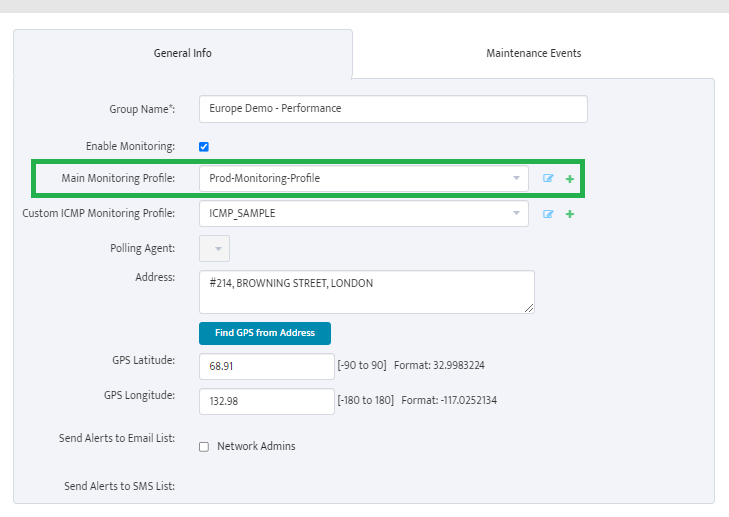
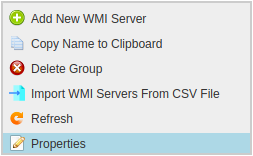
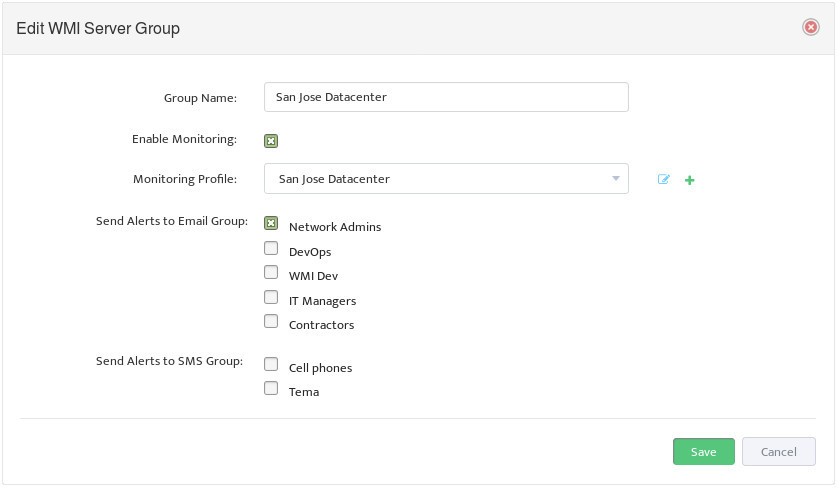
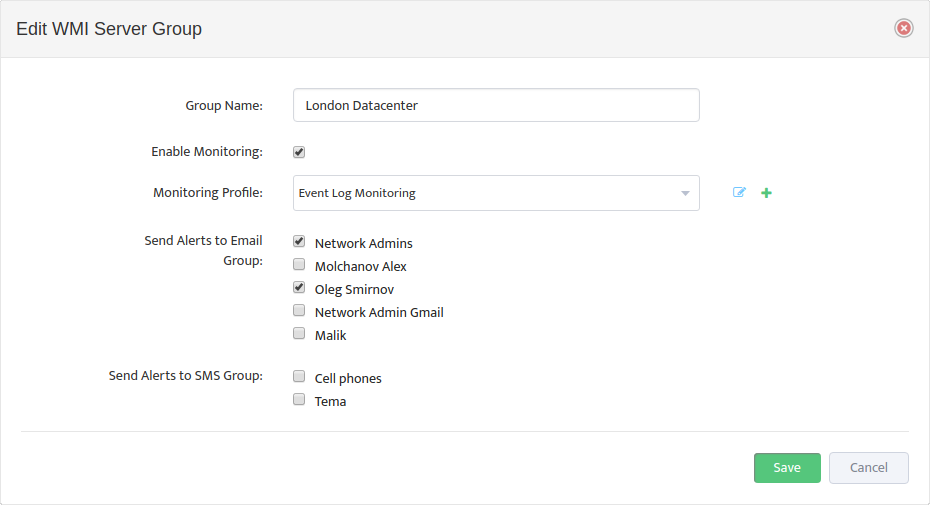
Right Click on DHCP Server Group in left side panel and Select “Properties”
Select Monitoring Profile from the list of available Profiles and Click on “Enable Monitoring” check-button.
We are all set and ready to start proactive monitoring of your DHCP Infrastructure.
Download the best IPAM https://www.nectus5.com/download/