Monitoring Windows Event Log with WMI in Nectus
Monitoring Windows Event Log with WMI
In this chapter, you’ll learn how to use WMI to monitor the Windows Event Log. Nectus lets you create profiles that use WMI to monitor specific Events and to send Alerts related to them.
The specific topics we will cover in this chapter are:
- What is WMI?
- Why Monitor the Windows Event Log?
- Creating a WMI Monitoring Profile
- Configuring Event Log Monitoring
- Assigning a Profile to a WMI Server Group
1. What is WMI?
WMI (Windows Management Instrumentation) is a set of specifications and interfaces that provides information about the status of local and remote computers running Microsoft Windows. In this chapter we look at how Nectus uses WMI to monitor the status of Windows Processes and send Alerts based on that status.
Note: WMI is the Microsoft implementation of the Web-Based Enterprise Management (WBEM) standard and the Common Information Model (CIM) standard from the Distributed Management Task Force (DMTF).
2. Why Monitor the Windows Event Log?
There are many reasons to monitor the Windows Event Log. One of the most important is preventing security breaches. Events that show a configuration change, a failure, or an unexpected login attempt could be triggered by an attack on the server.
3. Creating a WMI Monitoring Profile
To create a WMI Monitoring Profile go to the Nectus Home Screen and select Monitoring -> WMI Monitoring Settings.
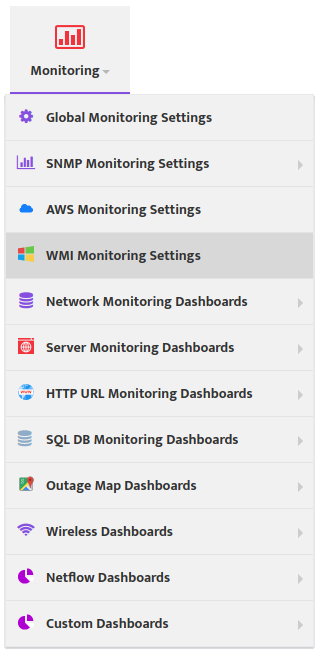
This opens the “WMI Monitoring Settings” dialog box.
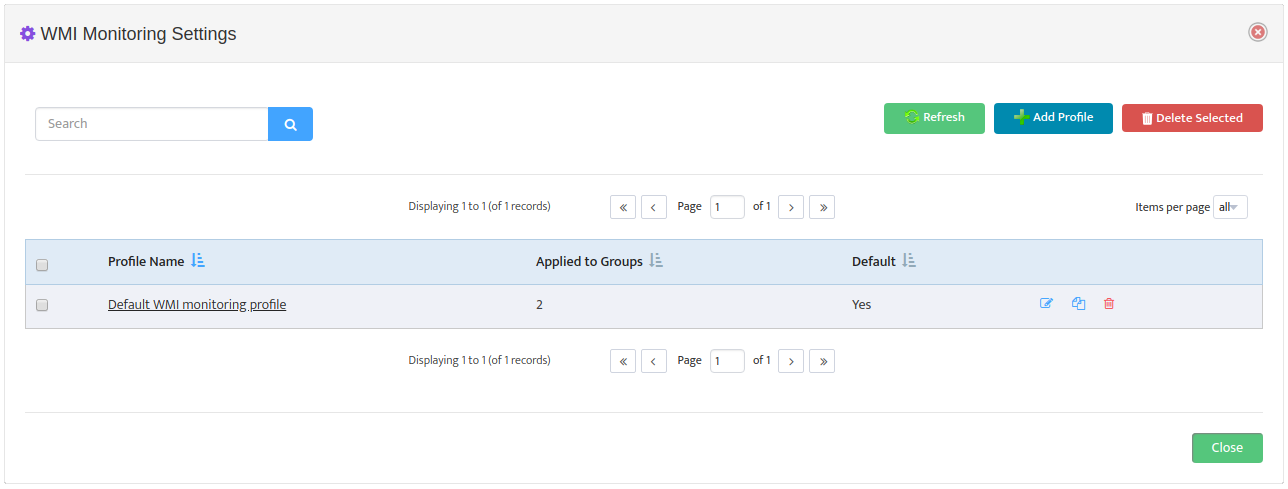
Click Add Profile -> System.

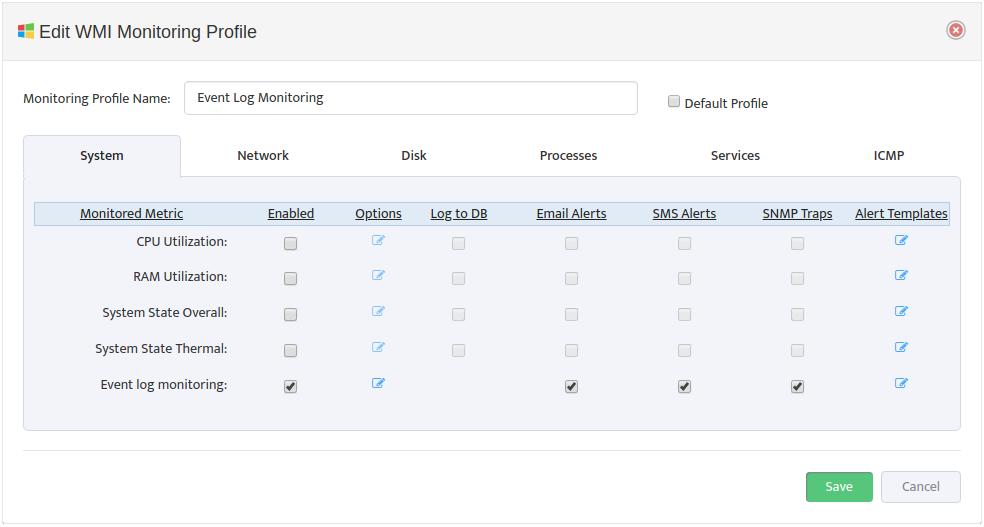
Create a new Profile by entering the Monitoring Profile Name and checking the Event log monitoring Enabled box. In addition, check the types of Alerts you want to send. See Section 4, “Editing a WMI Monitoring Profile” for details on how to specify which Events you want to monitor and how you want to be alerted.
Check the Default Profile box if you want to make this the new default WMI Monitoring profile.
4. Configuring Event Log Monitoring
To configure Event Log monitoring, open the “WMI Monitoring Settings” dialog box and select the Edit Profile icon for the Profile you want to edit. In “Edit WMI Monitoring Profile” dialog box that appears select the System tab.
4.1 Editing Options
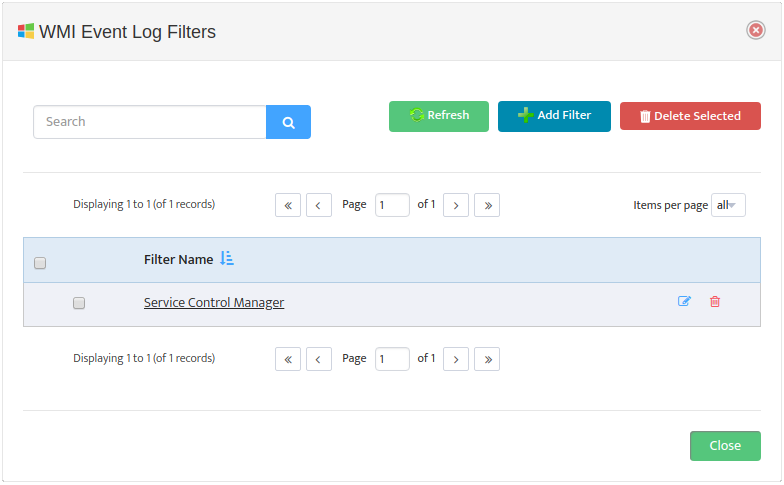
Select the Event log monitoring Options icon to open the “WMI Event Log Filters” dialog box.
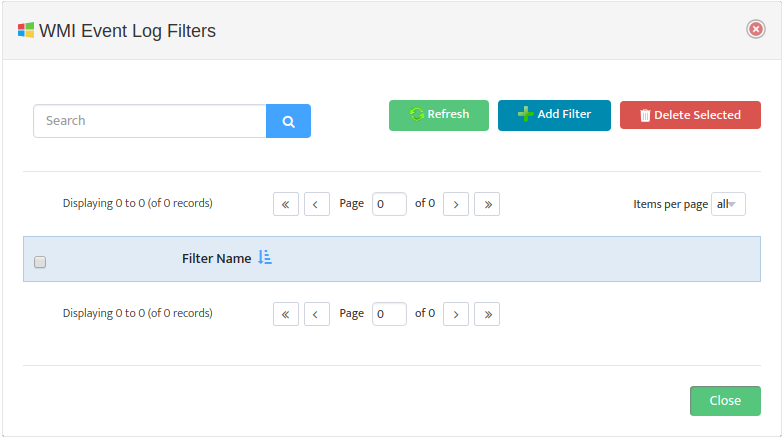
Click Add Filter to open the “Add Event Log Filter” dialog box.
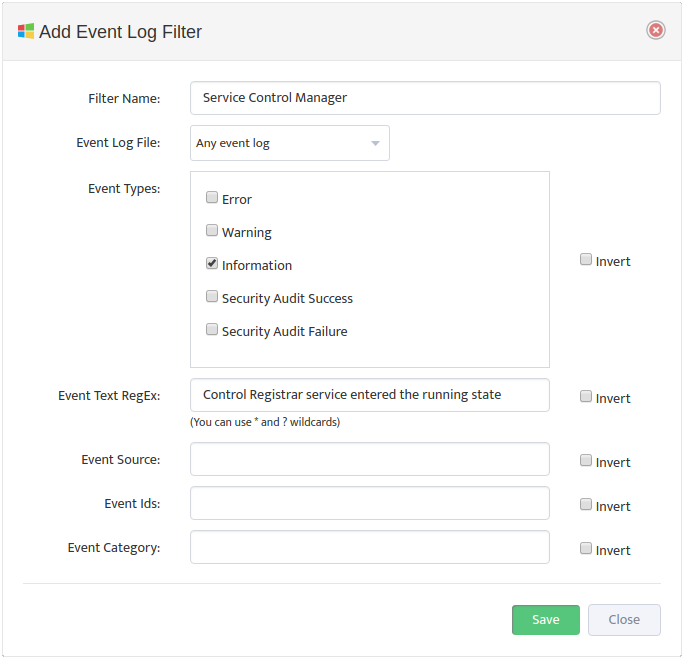
Enter the Filter Name and optionally select a specific Event Log File to monitor. Fill out the rest of the fields as necessary to specify the Event you want to monitor. The new filter will appear in the “WMI Event Log Filters” dialog box.
4.2 Editing Alerts and Templates
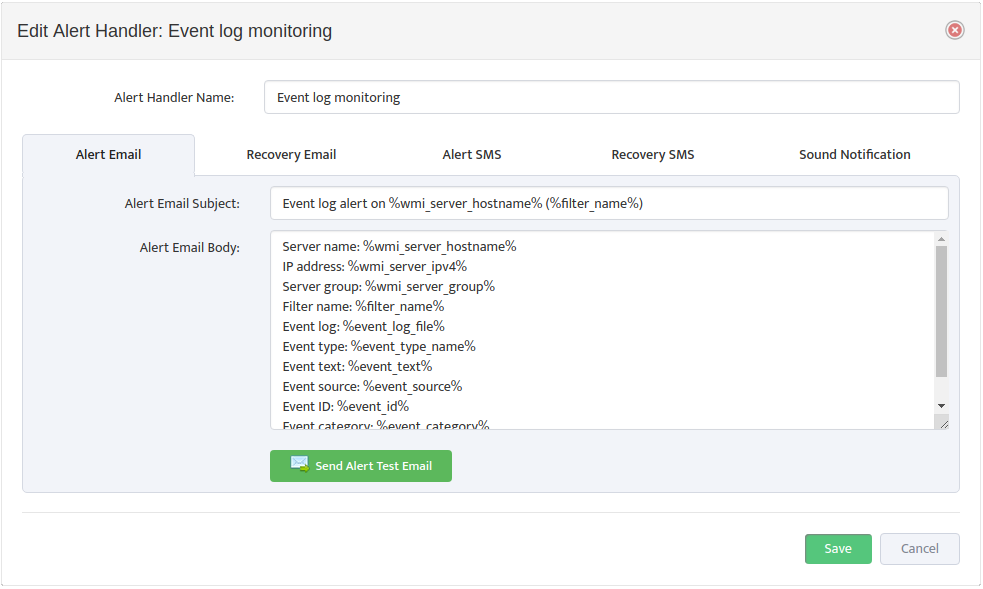
In the System tab of the “Edit WMI Monitoring Profile” dialog box, check or clear the types of Alerts to send for the Events. To edit the format of the Alerts, open the “Edit Alert Handler” dialog box by clicking the Edit Alert Templates icon.
5. Assigning a Profile to a WMI Server Group
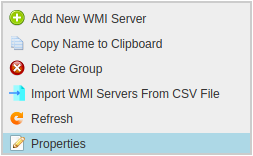
In the WMI Servers Panel on the Nectus Home screen, open the WMI Servers list. Right-click a WMI Server Group and select Properties.
This opens the “Edit WMI Server Group” dialog box.
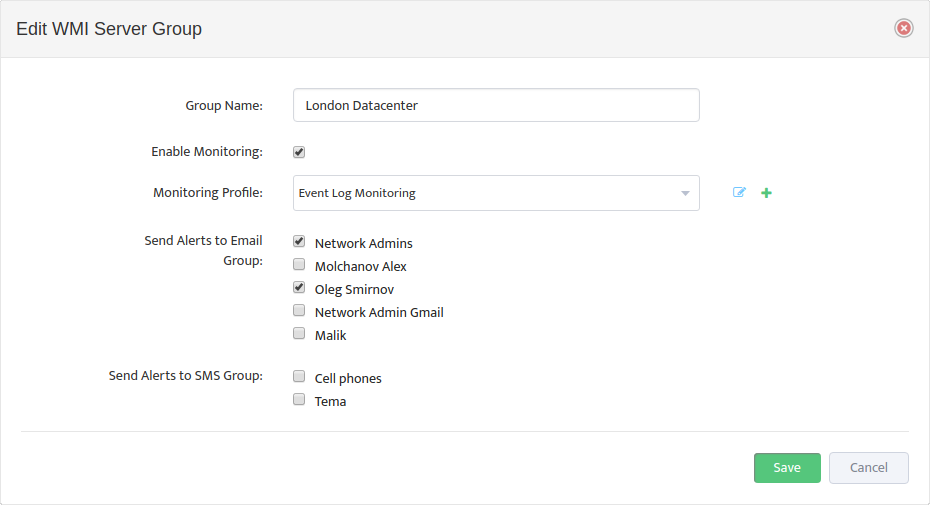
Check the Enable Monitoring box, then select the WMI Monitoring Profile to use from the Monitoring Profile drop-down list, and specify which groups will receive the Alerts.
The icons to the right of the Monitoring Profile list allow you to edit a Profile or add a new Profile directly from here.