Monitoring Windows Server Storage Utilization with Nectus
Monitoring Windows Server Storage Utilization with Nectus
In this chapter, you’ll learn how to use WMI to monitor Windows Server Storage Utilization. Nectus lets you create Profiles that specify which Servers to monitor with WMI and to send Alerts related to them. It also provides graphs of Server Utilization over time.
The specific topics we will cover in this chapter are:
- What is WMI?
- Why Monitor Windows Server Storage Utilization?
- Creating a WMI Server Group
- Adding a Server to the WMI Server Group
- Creating and Configuring a WMI Monitoring Profile
- Assigning a Profile to the WMI Server Group
- Viewing a Storage Utilization Graph
1. What is WMI?
WMI (Windows Management Instrumentation) is a set of specifications and interfaces that provides information about the status of local and remote computers running Microsoft Windows. In this chapter we look at how Nectus uses WMI to monitor the Storage Utilization on Windows Servers and send Alerts based on that information.
Note: WMI is the Microsoft implementation of the Web-Based Enterprise Management (WBEM) standard and the Common Information Model (CIM) standard from the Distributed Management Task Force (DMTF).
2. Why Monitor Windows Server Storage Utilization?
Monitoring when Storage Utilization goes outside of the expected Thresholds alerts you to various problems. For example, exceeding the Maximum Threshold could indicate that a Server needs a larger disk, or that some other application is using space on the disk. Utilization below the Minimum Threshold could indicate that data is not being received by the Server, or a problem is keeping the data from being written to the disk.
3. Creating a WMI Server Group
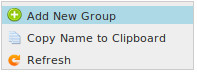
To create a WMI Server Group open the WMI Servers Panel on the Nectus Home Screen. Right-click the WMI Servers list. In the menu that appears, click Add New Group.
This opens the “Add New WMI Server Group” dialog box.
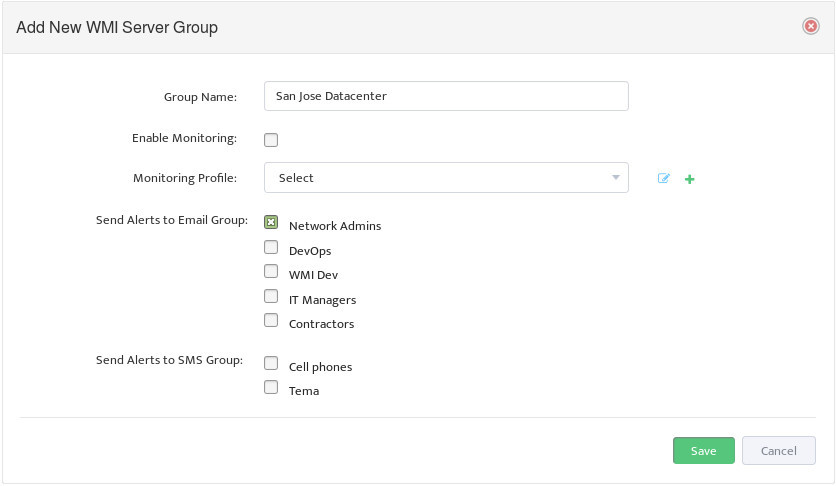
Enter a Group Name, then select the Email Groups and SMS Groups that will receive Alerts.
4. Adding a Server to the WMI Server Group
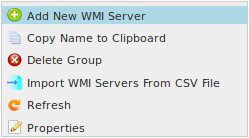
To add a Windows Server to the WMI Server Group right-click the Group and select Add New WMI Server.
This opens the “Add WMI Server” dialog box.

Enter the IP address of the Server you want to add to the Group. Alternately, you can move a Server from its current Group to this Group by right-clicking the Server and using the Move WMI Server to option.
5. Creating and Configuring a WMI Monitoring Profile
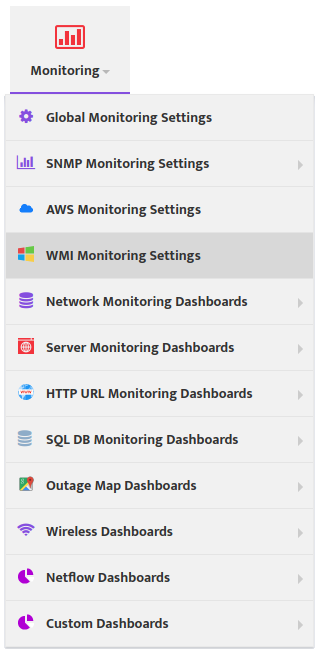
To create a WMI Monitoring Profile go to the Nectus Home Screen and select Monitoring -> WMI Monitoring Settings.
This opens the “WMI Monitoring Settings” dialog box.
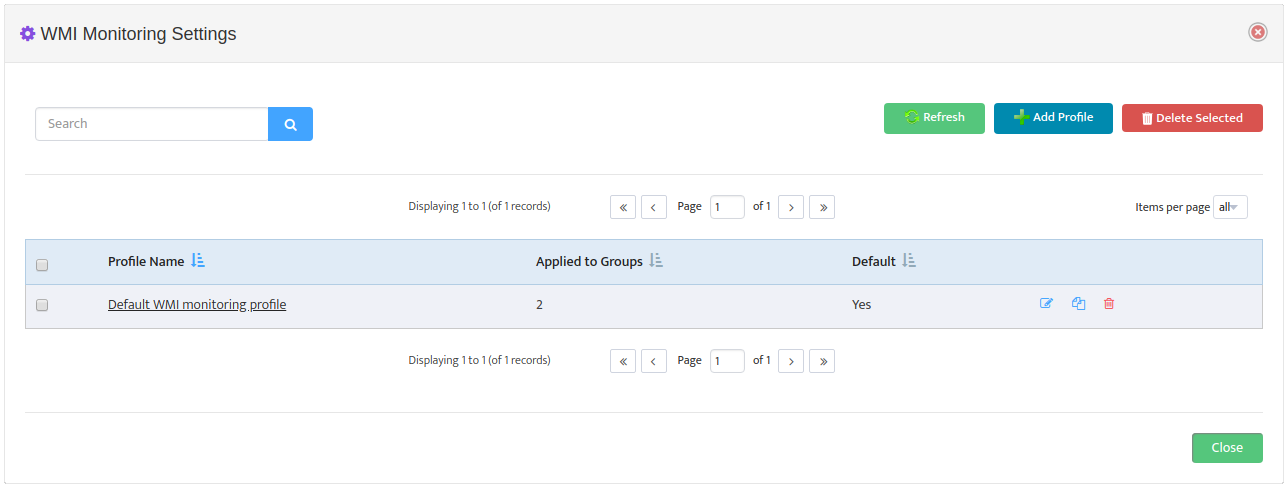
Click Add Profile -> Disk.
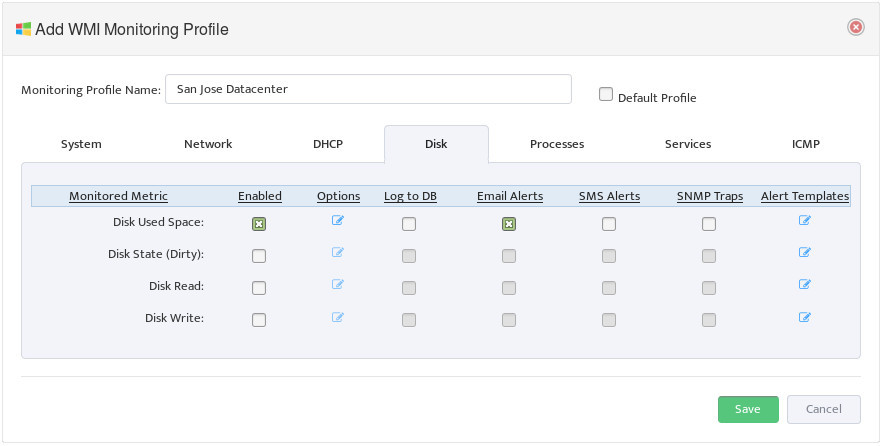
Enter the Monitoring Profile Name and check the Enabled box next to the Disk Used Space metric. Check the types of Alerts you want the Profile to send.
Check the Default Profile box if you want to make this the new default WMI Monitoring Profile.
5.1 Editing Disk Used Space Options
Select the Disk Used Space Options icon to open the “WMI Options – Disk Used Space, %” dialog box.
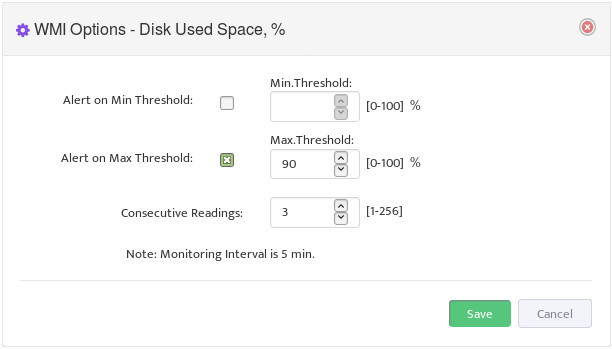
Set the Alert Thresholds you want to monitor, as well as the number of Consecutive Readings that a Threshold must be exceeded before triggering an alert. Nectus checks the thresholds every 5 minutes, so setting Consecutive Readings to 3 means a value would need to exceed the assigned Threshold for 15 minutes before triggering an alert.
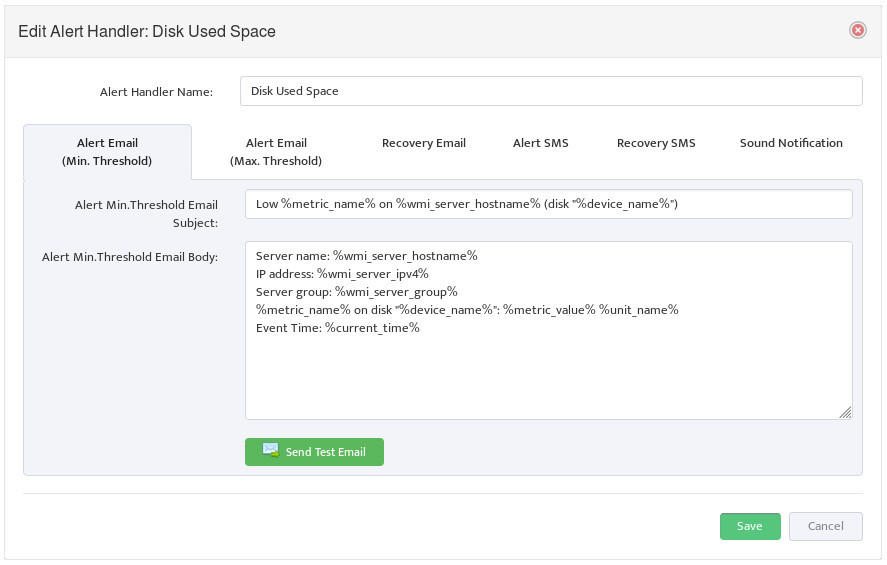
5.2 Editing Disk Used Space Alert Templates
To edit the format of Alerts return to the Disk tab of the “Add WMI Monitoring Profile” dialog box. Click the Disk Used Space Alert Templates icon to open the “Edit Alert Handler” dialog box.
6. Assigning a Profile to the WMI Server Group
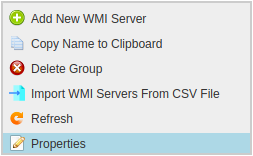
In the WMI Servers Panel on the Nectus Home screen, open the WMI Servers list. Right-click the WMI Server Group and select Properties.
This opens the “Edit WMI Server Group” dialog box.
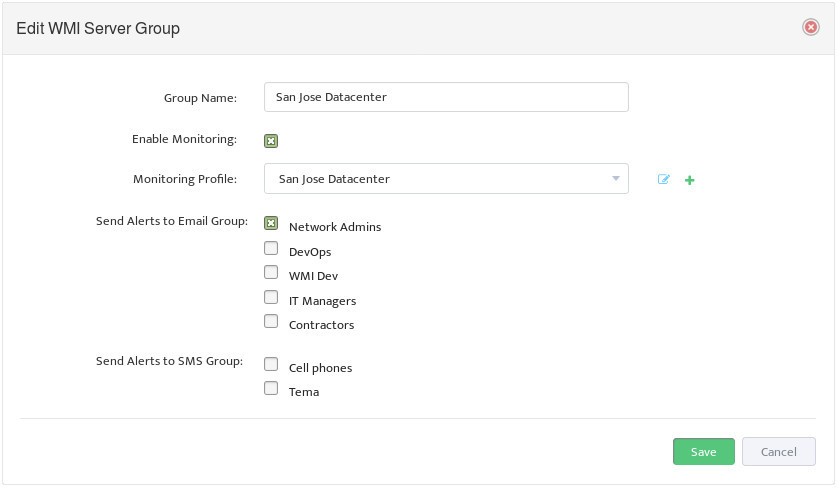
Select the WMI Monitoring Profile to use from the Monitoring Profile drop-down list.
Check the Enable Monitoring box to begin monitoring the Server Group using this Monitoring Profile.
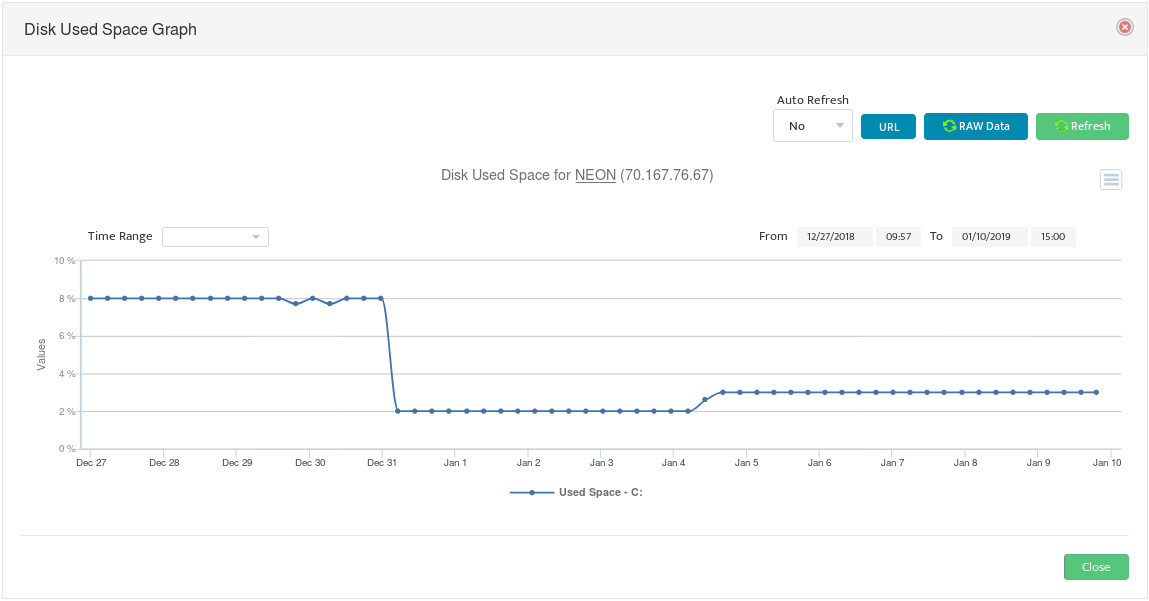
7. Viewing a Storage Utilization Graph
To view a graph of Storage Utilization over time, right-click the Server you want information on and select Disk Used Space Graph.
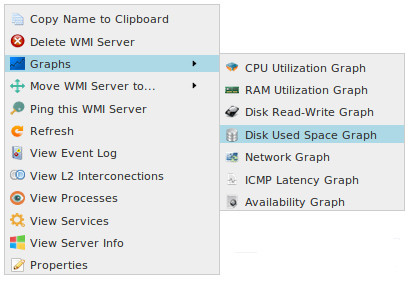
This opens a “Disk Used Space Graph” which displays the changes in Storage Utilization over time.