Visualizing Network Topology
In this chapter, you’ll learn how to generate a map of the L2 Topology for your site. An L2 Topology shows the physical connections between devices, which can be extremely useful for maintenance and troubleshooting. The topology can display real-time up/down status information along with other relevant information about the site.
The specific topics we will cover in this chapter are:
- Generating an L2 Topology
- Manipulating the L2 Topology
- Changing L2 Topology Settings
Generating an L2 Topology
You can generate an L2 Topology for any site in just a few steps. The devices that appear in this topology are those that were found during the nightly site discovery operation.
1.1 Generate the L2 Topology
Follow these steps to generate the L2 Topology for a site:
- In the Sites Panel on the Nectus Home Screen, open Sites and right-click the Site you want to work on.
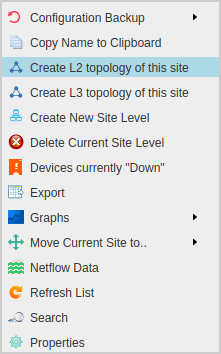
- Click Create L2 topology of this site to open the Generate Topology dialog.
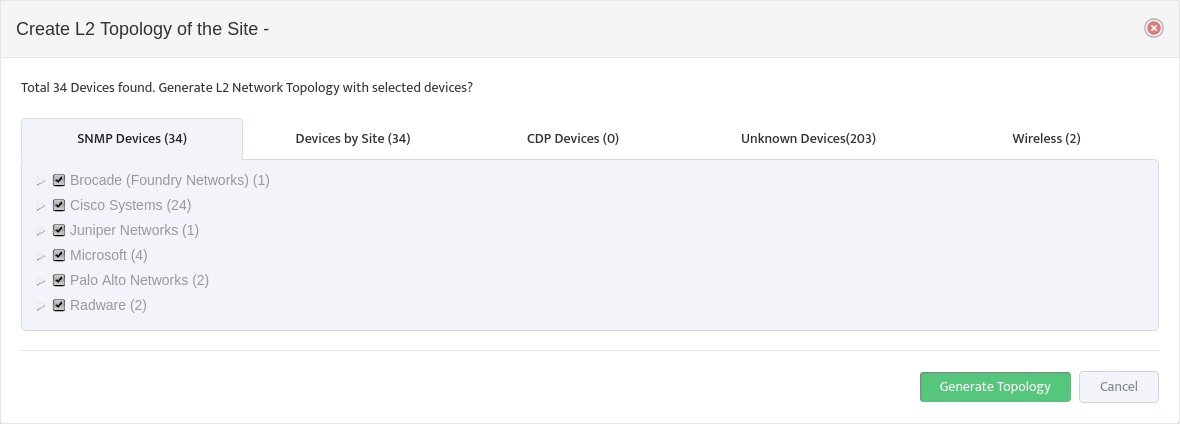
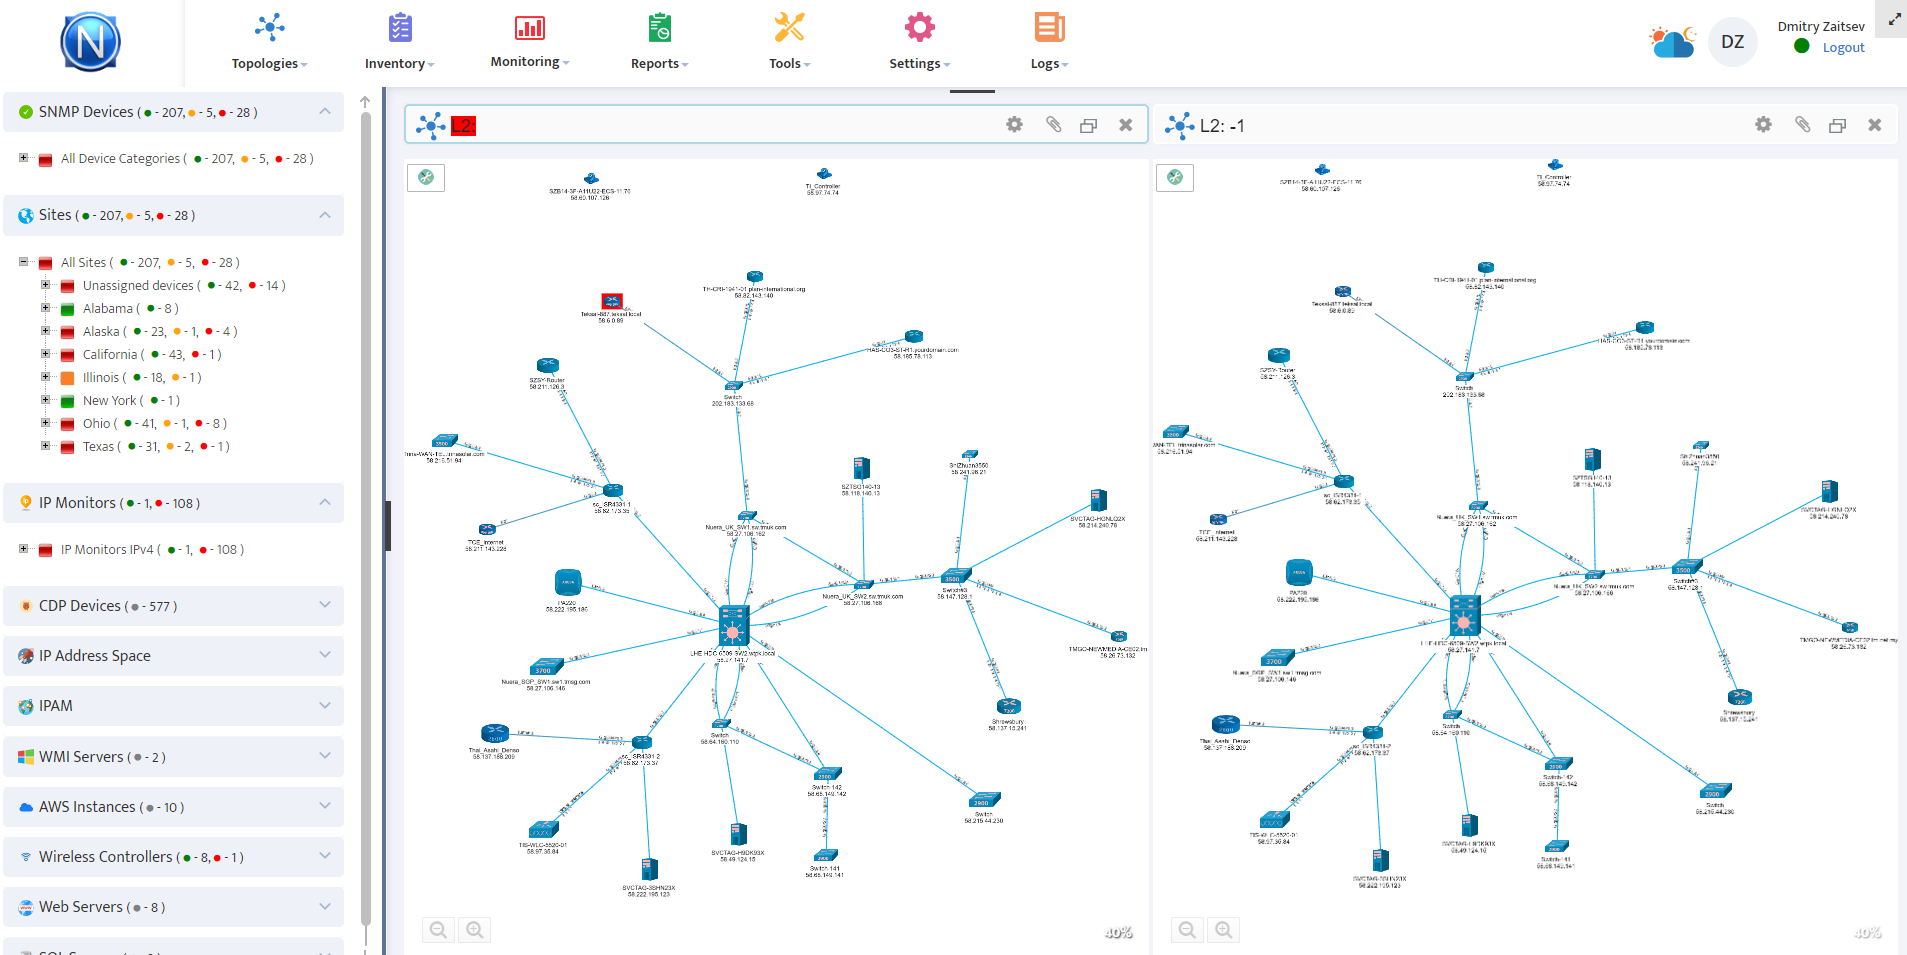
- Select the devices you want to appear in the topology then click Generate Topology. After a moment Nectus displays the site’s L2 Topology.
Manipulating the L2 Topology
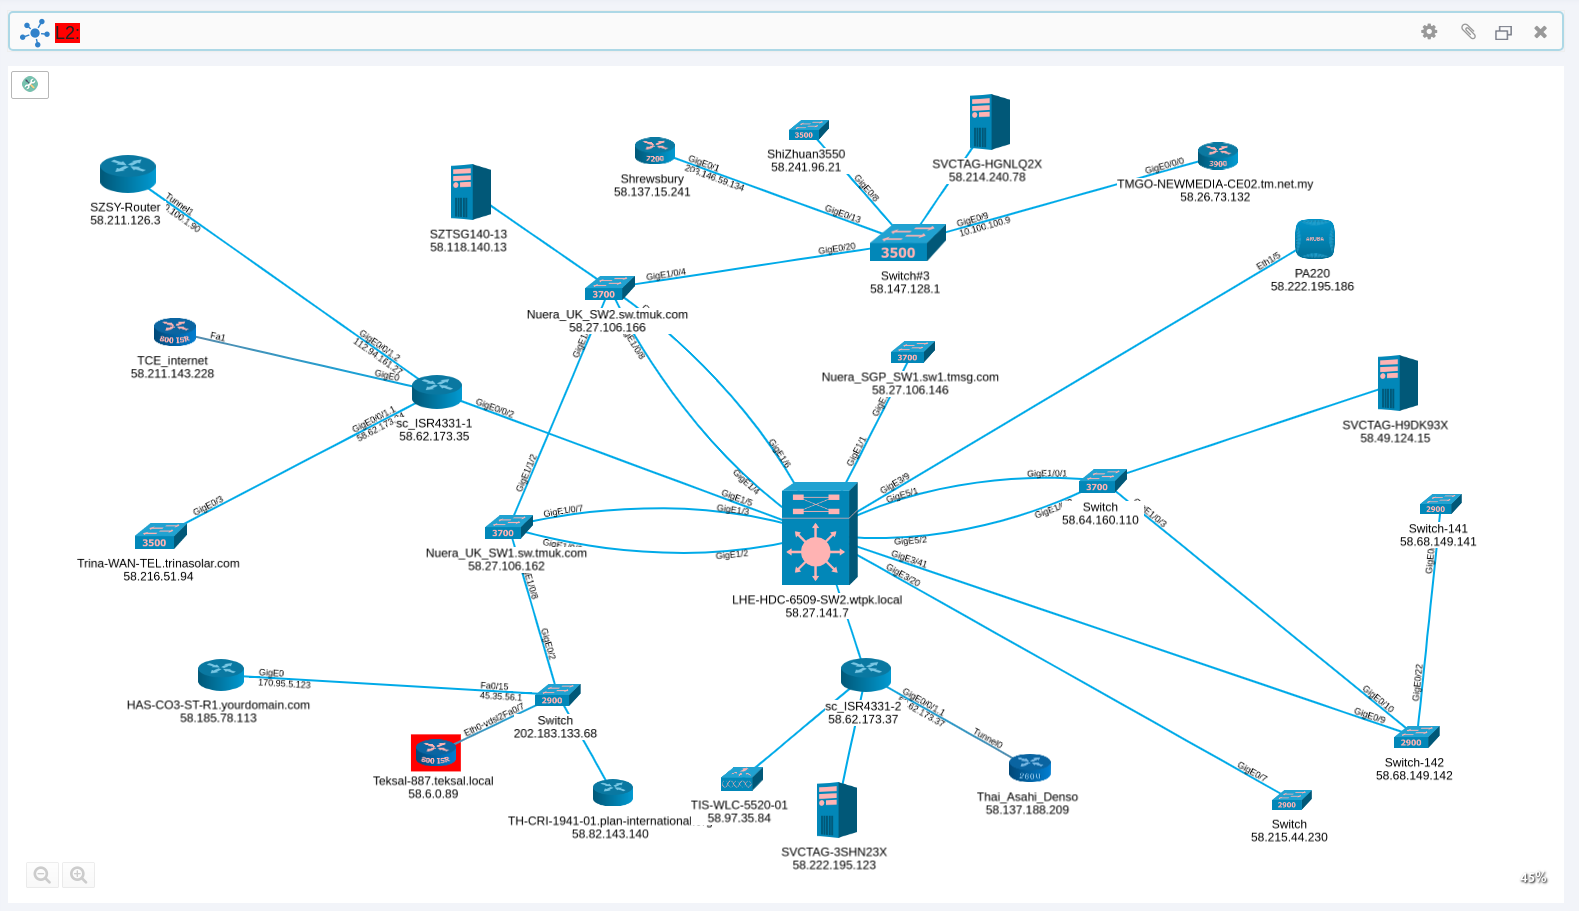
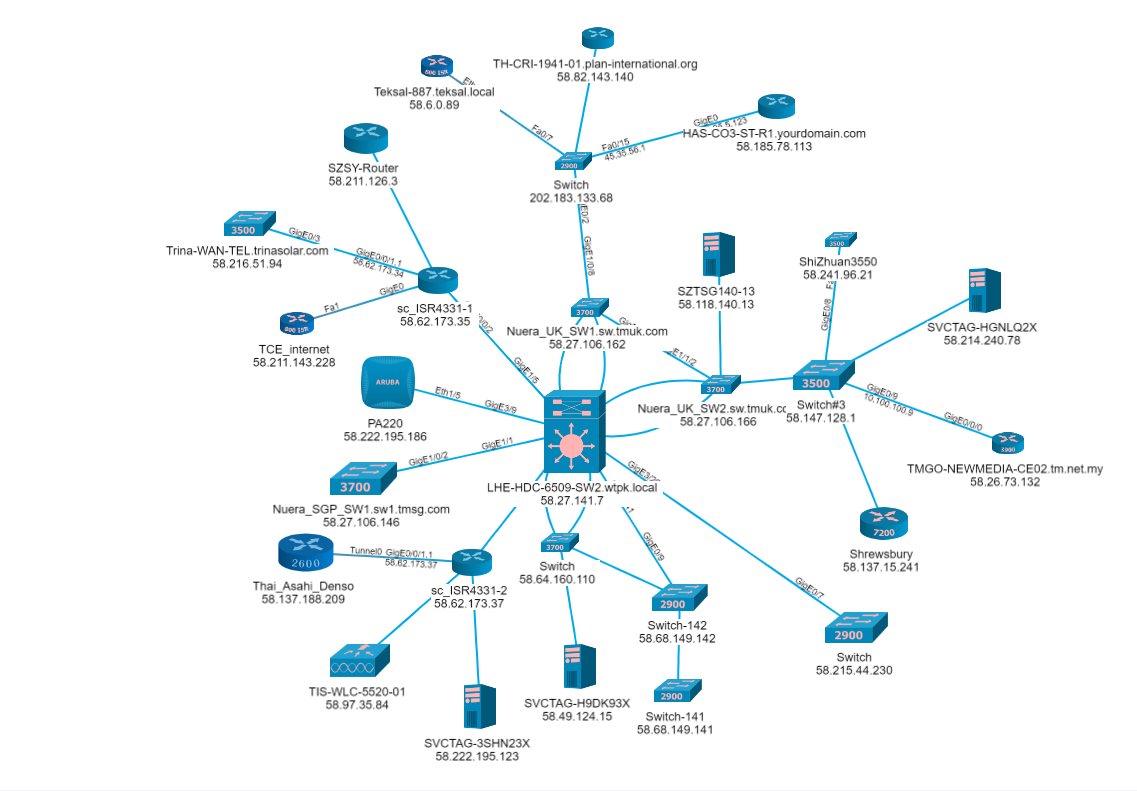
The L2 Topology displays the physical connections between the devices at the site, along with information about those connections. You can drag the entire Topology around the window, as well as drag and resize individual devices.
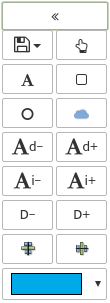
Open the Topology toolbar in the top left of the window for the additional options shown here:
Changing L2 Topology Settings
Click Settings in the L2 Topology window to open the Settings dialog and customize the information that appears in the Topology.
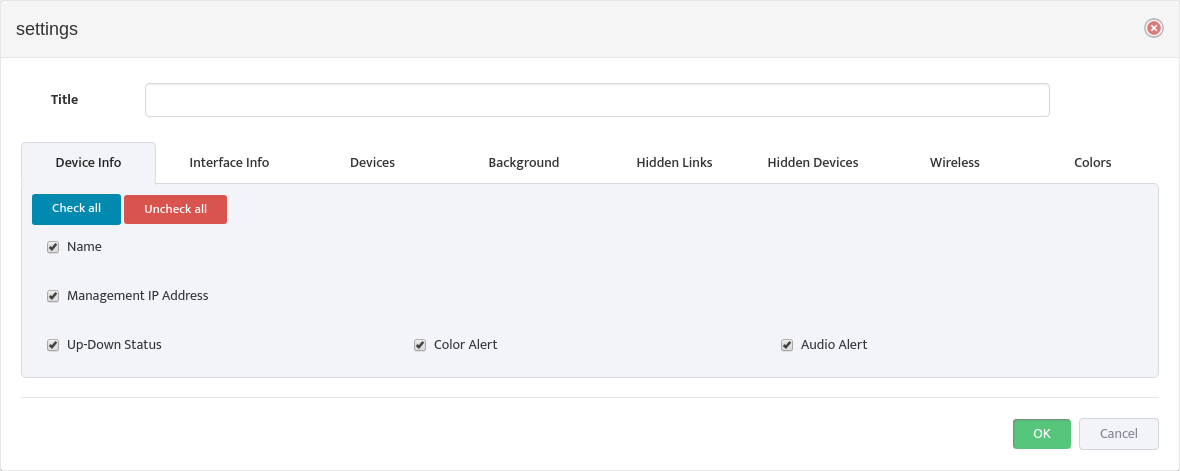
Assign the Topology a Title if you plan to reuse it.
In the Device Info tab, check Up-Down Status and the type of alert (Color Alert, Audio Alert) for real-time alerts when a device in the Topology is down. With Color Alerts, both the device that is down, and the title of the Topology will flash red as shown in the Topology image above.
Be sure to click the Save icon in the Topology Toolbar to save your changes.

Cascading Syslog Servers
Introduction to the Syslog Protocol
Syslog is a protocol that allows systems to send Event Notification Messages through IP networks to Syslog Servers (also known as Event Message Collectors). There the messages can be sorted, searched, and analyzed to monitor the state of individual devices as well as the overall system.
Syslog messages contain both status information and a Severity Level, which ranges from 0 (zero) to 7. Level 0 messages are emergencies. Level 7 messages signify that the sender is in Debug mode. The meanings of Levels 1 through 6 are application dependent.
2. Multiple Syslog Servers – The Traditional Approach
In some situations you might want to add additional Syslog Servers to your system. Traditionally you would do this by configuring each connected device or server to send messages to the Main Syslog Server and to each Secondary Syslog Server. This configuration is shown in the following image:
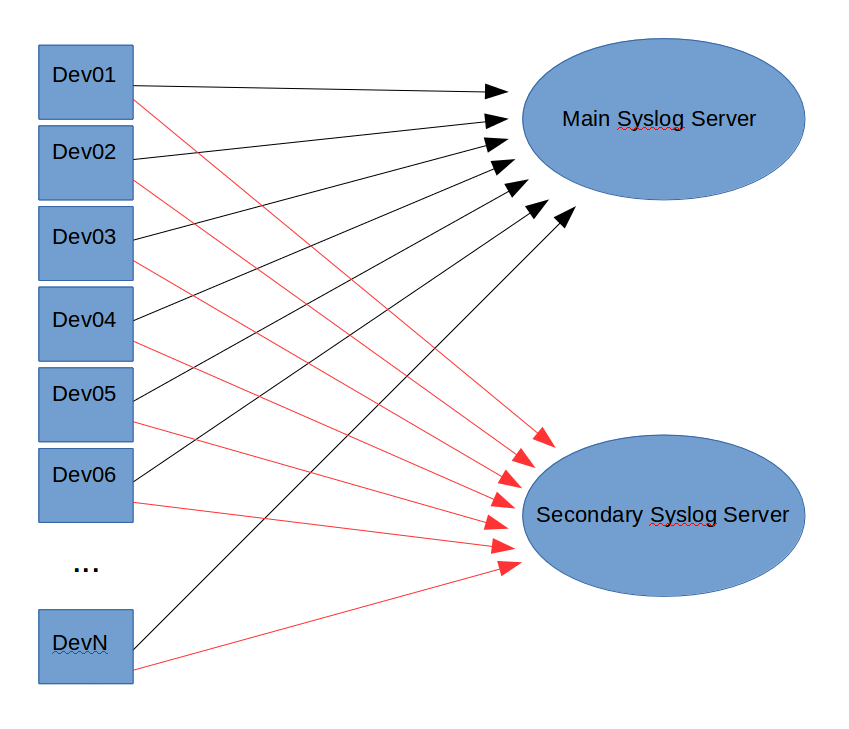
This works fine if you just have a few devices. But it quickly becomes impractical as the number of connected devices grows. Imagine configuring 1000+ devices to send Syslog messages to one or more additional servers for a special project, then disconnecting them all later.
This makes the traditional approach impractical for large installations.
3. Multiple Syslog Servers – The Cascading Approach
To avoid the problems of the traditional approach, Nectus implements Cascading Syslog Servers. Instead of connecting each device to each Syslog server, you need only connect them to the primary Syslog server. The primary server can then forward copies of the messages to any secondary servers, as shown in the following image:
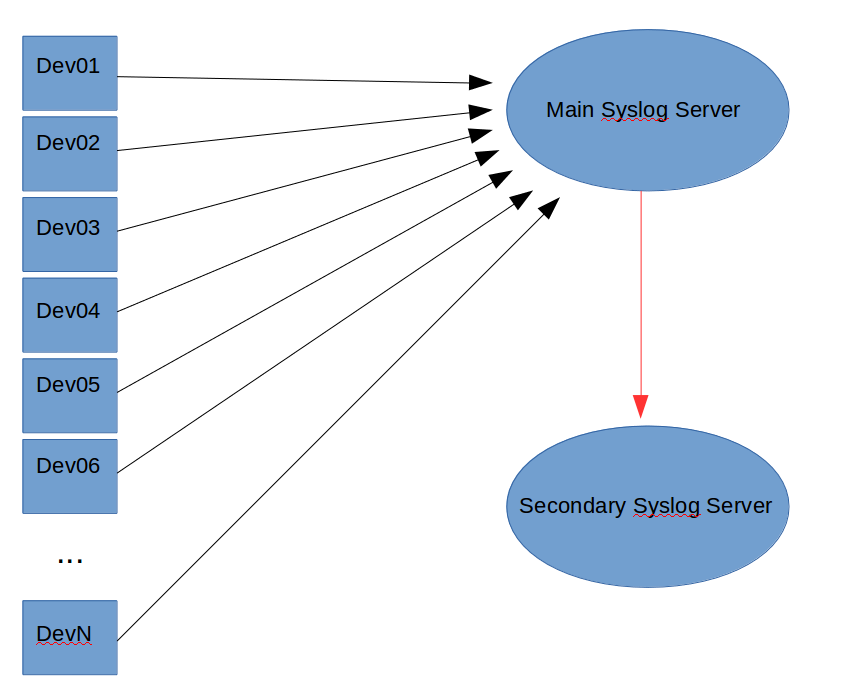
This approach makes adding and removing secondary Syslog servers simple. However, forwarding every Syslog message does increase the load on the primary Syslog server. You need to carefully monitor the primary server to avoid overloading it.
Nectus recommends you cascade no more than 10 secondary Syslog servers to avoid overloading the primary server.
3.1 Configuring the Nectus Cascading Syslog Servers Solution
Follow these steps to configure Cascading Syslog Servers:
- Click Settings in the Nectus Home Screen.
- In the Settings menu that appears, hover the cursor over the General Settings option.
- Click the Syslog Settings option that appears. Select the Forwarding IP tab in the Syslog Settings dialog that appears.
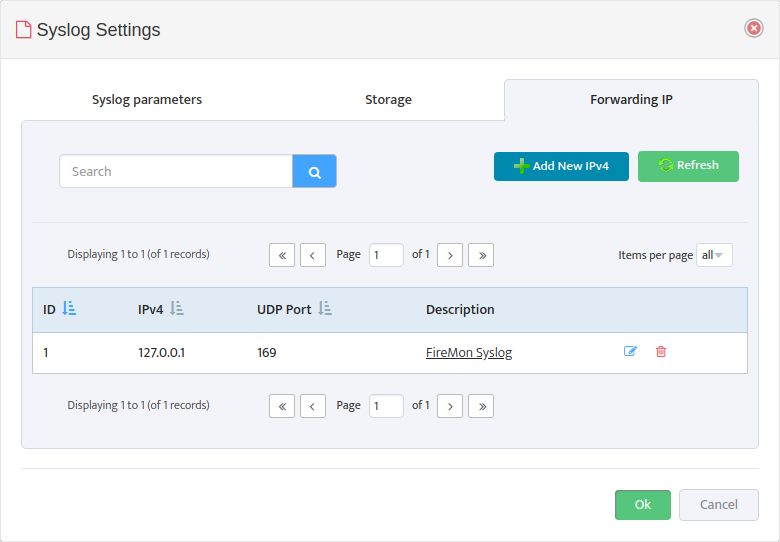
- Click the Add New IPv4 button to open the Add Forwarding IPv4 dialog.
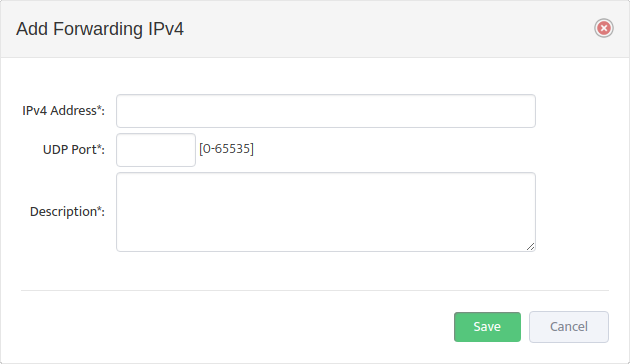
- For each secondary Syslog server add the IPv4 Address of the server, the number of the UDP Port the server is listening on, and a Description of the server.
AWS Instance Backup Automation with Nectus
Having your data backed up and secured is crucial for business-critical systems. If your servers run in AWS infrastructure,
then you already have an advantage of performing backup of the hosted instances using Amazon built-in features.
This can be performed manually using AWS console the following way. First, select Instances menu from EC2 Dashboard.
Then select an instance you would like to backup.
In Description tab you will see the Block devices attached to the selected instance.
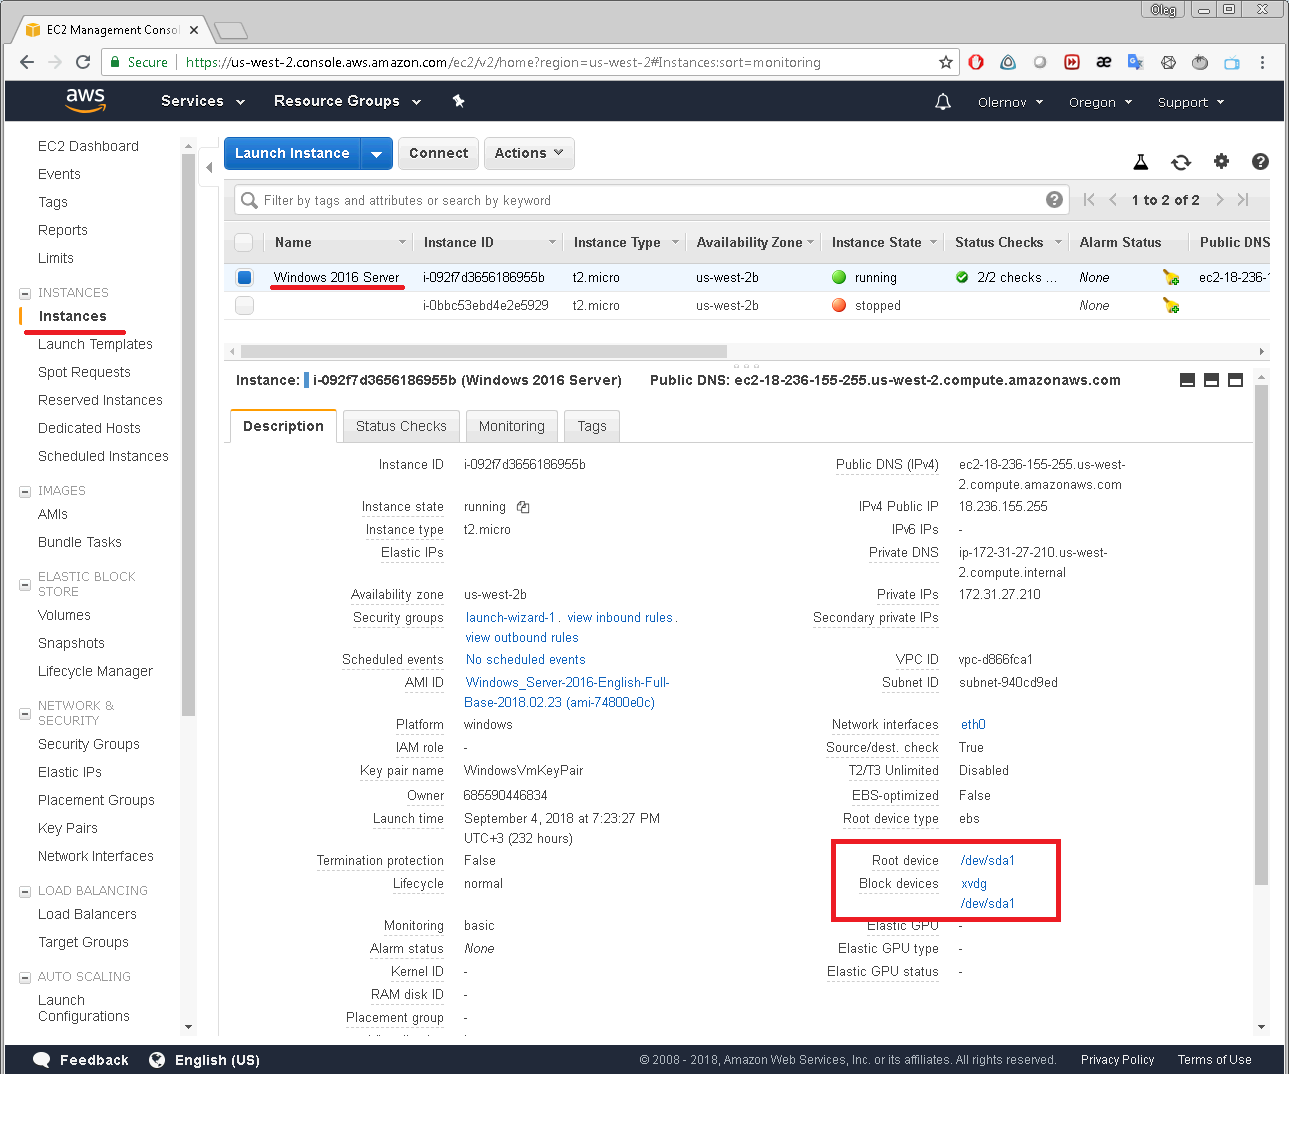
Clicking on one of the block devices will bring up the window displaying the block device’s EBS ID:
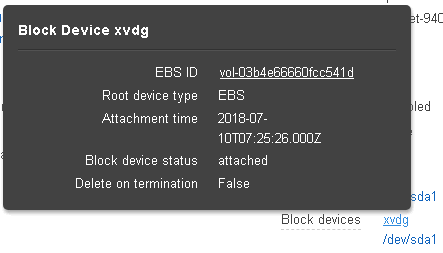
By clicking that EBS ID you get to the Volumes menu of the EC2 Dashboard:
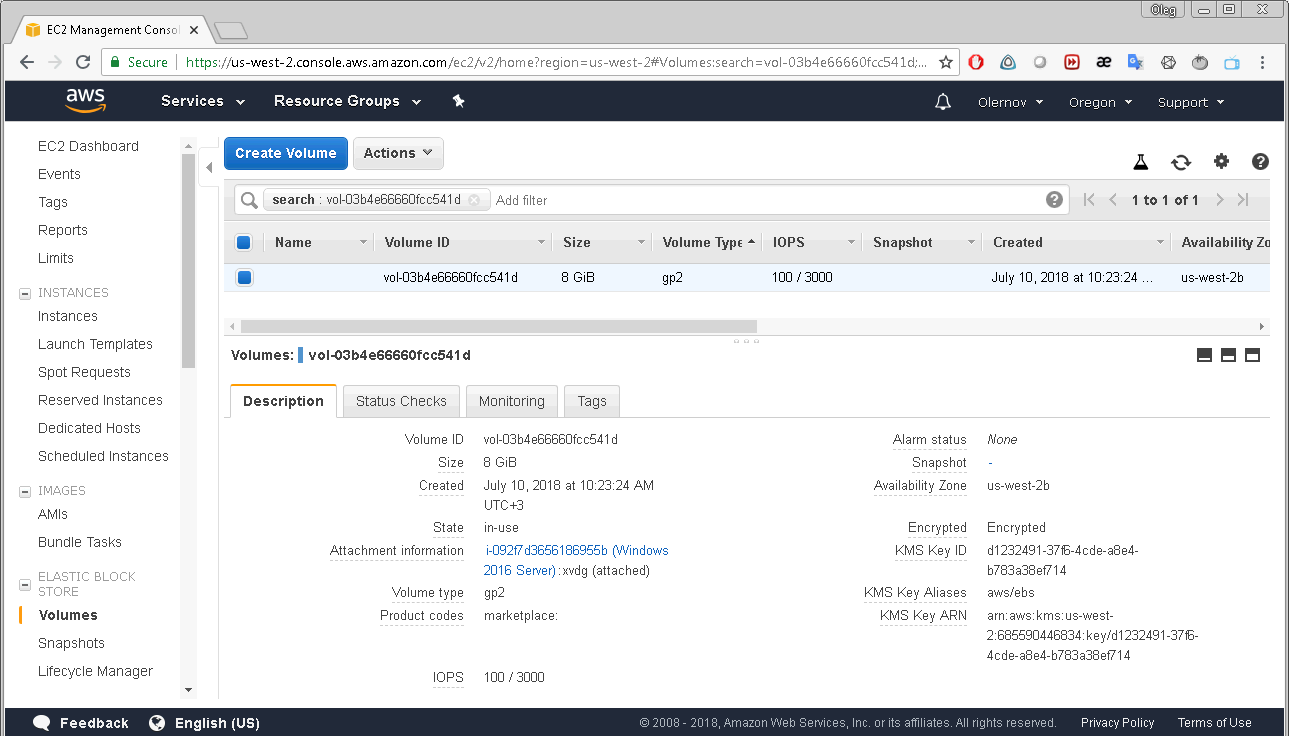
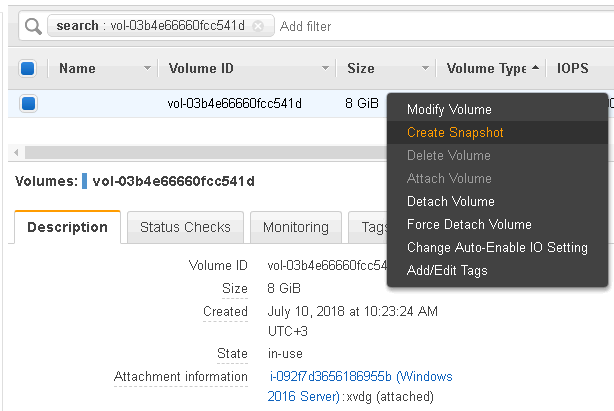
Right-click on the selected volume will display a menu with “Create snapshot” option.
After selecting this option you have to enter a description of your snapshot and the snapshot will be created.
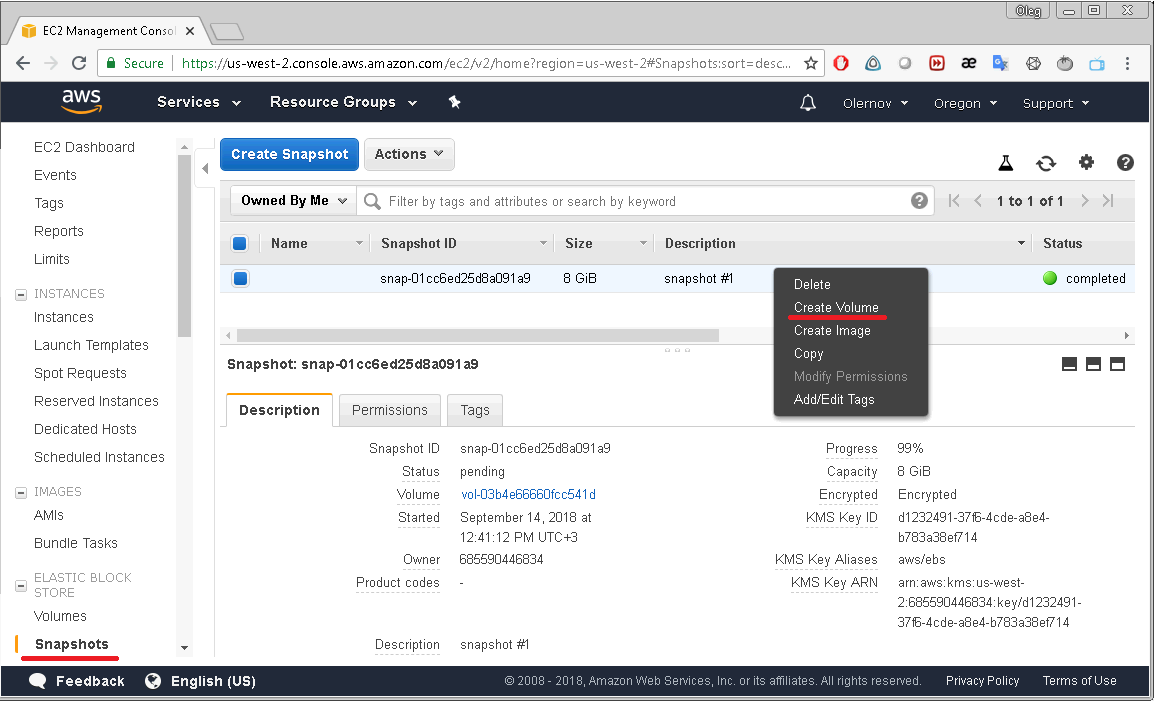
After that the snapshot created will appear on the list displayed on the EC2 Dashboard/Snapshots page. To restore data from that snapshot you should select
“Create Volume” option from the snapshot’s context-menu. A new volume will appear with exactly the same data you had on your volume when snapshot was created.
But taking snapshots manually is hardly an option, especially if you deal with a lot of the EC2 instances. This process must be automated.
One of possible solutions is utilizing the Nectus AWS backup functionality. Nectus is able to take snapshots of your volumes constantly and
regularly with the required periodicity according to the backup profiles you set.
The following steps will show how to enable and set up the automated backup of AWS instances using Nectus. First you need to set up your backup profiles.
Select Settings/General Settings/AWS Integration menu.
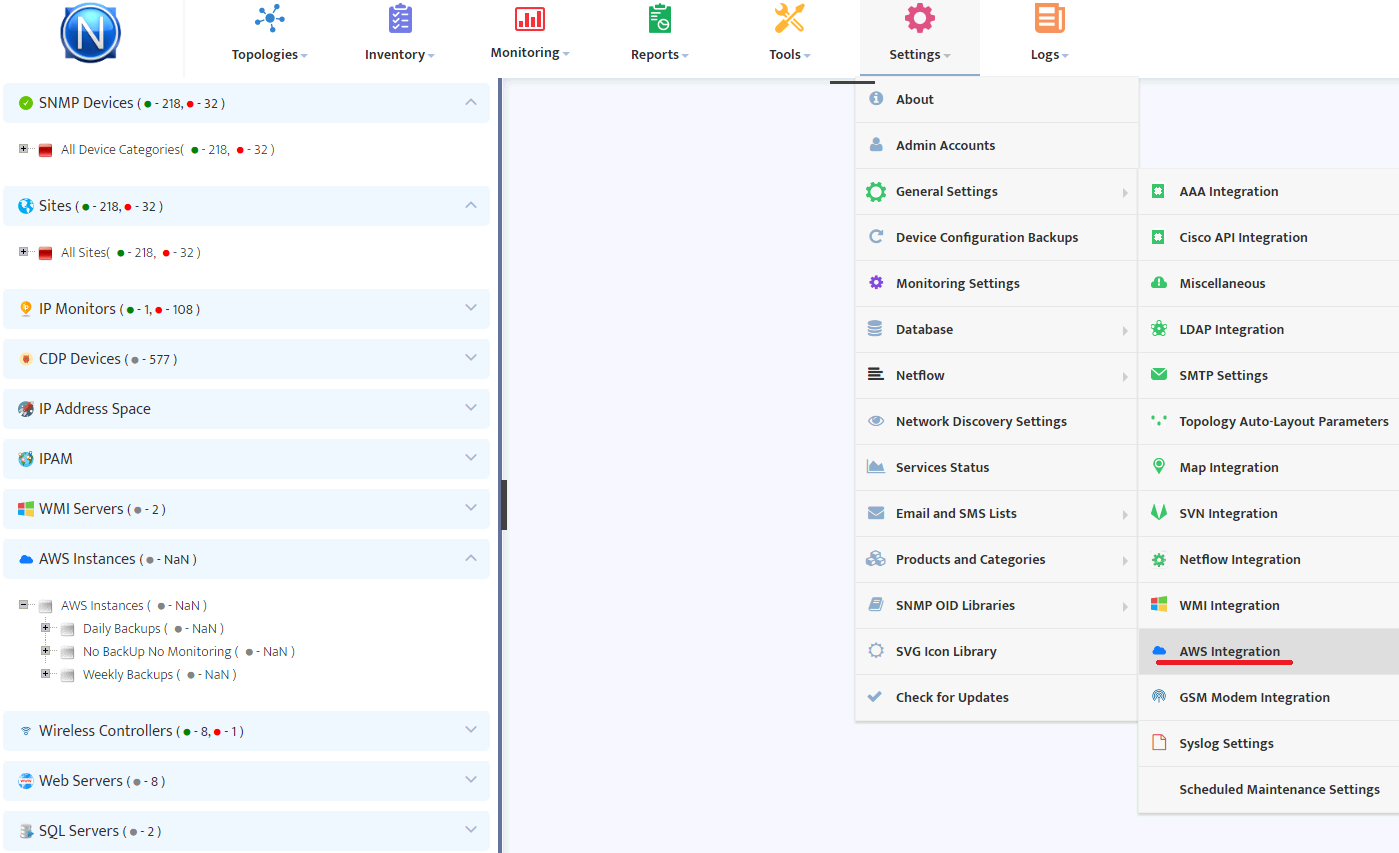
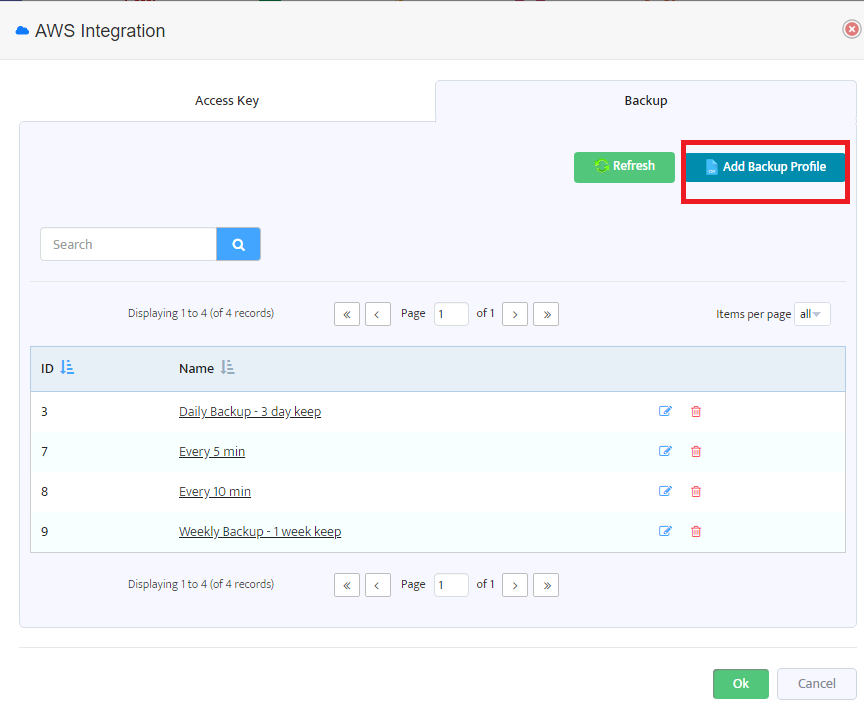
In the “Backup” tab you will see backup profiles already created and also the “Add Backup Profile” button.
Pressing this button will open the following “Add New AWS Backup Profile” dialog.
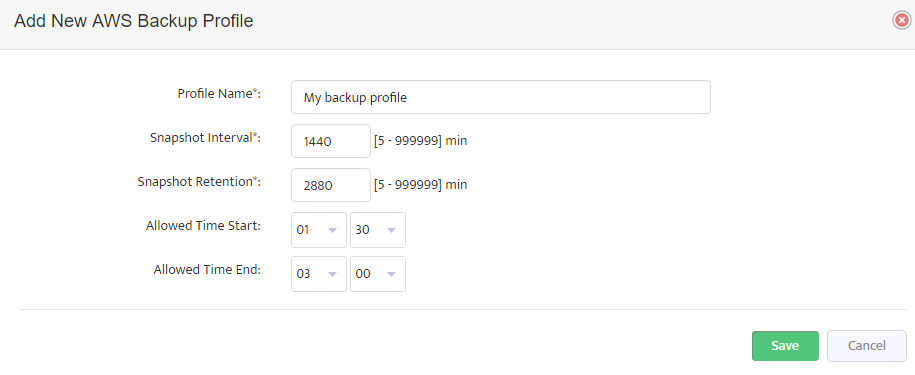
Here you can enter a name for a new backup profile, periodicity of snapshots creation (Snapshot Interval), period of retention for snapshots created (Snapshot retention)
and the allowed time interval to take snapshots (this setting is available only if Snapshot Interval is 1440 minutes or more).
Pressing “Save” button will add the new backup profile to the list. Editing of existing profiles is also possible.
You can create any number of backup profiles for different purposes.
For example, you may want to backup your most critical production instances quite often (every 5 minutes) but your test servers rarely (once a day or maybe even once a week).
The procedure of taking a snapshot is free of charge from Amazon but storing them is charged depending on the volume (see AWS EC2 pricing).
That should be considered when choosing the Snapshot retention period.
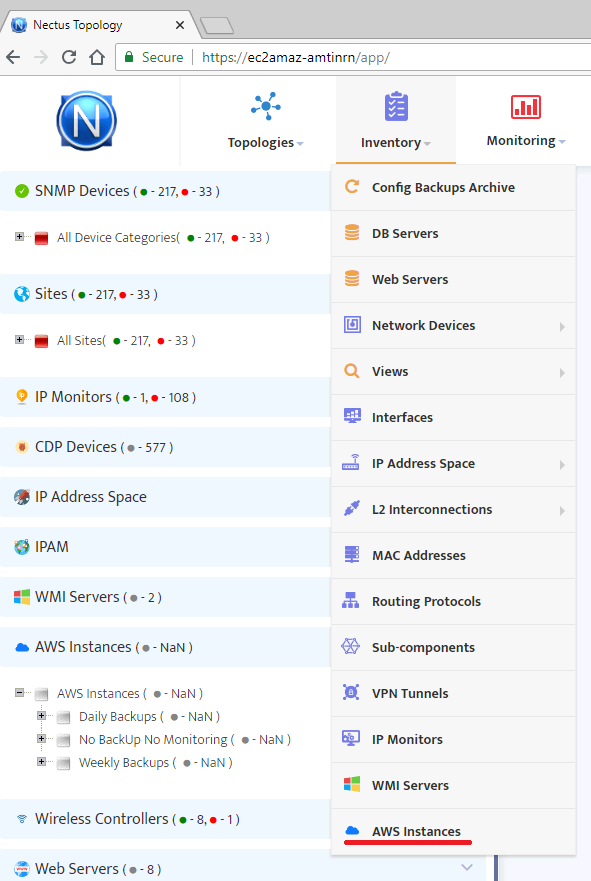
After you have set the required backup profiles, it is time to assign them to your instances. To perform it select “AWS Instances” from the “Inventory” menu.
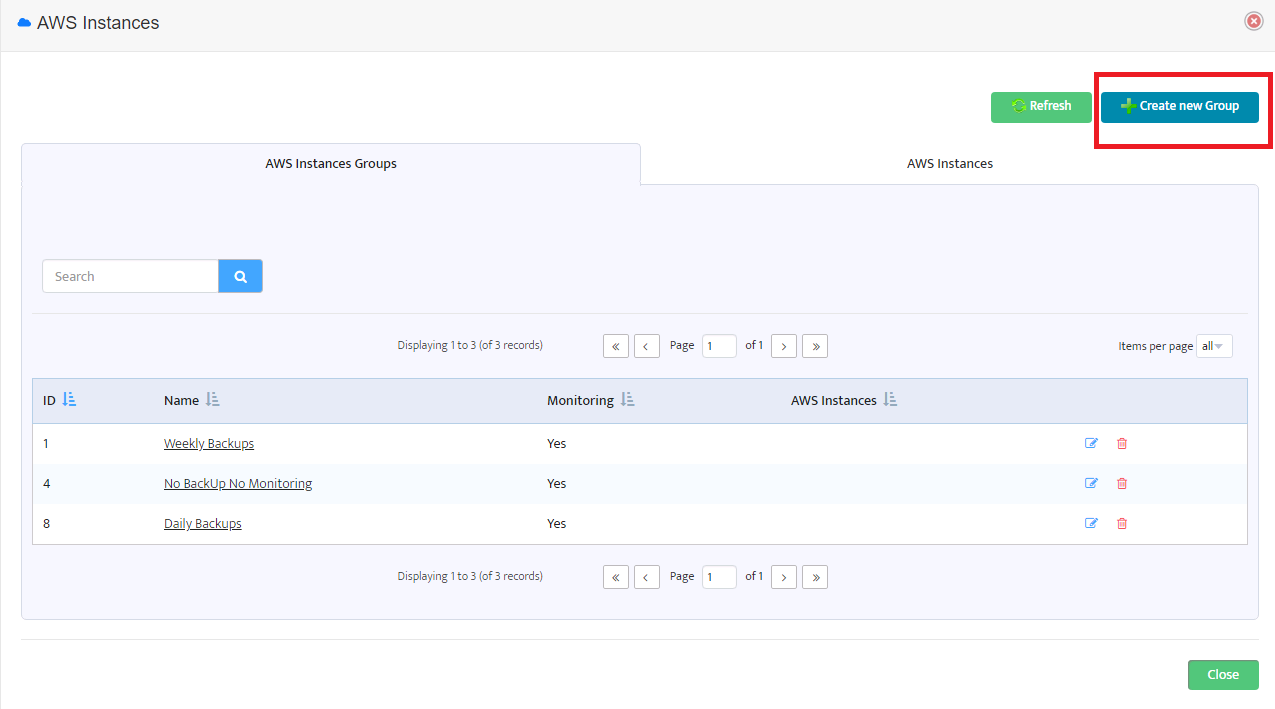
In the form displayed you can see a list of already existing instance groups. To create a new AWS instance group press the button “Create new Group” at the top-right of the form.
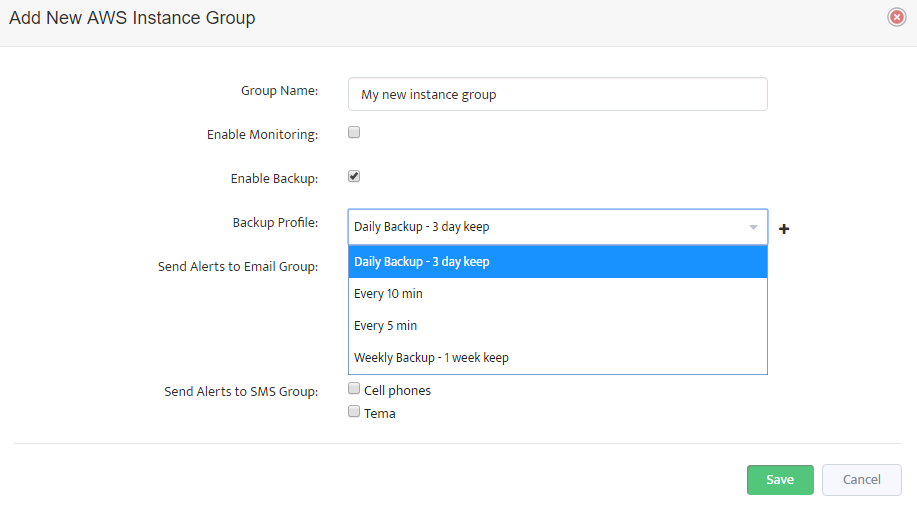
In the window opened you should set a new group name, check the “Enable Backup” box and choose one of the backup profiles created earlier.
If the box is not checked, then no backups will be performed for instances of this group.
Now when you have backup profiles assigned to AWS instance groups you can switch to the next tab “AWS Instances”.
The next window displays a list of AWS instances.
Each instance belongs to one of the AWS instance groups and so the group settings affect the instance backup policy.
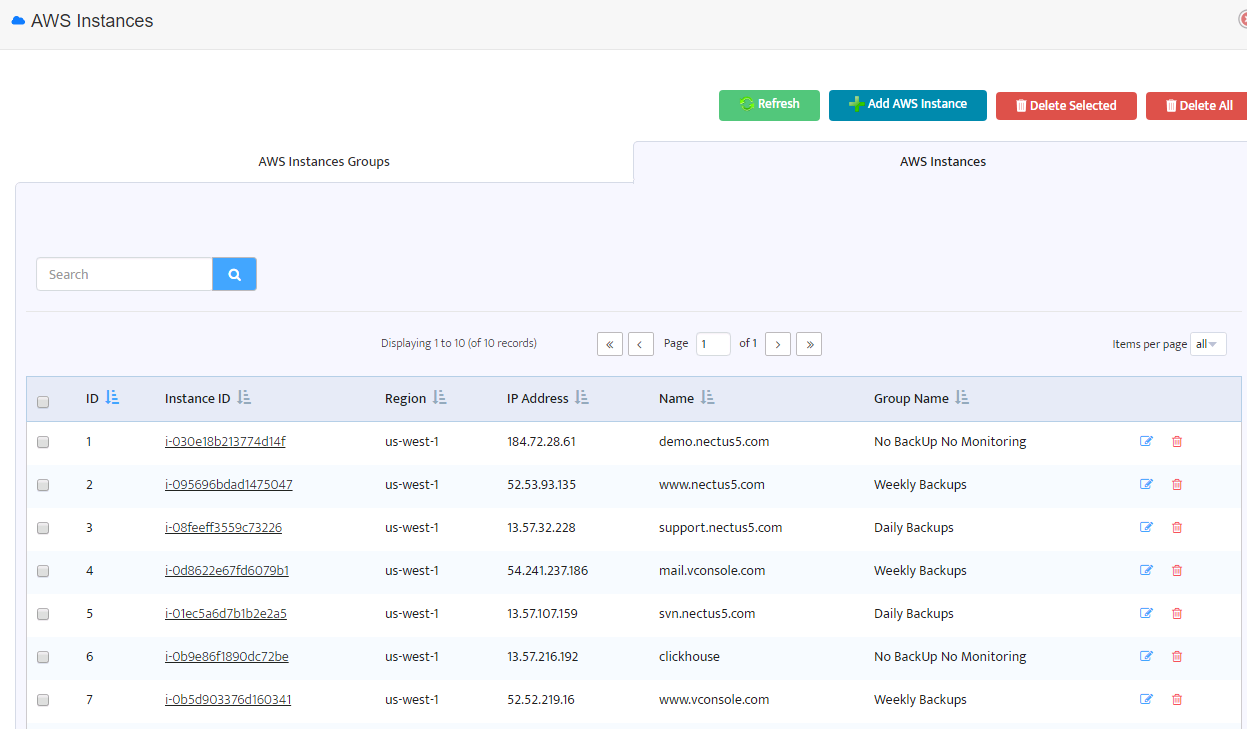
To change backup profile for an instance you should move it to another instance group with appropriate backup profile.
For example, if you want to change backup profile for “www.nectus5.com” from “Weekly Backups” to “Daily Backups”
just click on the Instance ID and change AWS instance group.
After such setup Nectus will automatically start creating new snapshots and deleting old ones.
You will see those snapshots in your EC2 Dashboard.
Creating Custom Dashboards
In this chapter, you’ll learn how to create Custom Dashboards. Nectus lets you create an unlimited number of Custom Dashboards, making it easy to focus on exactly the information you need at any time.
This chapter covers how to:
- Create a New Custom Dashboard
- Add Widgets
- Manage Widgets
- Manage Dashboards
- Available Widgets by Category
1. Create a New Custom Dashboard
You create and configure Custom Dashboards using the Dashboard Widgets dialog box.
- To create a new Custom Dashboard, go to the Nectus Top Menu then navigate to: Monitoring -> Custom Dashboards -> Manage Custom Dashboards and click the Add Dashboard button.
- Enter a Title for the Dashboard then add widgets to it as described in Section 2.
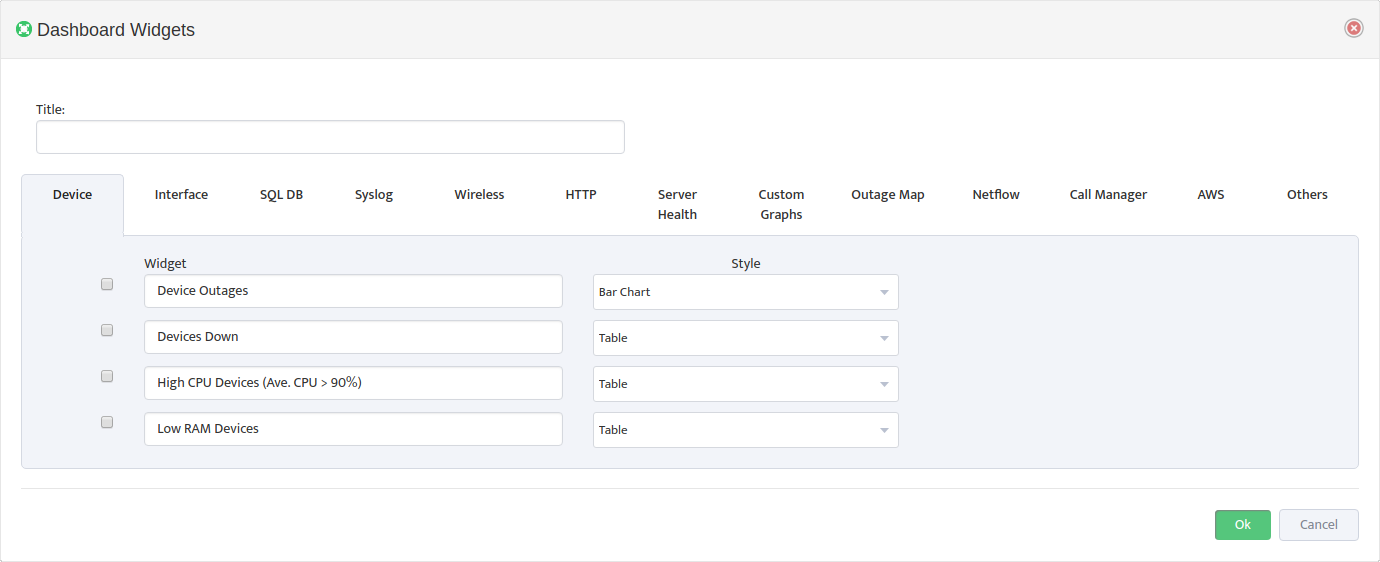
2. Add Widgets
The Dashboard Widgets dialog includes all the available Widgets grouped by Category. You can enable any number of Widgets from any number of Categories in the Dashboard.
Many Widgets have settings you can enter when you add them to the Dashboard. They may also have additional settings you configure once the Widget is live in the Dashboard. See the next section for more details.
3. Manage Widgets
Once a Widget is live in a Dashboard, you can drag it, resize it, or remove it.
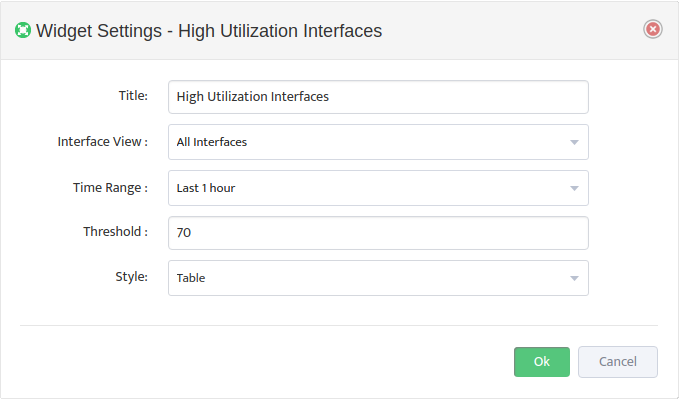
You can customize any Widget by clicking its Settings icon. Most Widgets have a Style setting you can configure. Some Widgets also have Views. Views filter the information that appears in the Widget.
In the following example, the View filters the High Utilization Interfaces Widget so only interfaces that have had utilization levels of 70% of above in the last hour appear.
To keep any changes you make to widgets, click the Dashboard’s Save icon.
4. Manage Dashboards
You manage a Dashboard by clicking the Dashboard’s Settings icon to open the Dashboard Widgets dialog box. You can change the Title, as well as add or remove Widgets.
To keep any changes you make to the Dashboard, click the Save icon.
To make this Dashboard the default, click the Open by Default icon.
5. Available Widgets by Category
Nectus gives you over 60 Widgets, divided into over a dozen Categories. This section lists the Categories and the Widgets in each Category.
5.1 Device Widgets
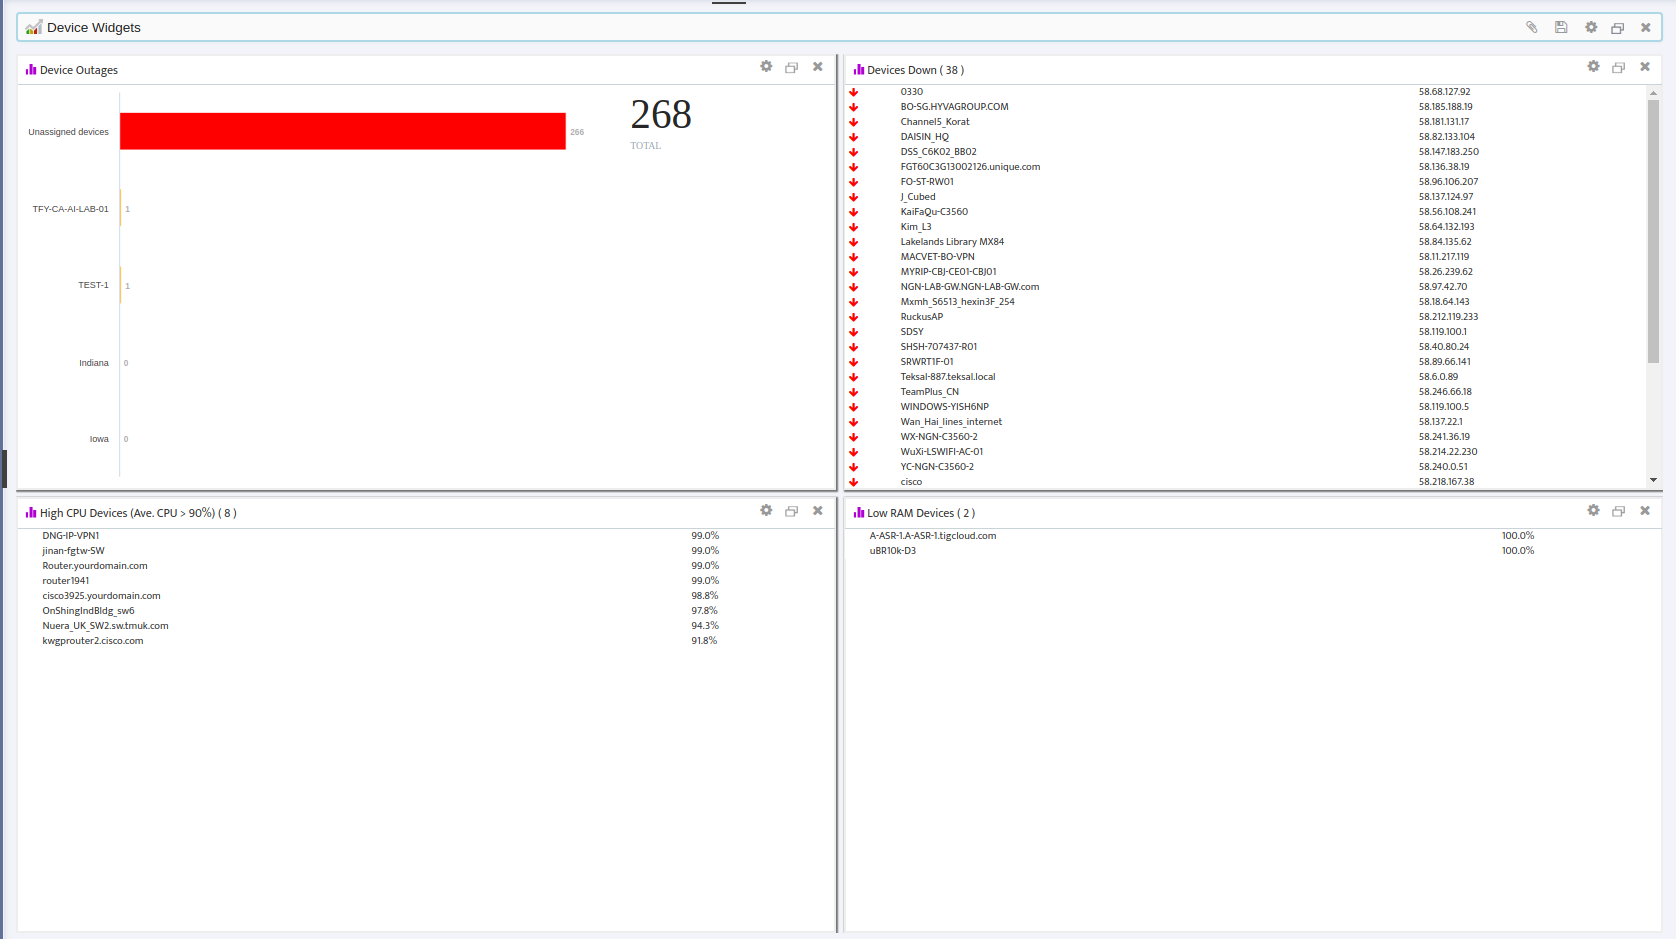
- Device Outages
- Devices Down
- High CPU Devices (Ave. CPU > 90%)
- Low RAM Devices
5.2 Interface Widgets
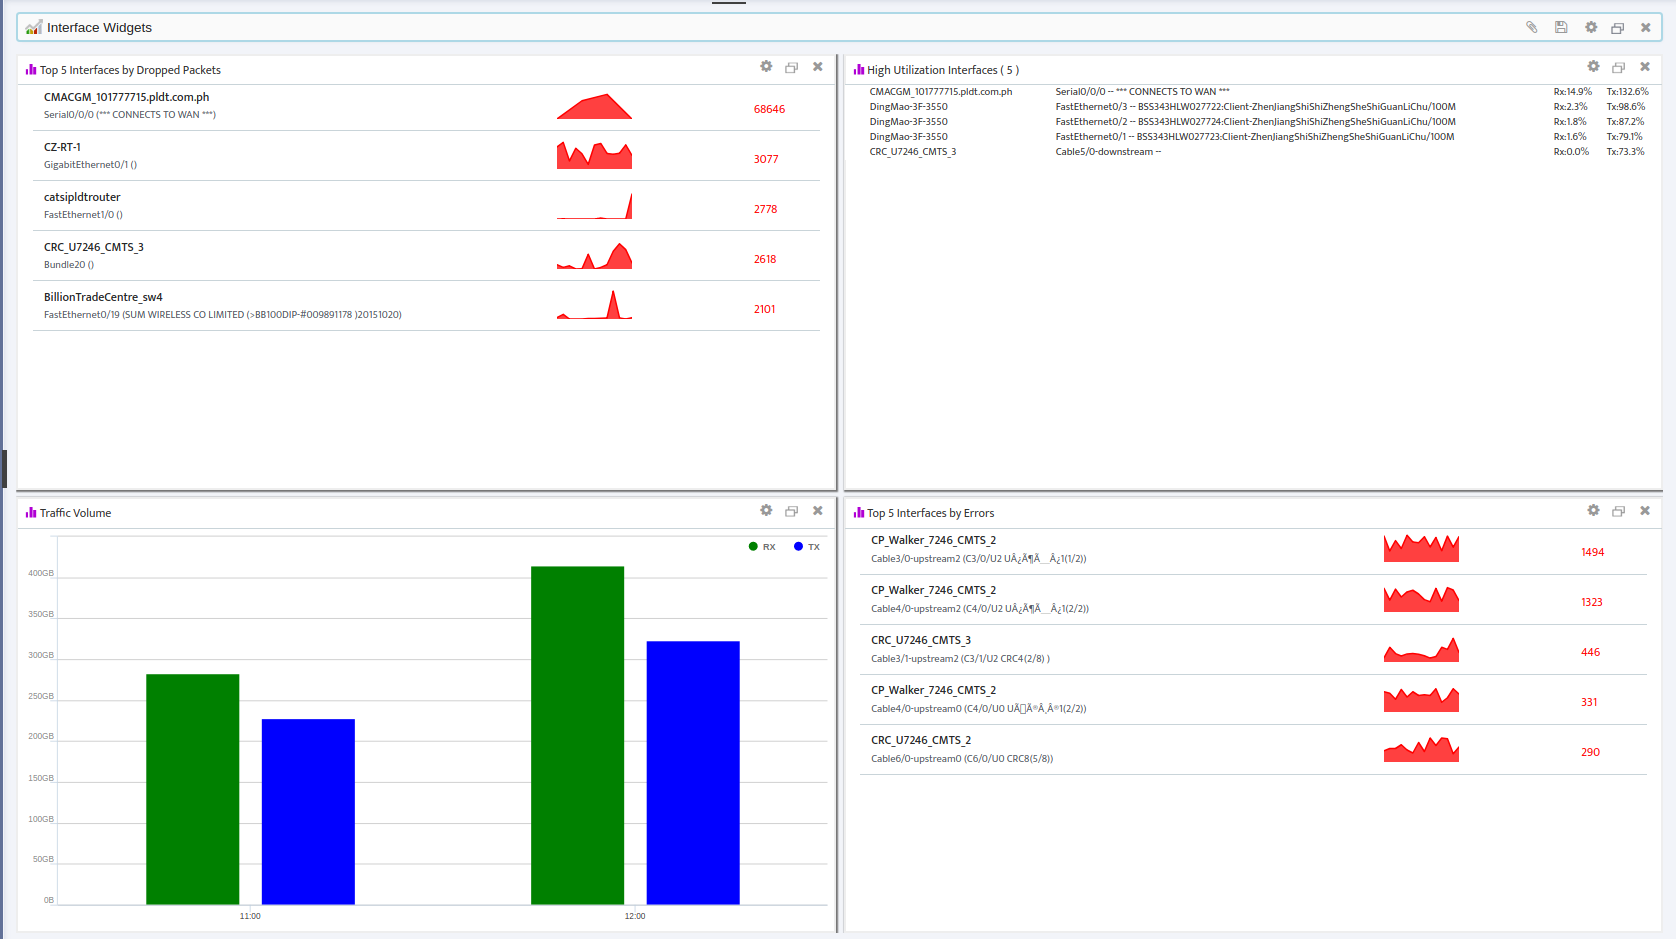
- High Utilization Interfaces
- Interface Outages
- Interfaces Down
- Top 5 Interfaces by Dropped Packets
- Top 5 Interfaces by Errors
- Top 5 Interfaces by Utilization
- Traffic Volume
5.3 SQL DB Widgets
- Resource Pool Stats
- Avg Disk Read/Write IO (ms)
- CPU Usage
- Disk Read/Write Bytes/sec
- Disk Read/Write IO/sec
- Memory Manager Metrics
- Memory Grants Pending
- Target-Total Memory
- Buffer Manager
- Buffer cache hit ratio
- Lazy write/sec
- Page life expectancy
- Page lookups/sec
- Page reads/writes sec
- Databases
- Active Transactions
- DB Data/Log size
- Log Flushes/sec
- Percent Log Used
- Running Query count
- Transactions/sec
- Write Transactions/sec
- SQL Errors
- Errors/sec
- SQL Statistics
- Batch Requests/sec
- SQL Compilations/Re-Compilations sec
- Services
- Server Services
- Sessions and Connections
- Connections
- Sessions
Locks (Total)
-
- Average Wait Time (ms)
- Lock Requests/sec
- Lock Waits/sec
- Number of Deadlocks/sec
- Agent Jobs
- Agent Jobs
5.4 Syslog Widgets
- Major Syslog Events
- Syslog (Severity 1-3)
5.5 Wireless Widgets
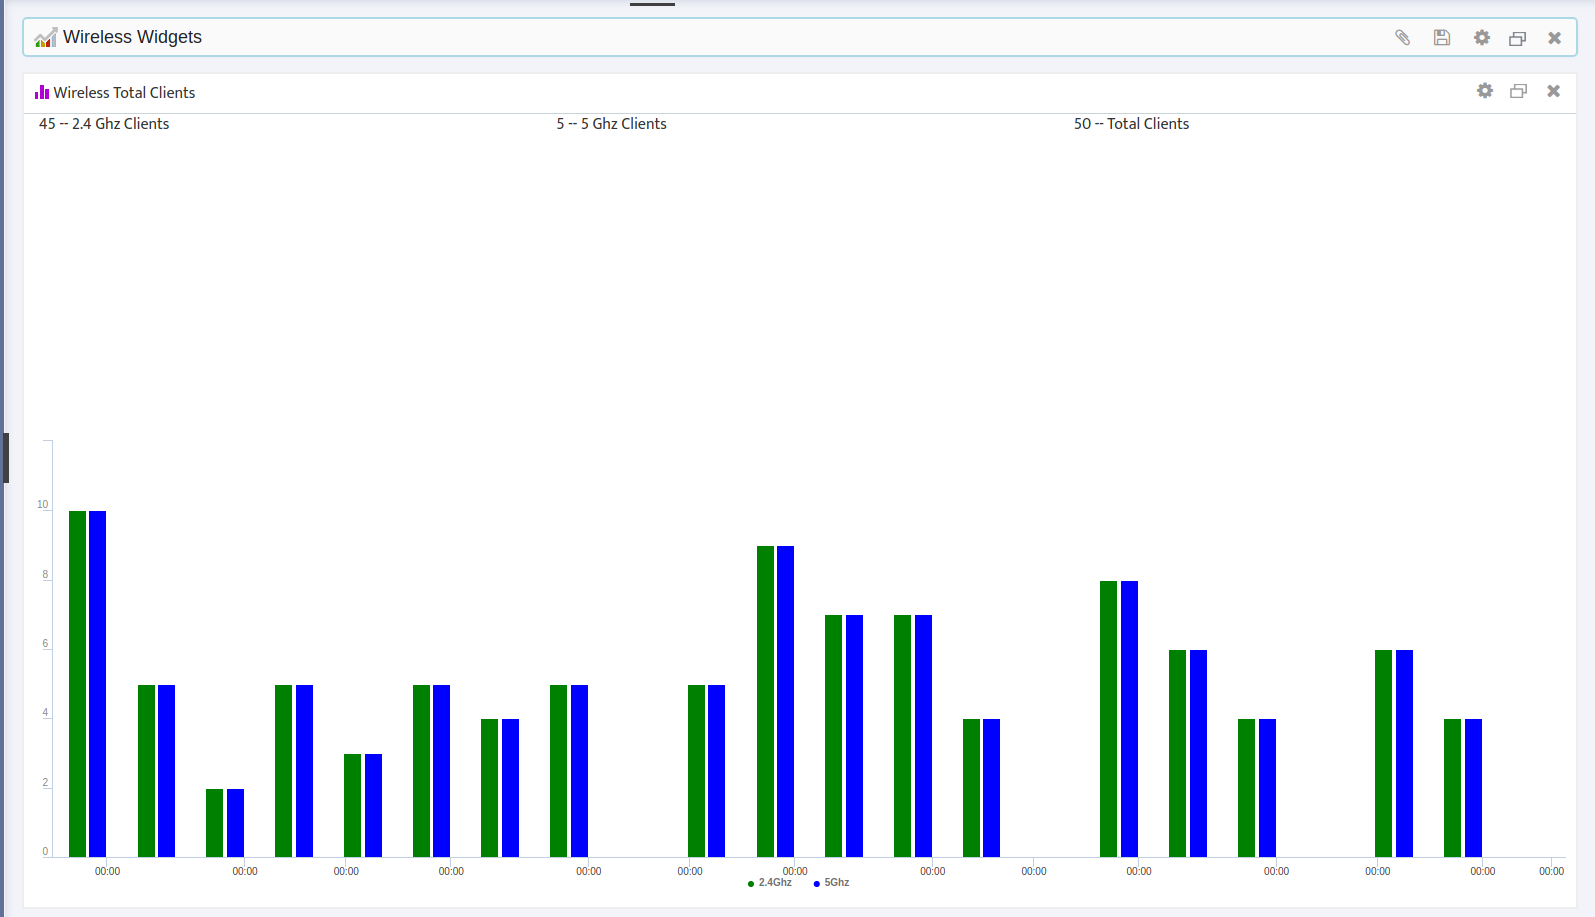
- Wireless AP Client Load
- Wireless Controllers
- Wireless SSID Client Load
- Wireless Total Clients
5.6 HTTP Widgets
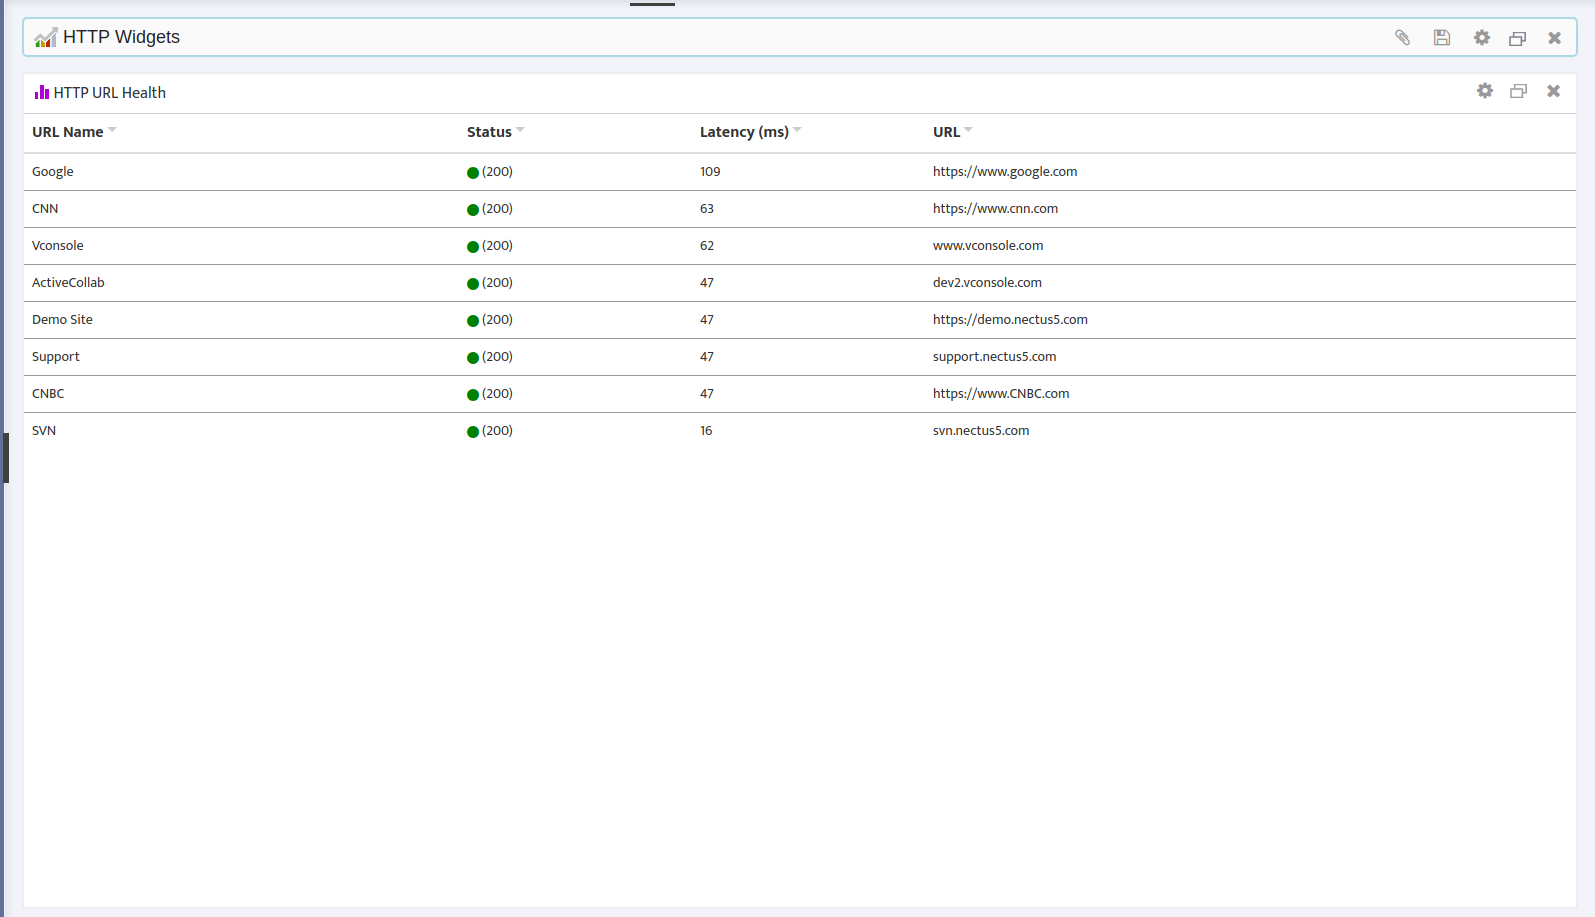
- HTTP URL Health
5.7 Server Health Widgets
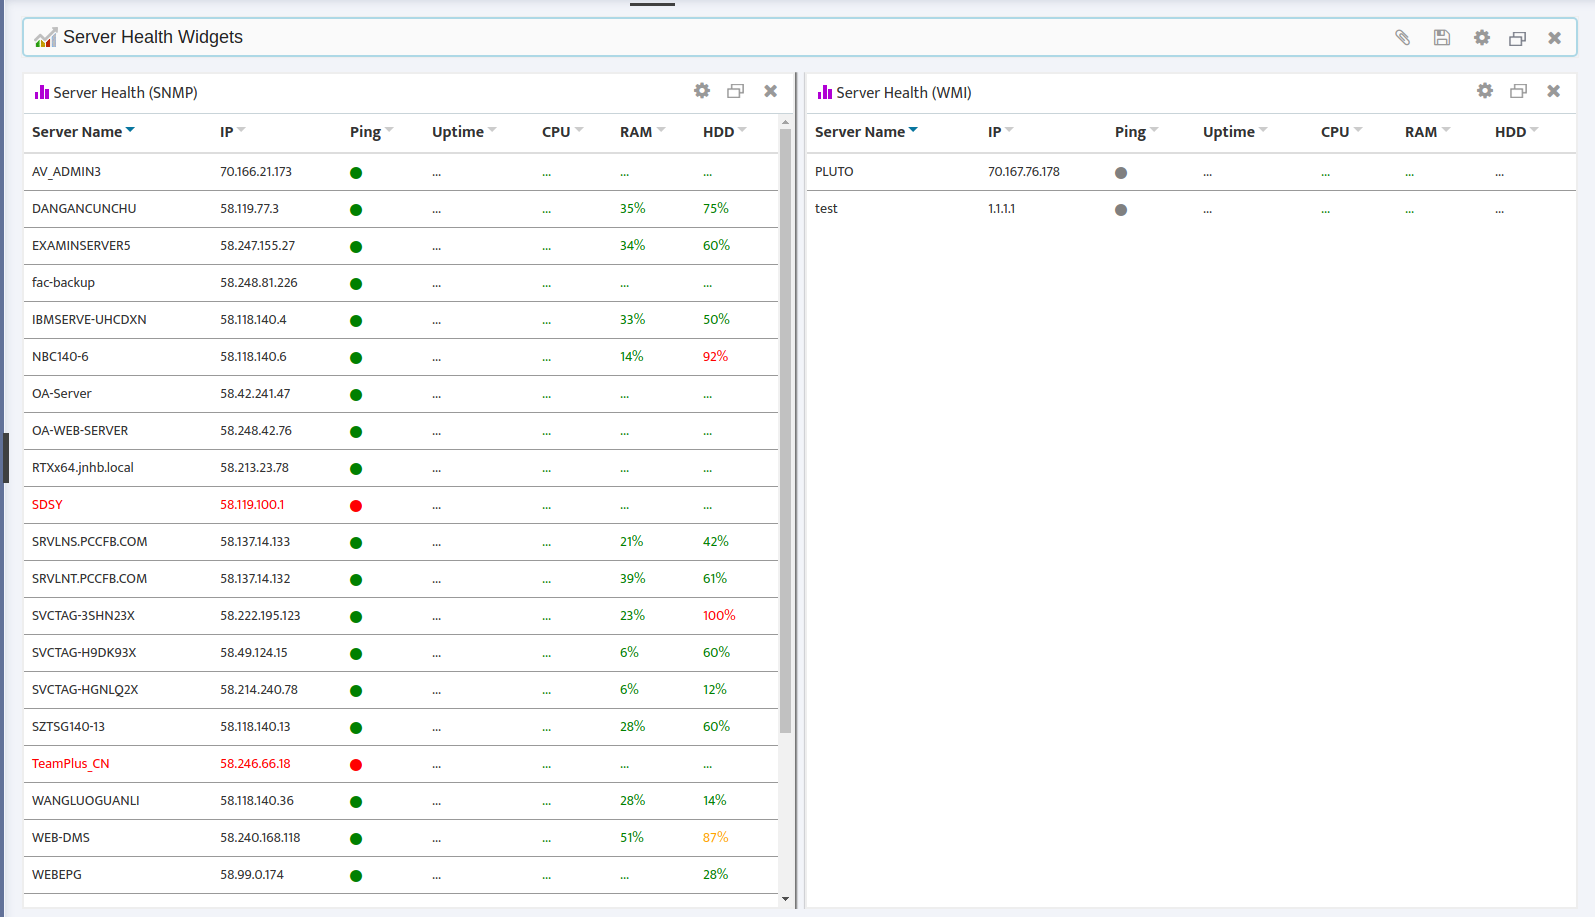
- Server Health (SNMP)
- Server Health (WMI)
5.8 Custom Graphs Widgets
- Custom Graph 1-10
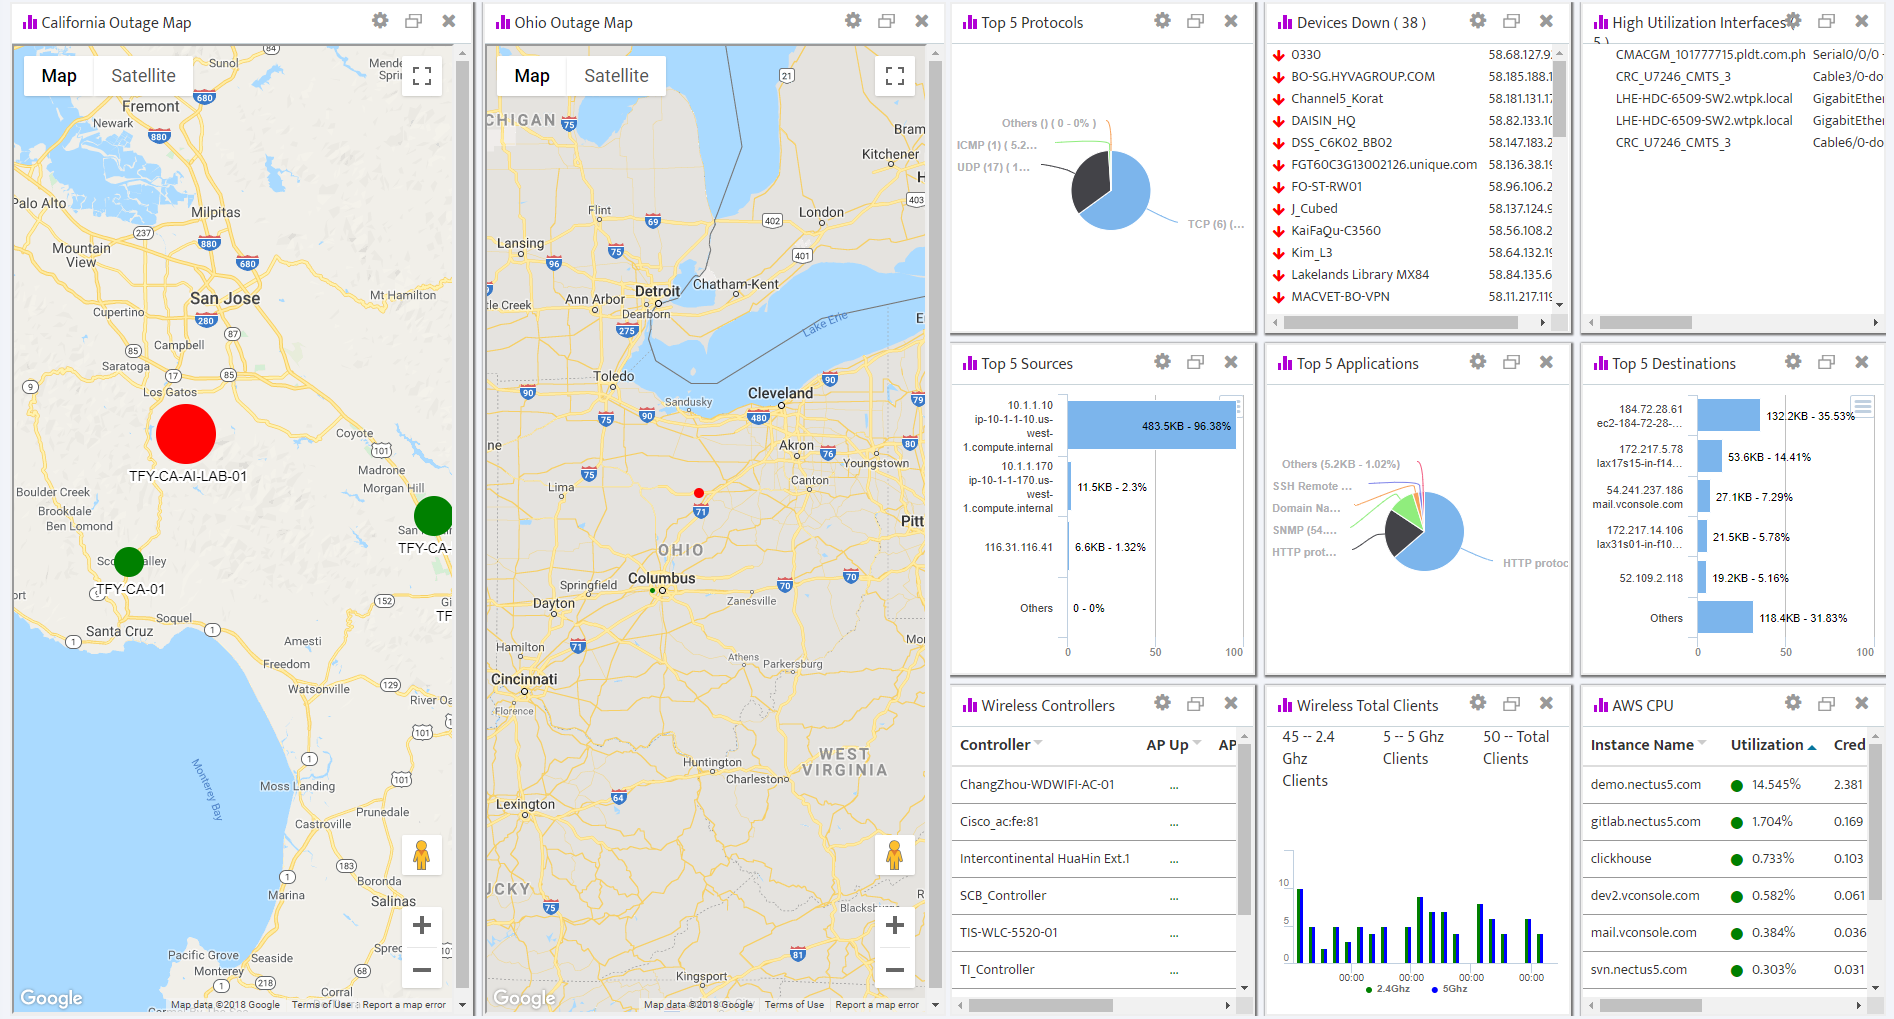
5.9 Outage Map Widgets
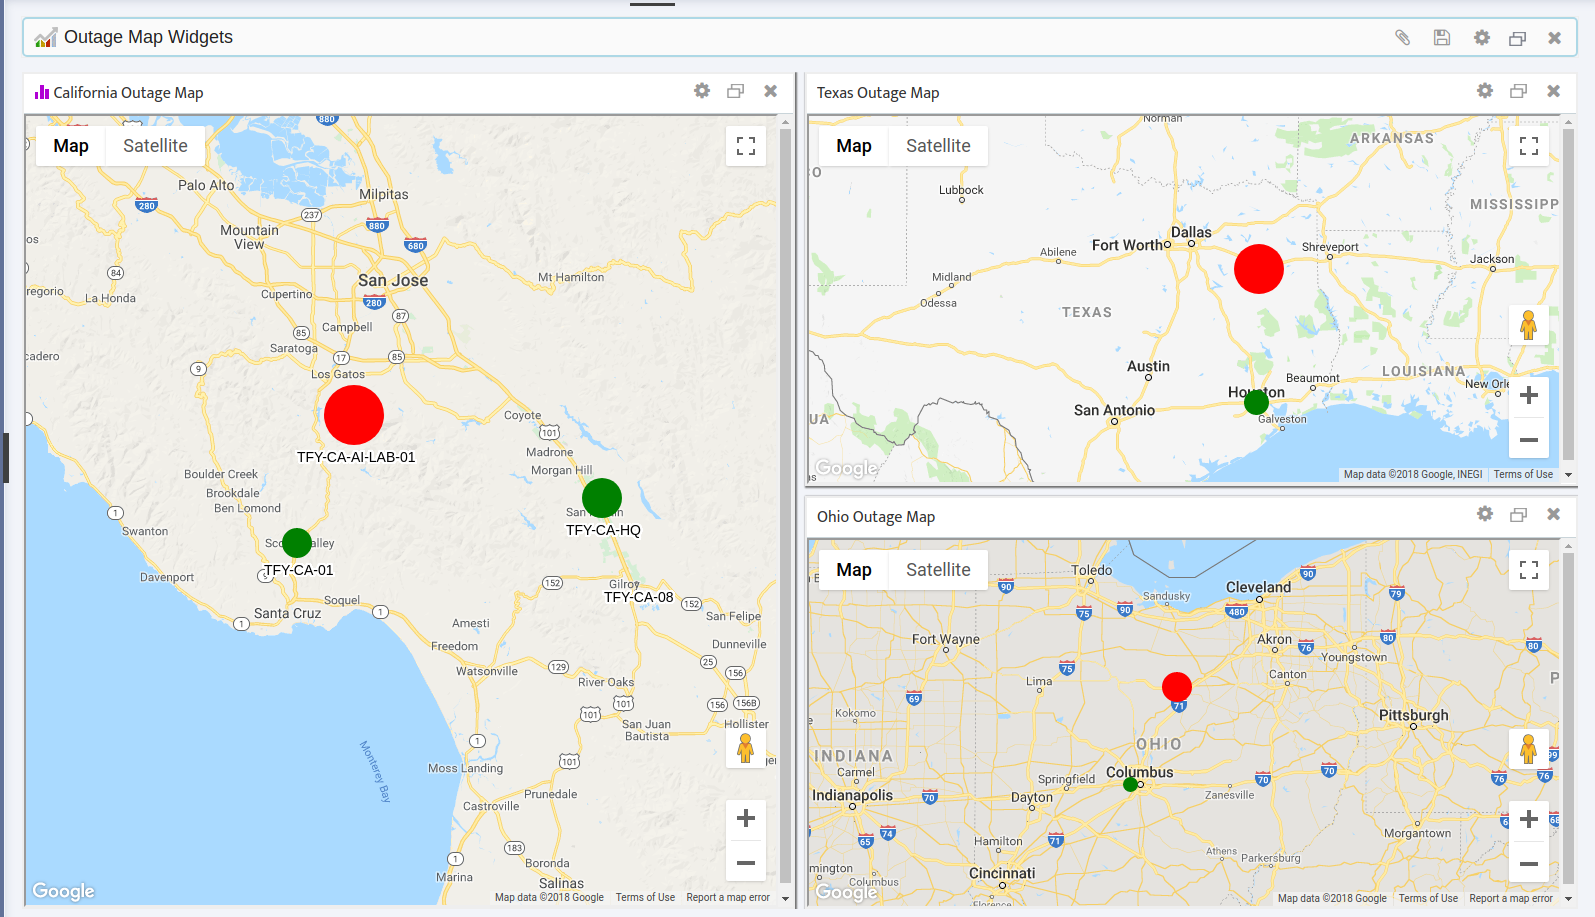
- Outage Map 1-10
5.10 Netflow Widgets
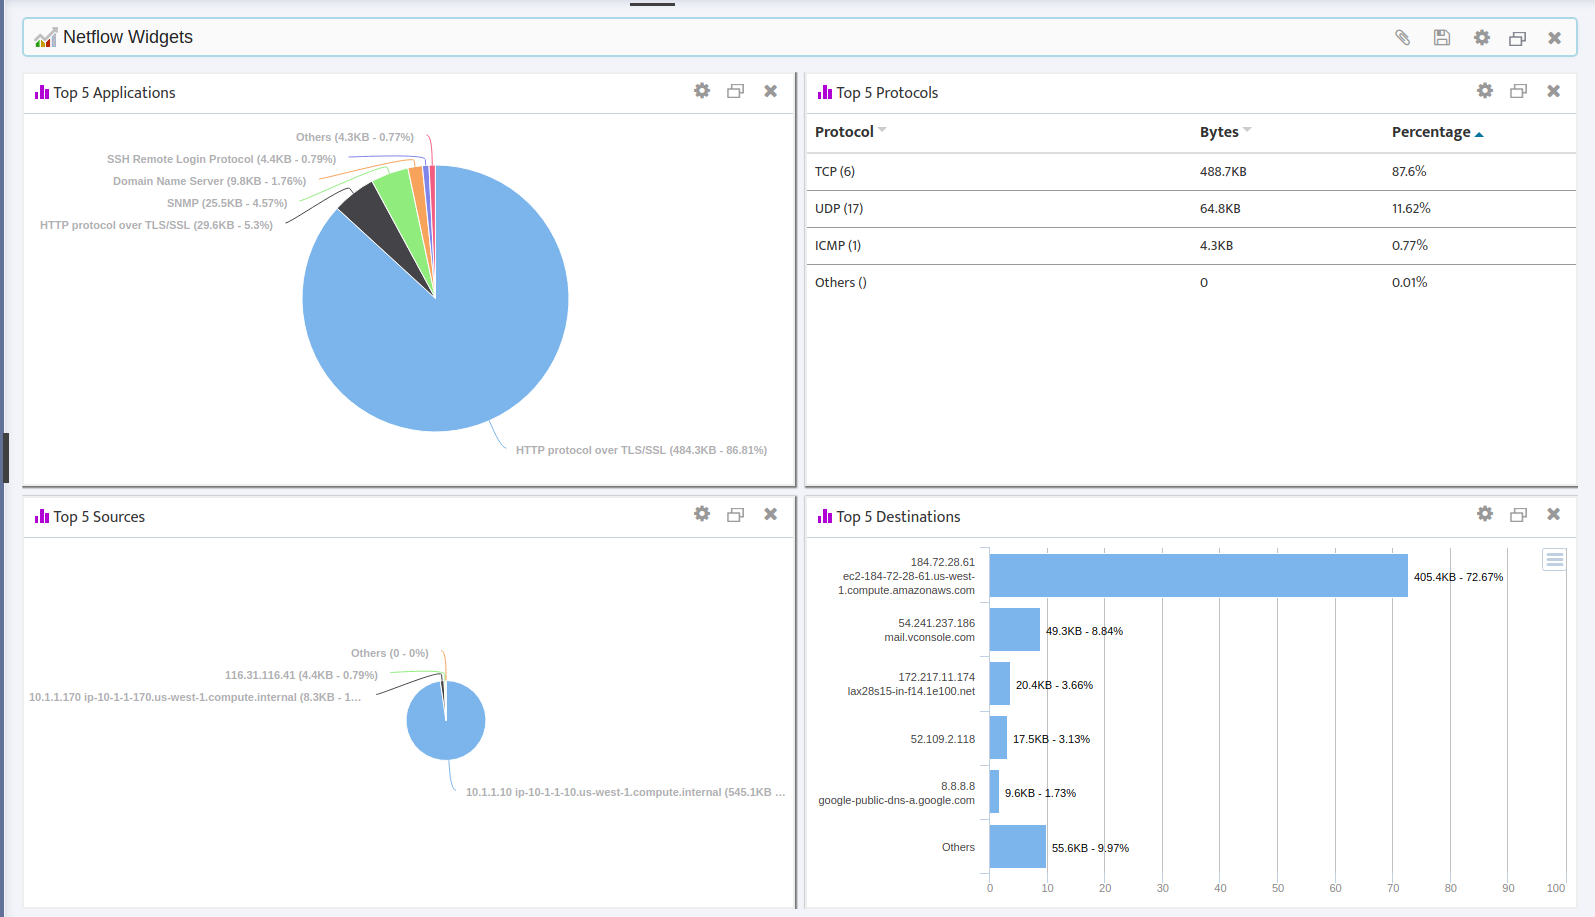
- Top 5 Applications
- Top 5 Protocols
- Top 5 Sources
- Top 5 Destinations
5.11 Call Manager
- Call Manager Health
5.12 AWS
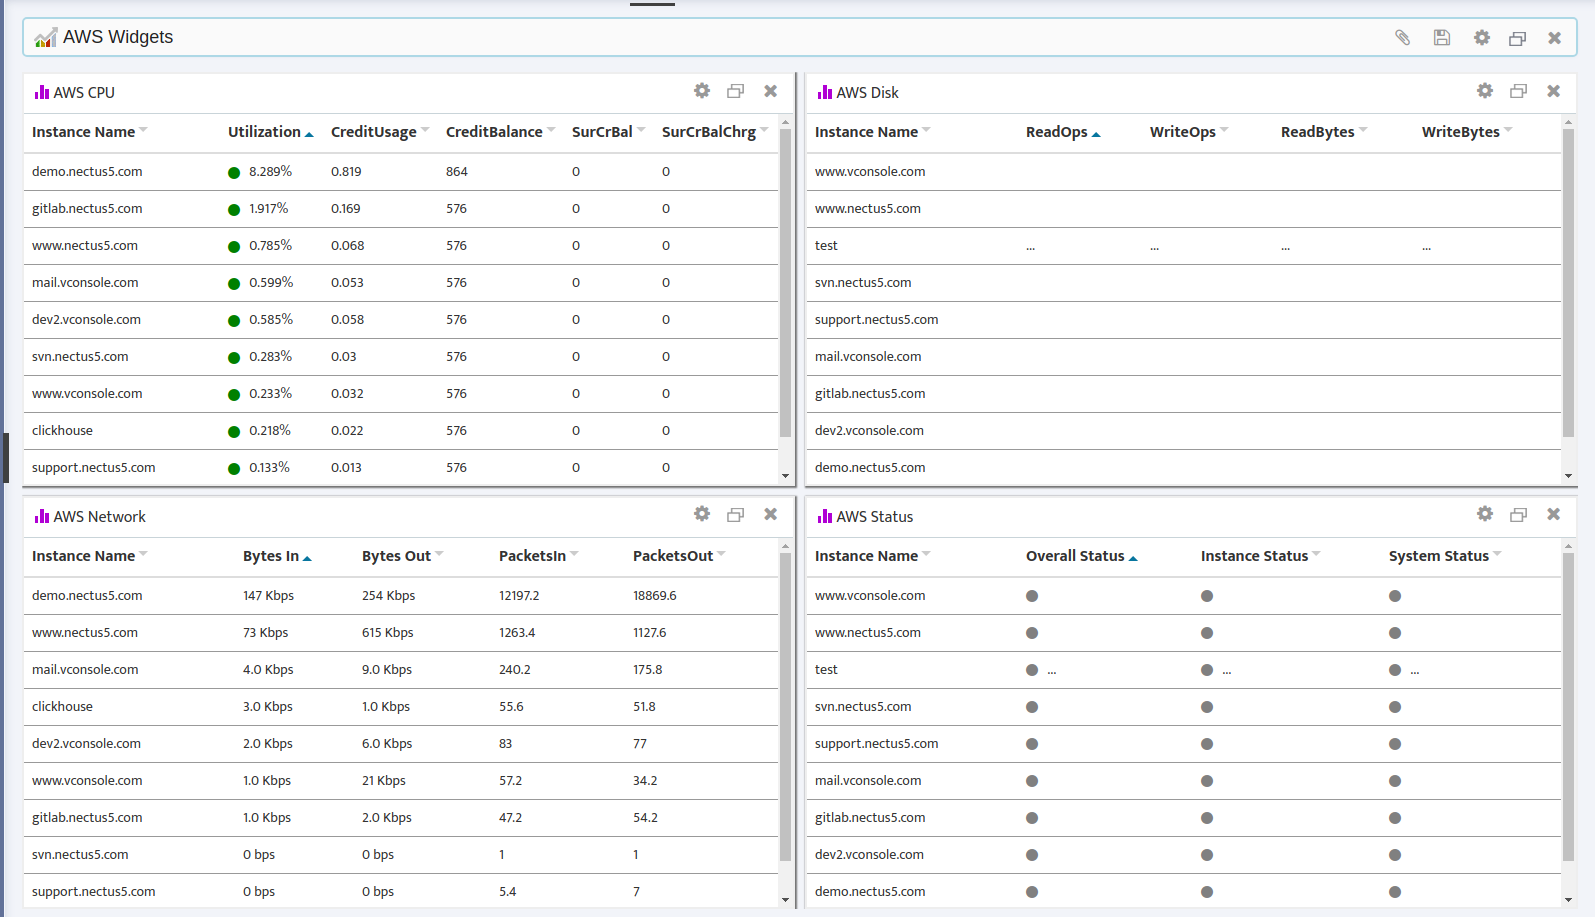
- AWS CPU
- AWS Disk
- AWS Network
- AWS Status
5.13 Others
- Maintenance Schedule
- Network Uptime
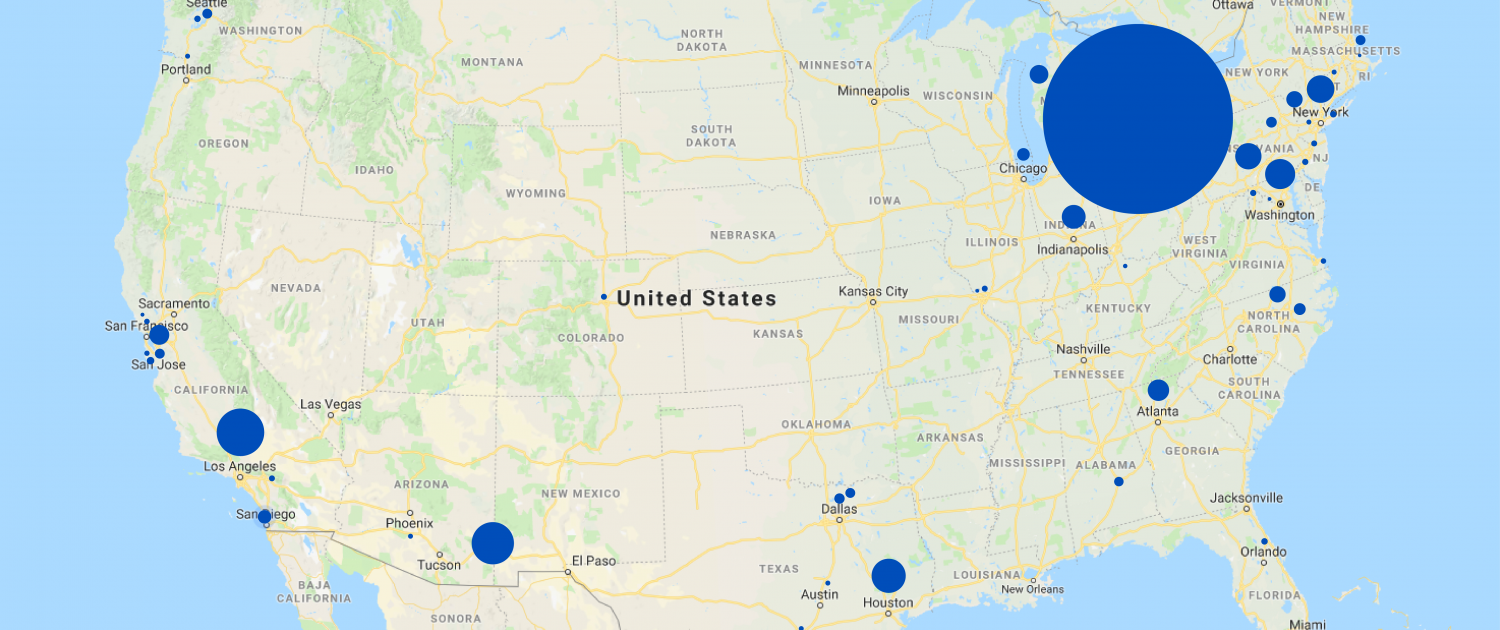
Note: Information is based on Nectus IP geo-location service
| State | City | IPv4 Addresses |
| Ohio | Columbus | 225326103 |
| California | Los Angeles | 54776440 |
| Arizona | Fort Huachuca | 54644594 |
| Texas | Houston | 42689210 |
| District of Columbia | Washington | 32721834 |
| New York | New York City | 31867103 |
| Virginia | Ashburn | 31828300 |
| Indiana | Indianapolis | 26421929 |
| Georgia | Atlanta | 25527566 |
| California | Palo Alto | 25105708 |
| Washington | Redmond | 24885468 |
| Michigan | Dearborn | 23705811 |
| North Carolina | Durham | 21588969 |
| New Jersey | Newark | 21491795 |
| California | San Diego | 21485402 |
| Illinois | Chicago | 20074587 |
| North Carolina | Raleigh | 18955414 |
| New Jersey | Bedminster | 17843408 |
| Texas | Richardson | 17241943 |
| Texas | Dallas | 16869204 |
| Massachusetts | Cambridge | 15868348 |
| California | San Jose | 15336783 |
| Washington | Seattle | 15260827 |
| Alabama | Montgomery | 14906638 |
| California | Cupertino | 13954110 |
| Washington | Bellevue | 13800919 |
| Connecticut | Fairfield | 13507953 |
| California | San Francisco | 12561267 |
| Pennsylvania | Philadelphia | 12464449 |
| Virginia | Reston | 11731922 |
| Florida | Lake Mary | 10572081 |
| New Jersey | Mount Laurel | 10087552 |
| Colorado | Denver | 9869523 |
| Missouri | Saint Louis | 9426794 |
| California | Norwalk | 9273764 |
| Virginia | Virginia Beach | 9107341 |
| Michigan | Ann Arbor | 8772940 |
| California | Mountain View | 8474238 |
| Connecticut | Middletown | 8241397 |
| Texas | San Antonio | 7877211 |
| Texas | Austin | 7734993 |
| Arizona | Phoenix | 7649529 |
| Oregon | Portland | 7600141 |
| New Jersey | Rahway | 7312241 |
| Florida | Miami | 6713810 |
| Ohio | Cincinnati | 6688810 |
| California | Concord | 6607183 |
| Virginia | Dulles | 6470388 |
| Missouri | Town and Country | 5898488 |
| Massachusetts | Boston | 5557232 |
| Louisiana | Monroe | 5300043 |
| Colorado | Greenwood Village | 5070591 |
| Pennsylvania | Pittsburgh | 4780729 |
| Missouri | Kansas City | 4578123 |
| Virginia | Herndon | 4492530 |
| Michigan | Detroit | 4336217 |
| Pennsylvania | Doylestown | 4203957 |
| North Carolina | Charlotte | 4085710 |
| Tennessee | Nashville | 3916537 |
| Georgia | Duluth | 3805720 |
| Nevada | Las Vegas | 3792683 |
| Illinois | Naperville | 3716723 |
| Florida | Orlando | 3665033 |
| California | Sacramento | 3601243 |
| Utah | Salt Lake City | 3592200 |
| Alabama | Redstone Arsenal | 3428226 |
| Minnesota | Minneapolis | 3412363 |
| Florida | Tampa | 3400441 |
| New Jersey | Morristown | 3304100 |
| California | Santa Clara | 3252933 |
| New York | Rochester | 3189712 |
| Maryland | Baltimore | 3079657 |
| Minnesota | Saint Paul | 3019512 |
| Arizona | Kingman | 2983075 |
| Massachusetts | Springfield | 2927039 |
| Wisconsin | Milwaukee | 2811053 |
| Colorado | Fort Collins | 2752782 |
| Wisconsin | Madison | 2732615 |
| California | Belmont | 2725536 |
| Texas | Plano | 2671935 |
| Virginia | Arlington | 2668836 |
| Connecticut | Stamford | 2609471 |
| Ohio | Cleveland | 2600011 |
| Kansas | Overland Park | 2528866 |
| Texas | Irving | 2512563 |
| Kentucky | Richmond | 2509411 |
| Texas | Fort Worth | 2494944 |
| Arkansas | Little Rock | 2446145 |
| Florida | Jacksonville | 2423627 |
| Missouri | Columbia | 2266295 |
| Oregon | Beaverton | 2224613 |
| New York | Buffalo | 2210272 |
| California | San Ramon | 2131203 |
| Ohio | Akron | 2098568 |
| California | Pleasanton | 2097585 |
| Maryland | Rockville | 2072266 |
| California | San Mateo | 2044008 |
| Nebraska | Omaha | 2020147 |
| New York | Albany | 2018827 |
Create an Outage Map
In this chapter, you’ll learn how to create and use Outage Maps. An Outage Map is a graphical representation of the status of the Sites in your organization. Using real world maps and GPS coordinates, an Outage Map instantly shows you outages for any of your Sites in any region of the world.
This chapter covers how to:
- Obtain and Configure a Google Map API Key
- Create an Empty Outage Map Dashboard
- Place Sites on the Outage Map
- Configure Outage Map Parameters
Obtain and Configure a Google Map API Key
Nectus needs an API key to work with Google Maps. Obtaining a Google Map API Key is outside the scope of this guide. Google provides detailed instructions for obtaining a key at:
https://developers.google.com/maps/documentation/javascript/get-api-key
Once you acquire a key, follow these steps to configure Nectus to work with your key:
- To open the Map Integration dialog, go to the Nectus Top Menu and navigate to: Settings -> General Settings -> Map Integration.
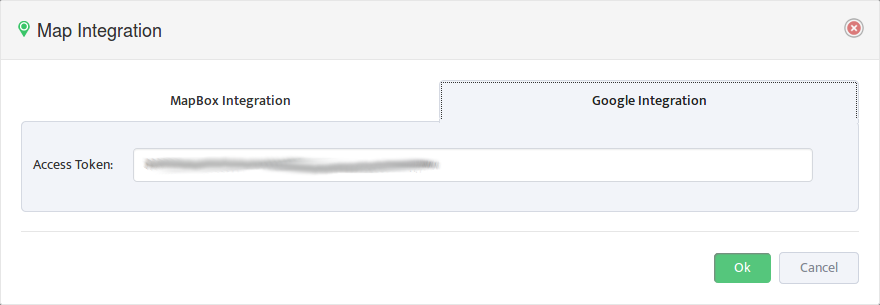
- Enter your API Key on the Google Integration tab.
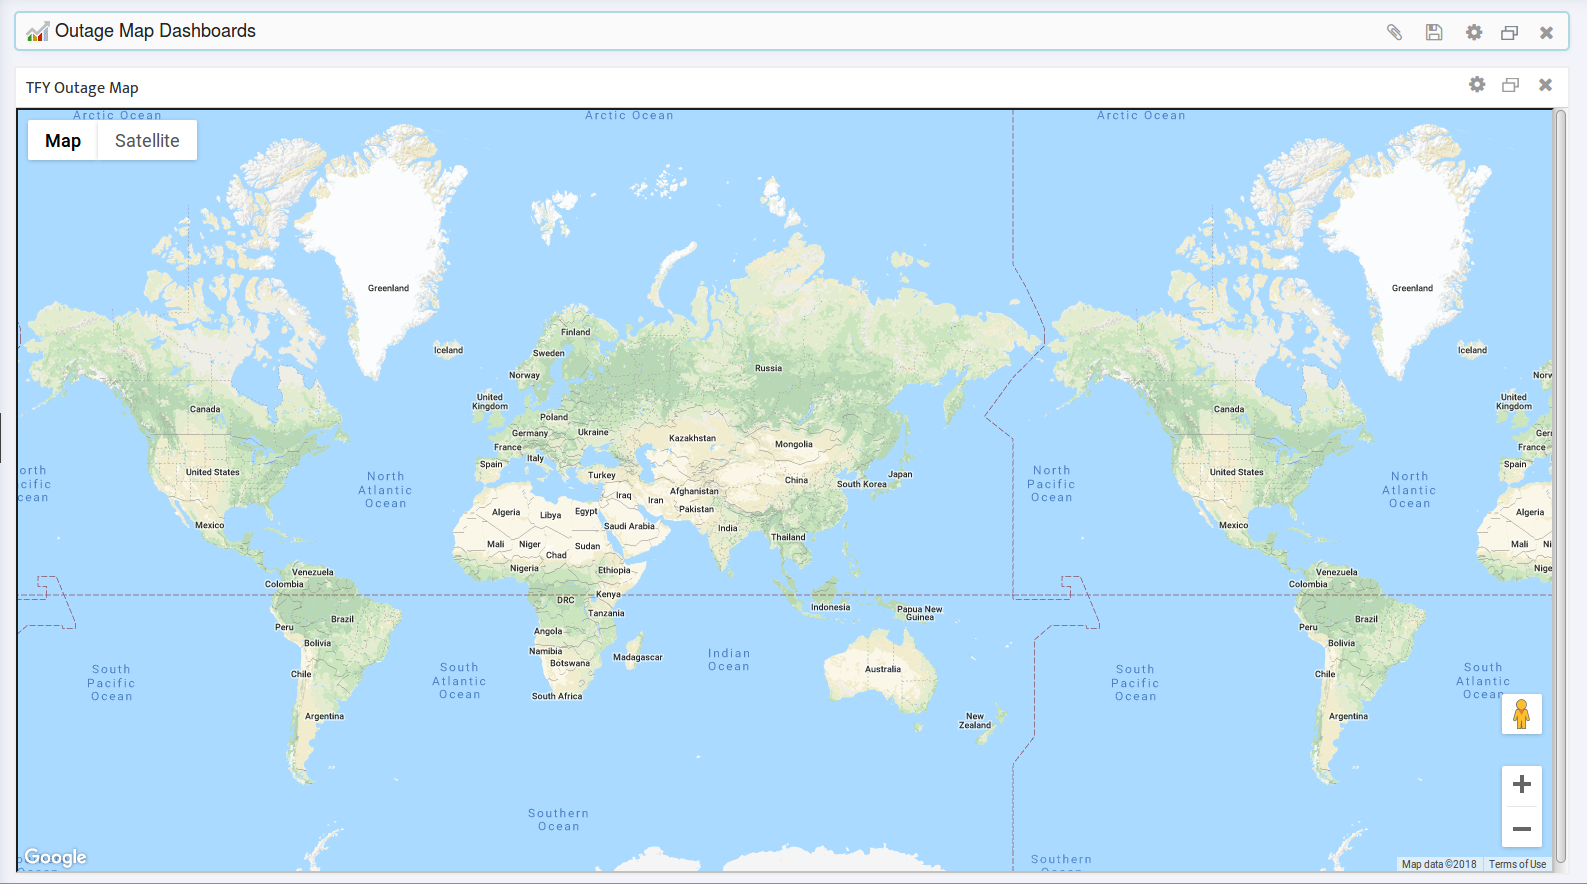
2. Create an Empty Outage Map
To create an empty Outage Map, go to the Nectus Top Menu then navigate to: Monitoring -> Outage Map Dashboards -> Outage Map Dashboard.
Note: Nectus supports up to 10 maps and can display any or all of them simultaneously. See Section 2.3 for instructions on creating and displaying additional maps.
2.1 Zoom In to the Geographical Area of Interest
- Zoom in to the geographical area you are interested in.
- Click Save on the Outage Map Dashboard so Nectus will open this map to this geographical location in the future.
2.2 Assign and Save a Map Name
- To assign and save a name, click the map’s Settings button to open the Settings dialog.
- Enter the new name in the Title field.
2.3 Display Multiple Maps Simultaneously
It can sometimes be helpful to display multiple Outage Maps simultaneously. Nectus can display up to 10 maps at once. Each map has its own adjustable settings and can be zoomed and configured independently.
- To display multiple maps simultaneously, open the Dashboard Widgets dialog by clicking the Outage Map Dashboards Settings icon. Select the Outage Map tab.
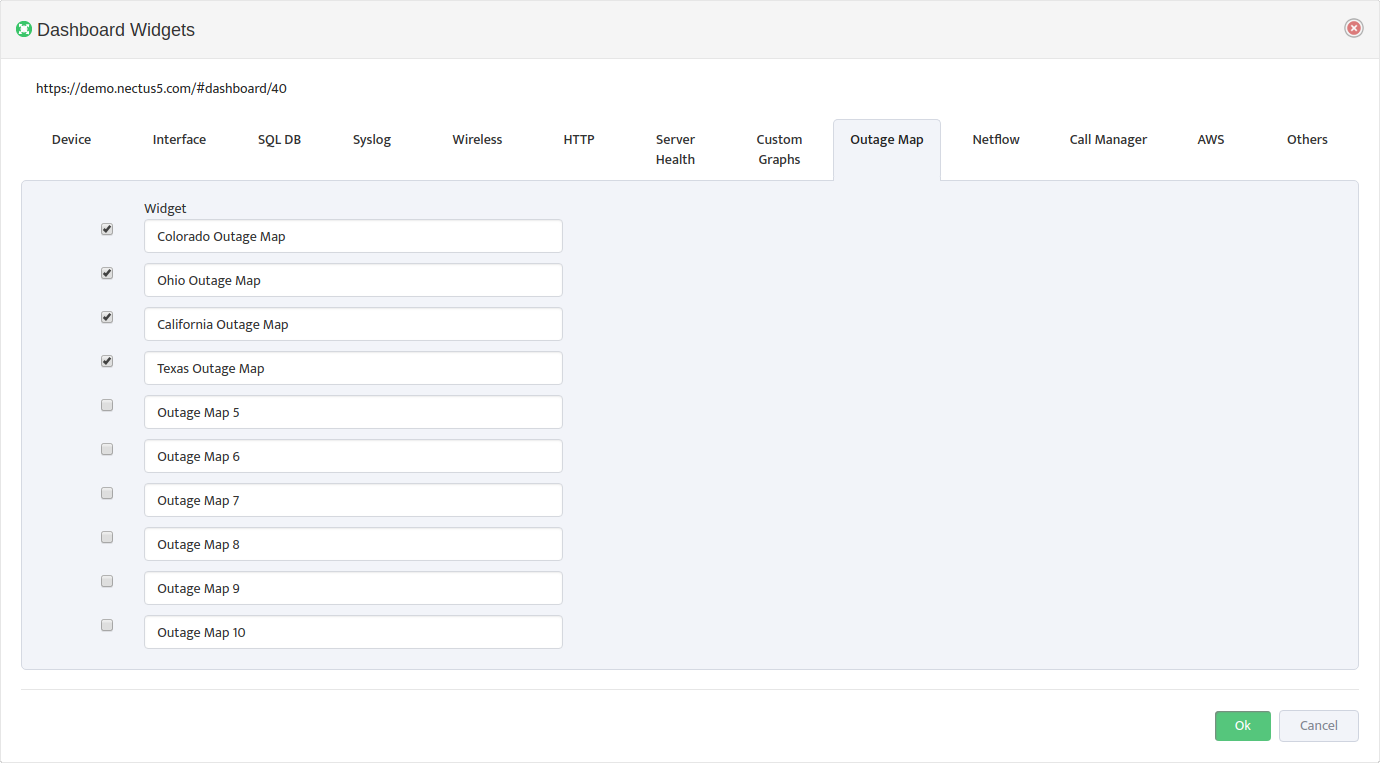
- Check the Outage Maps you want to display. You can also edit their names here if desired. Nectus displays all the checked maps.
3. Place Sites on the Outage Map
To place a Site on the Outage Map, you need to enter the GPS coordinates in the Site Properties. You can either enter the coordinates manually, or you can let Nectus derive the coordinates of the Site from its Address.
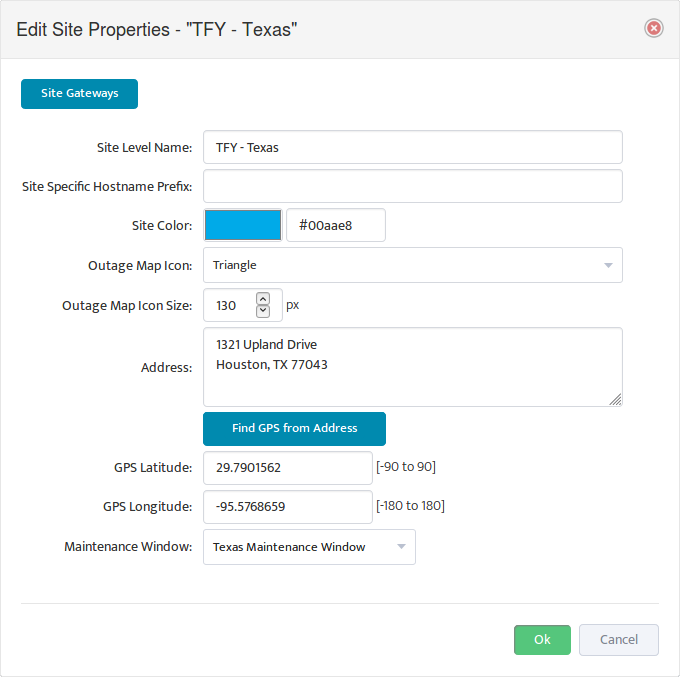
3.1 Enter the GPS Coordinates Manually
Enter the GPS coordinates in the GPS Latitude and GPS Longitude fields.
3.2 Derive GPS Coordinates from the Address
If you don’t know the GPS coordinates of the Site, enter the Site Address and click Find GPS from Address. Nectus derives the GPS coordinates from the Address and enters them for you.
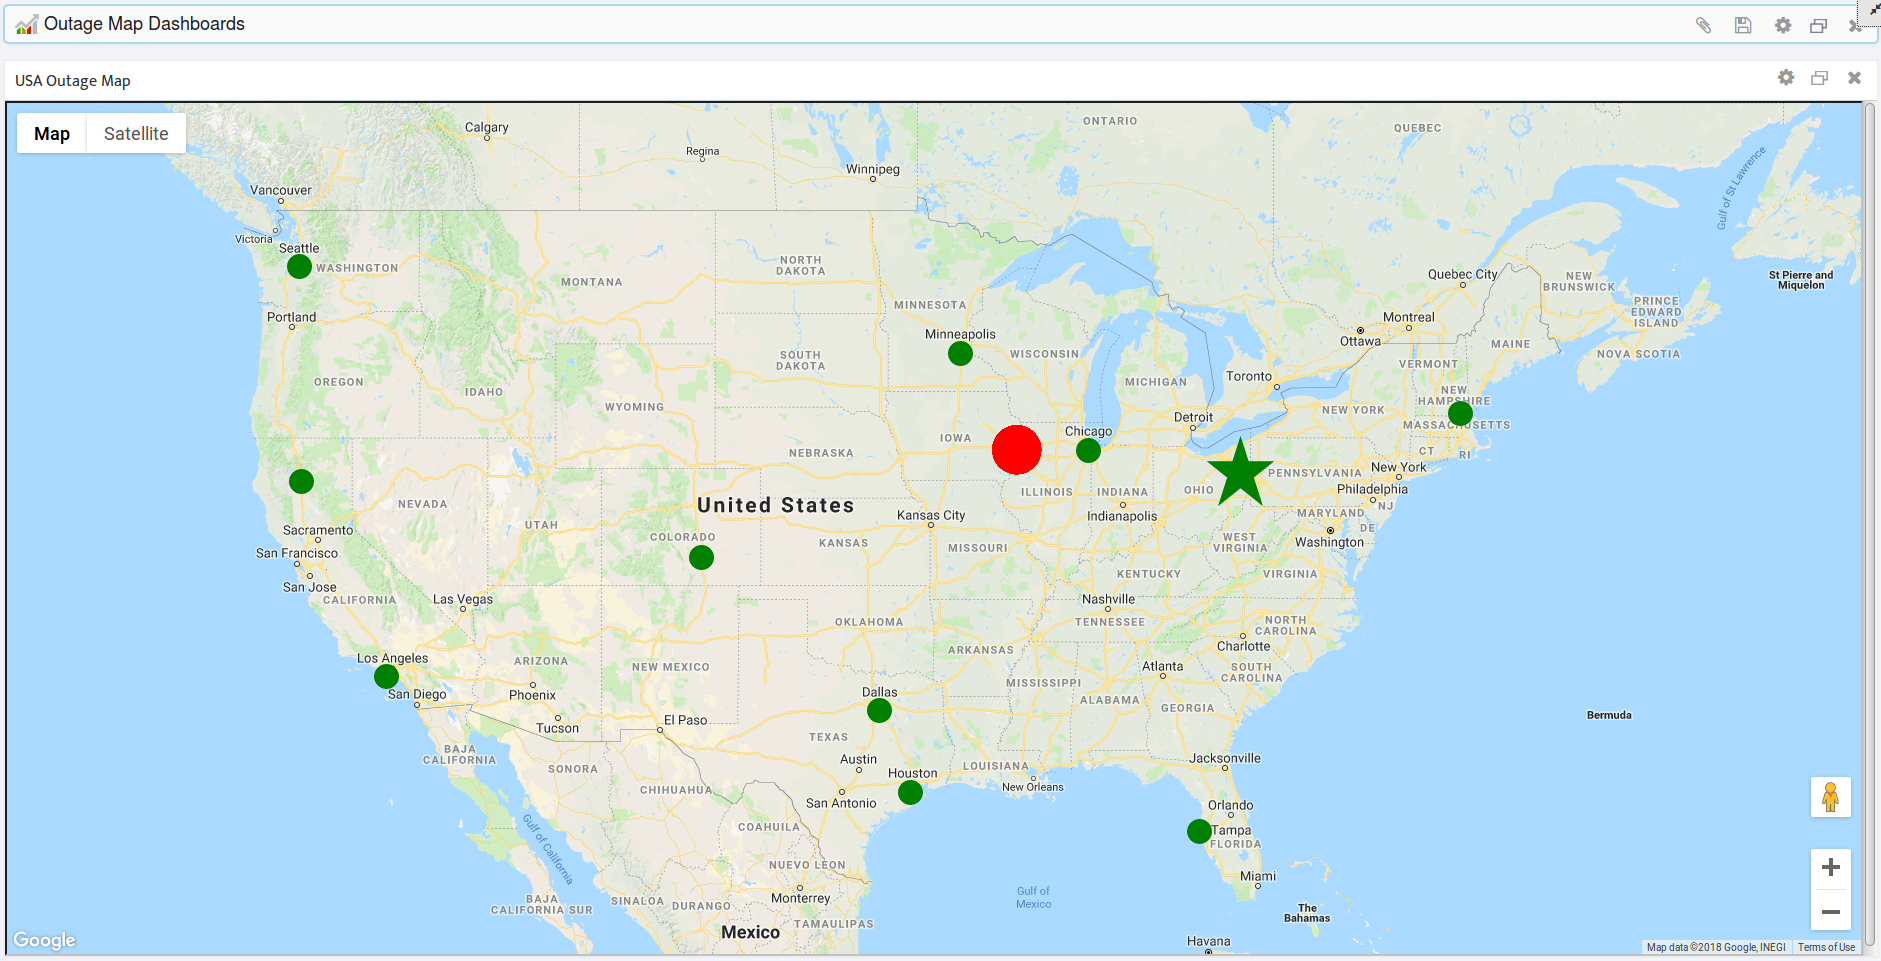
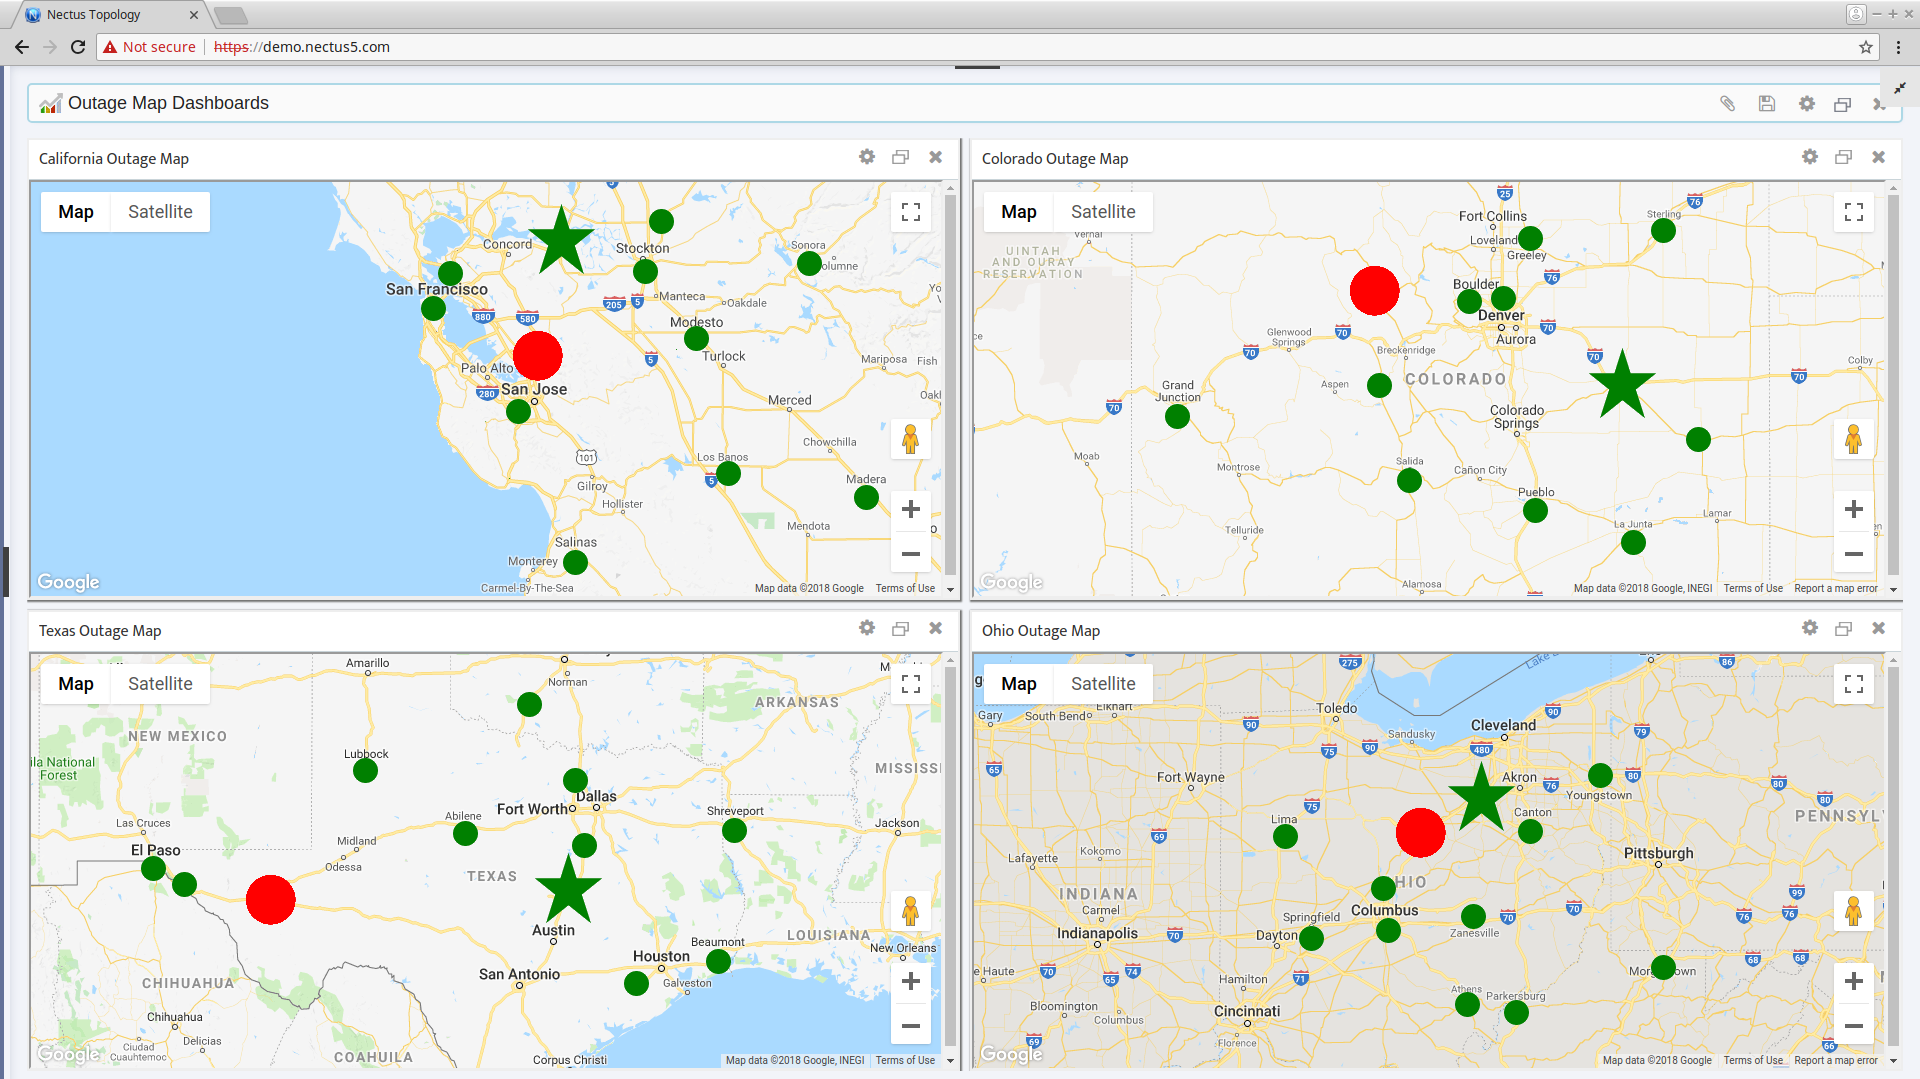
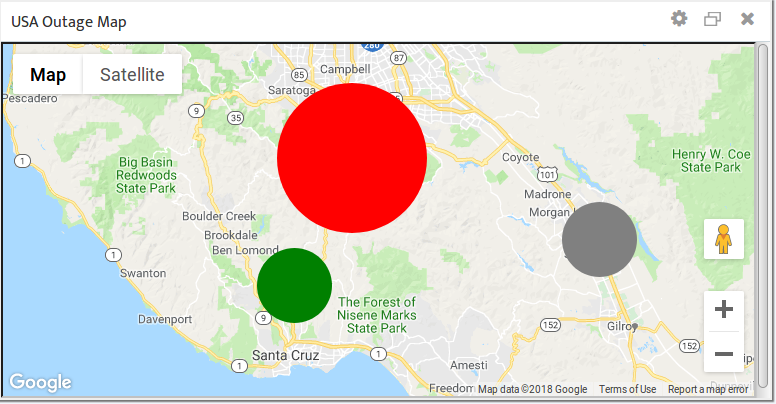
3.3 Understand Site Colors
The color of a Site’s icon on the map gives you an easy way to check the status of the Devices at that Site. Each Site icon can have one of three colors:
- Grey – The Site has no Devices assigned to it.
- Green – All the Devices assigned to the Site are “Up”.
- Red – One or more of the Devices at the Site is “Down”. When a Site goes Red, Nectus also increases the size of the Site icon to help you spot it more easily.
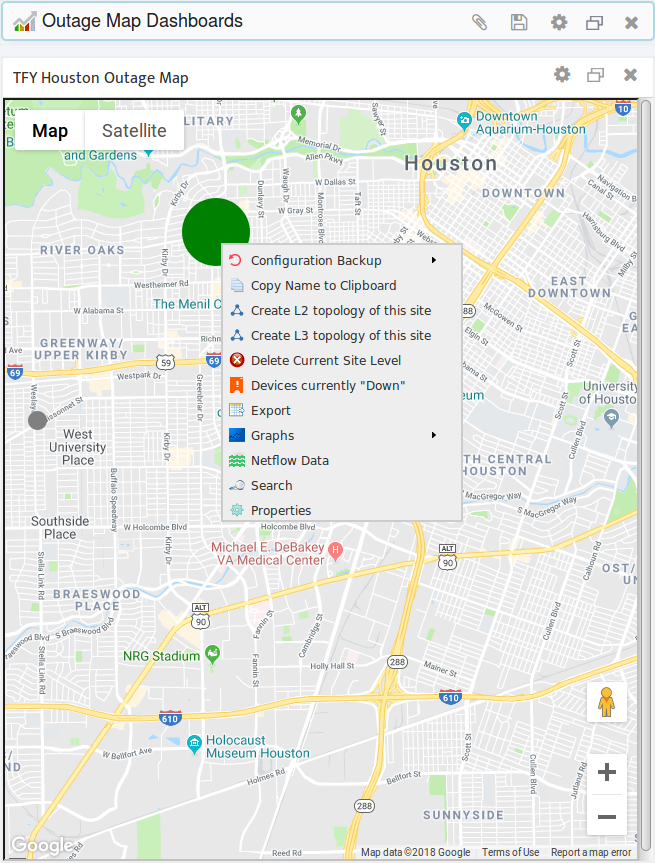
3.4 Access a Site Context Menu from a Map
If a Site appears on a map, you can open its context menu directly, without having to navigate through the Sites Panel. Simply right-click the icon of the Site.
3.5 Removing a Site from a Map
To remove a Site from any and all maps without removing the Site from the Nectus database, clear its GPS coordinates in its Site Properties.
4. Configure Outage Map Parameters
An Outage Map has several configurable parameters that control how things appear on the map. You can configure each map independently of the others, giving you maximum flexibility to get exactly the information you need. The following sections show you how to configure these parameters.
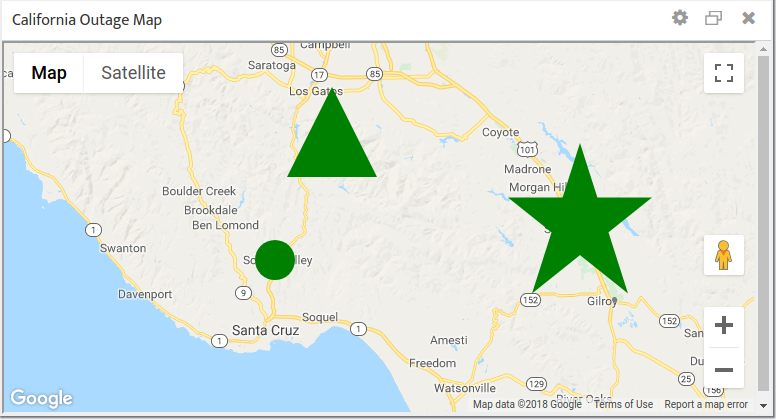
4.1 Change the Shape and Size of Individual Site Icons
Changing the shape or size of certain Site icons makes it easy to pick out those Sites on a crowded map. You might make your most important Sites larger than the rest, or assign them a different shape.
To change the shape and size of individual Site icons, navigate to Site Properties. In the Outage Map Icon Size field select the icon size in pixels. Use the Outage Map Icon list to select a Circle, Star, or Triangle for the shape.
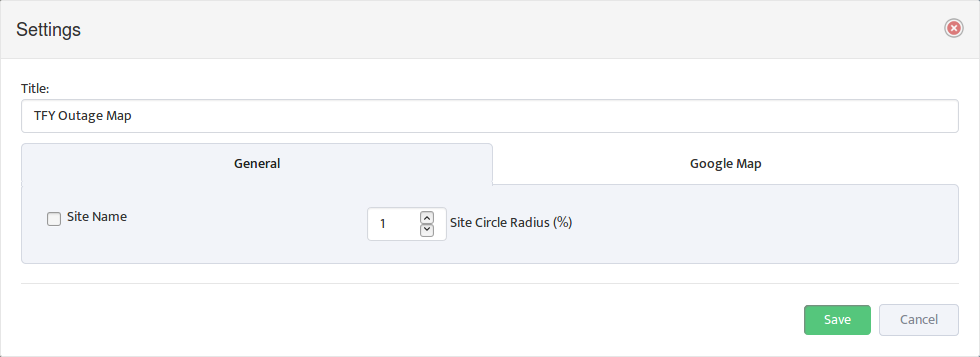
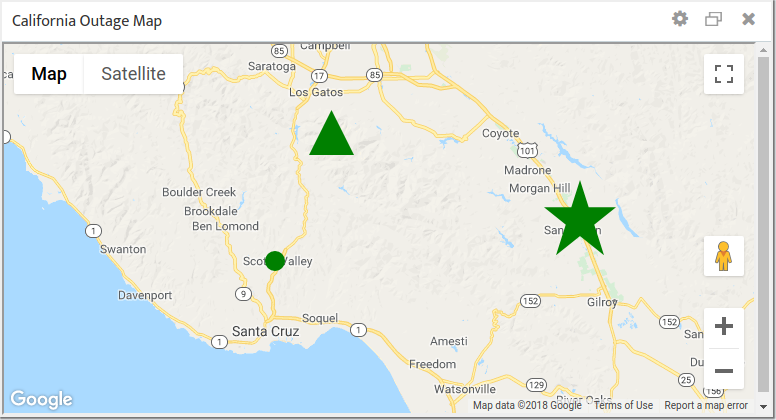
4.2 Change the Size of All the Site Icons on a Map
To scale all the icons on a map simultaneously navigate to: Map Settings -> General tab. In the Set Circle Radius (%) field enter a scaling factor that will apply to all the Site icons on this particular map. The following figure shows the map from section 4.1 with the icons scaled down to 50% of their original size.
4.3 Show or Hide Site Names
Every Site must have a Site Level Name, but you control whether Nectus displays those names on a map.
To show or hide all the Site Level Names on a map simultaneously navigate to: Map Settings -> General tab and check or uncheck Site Name.
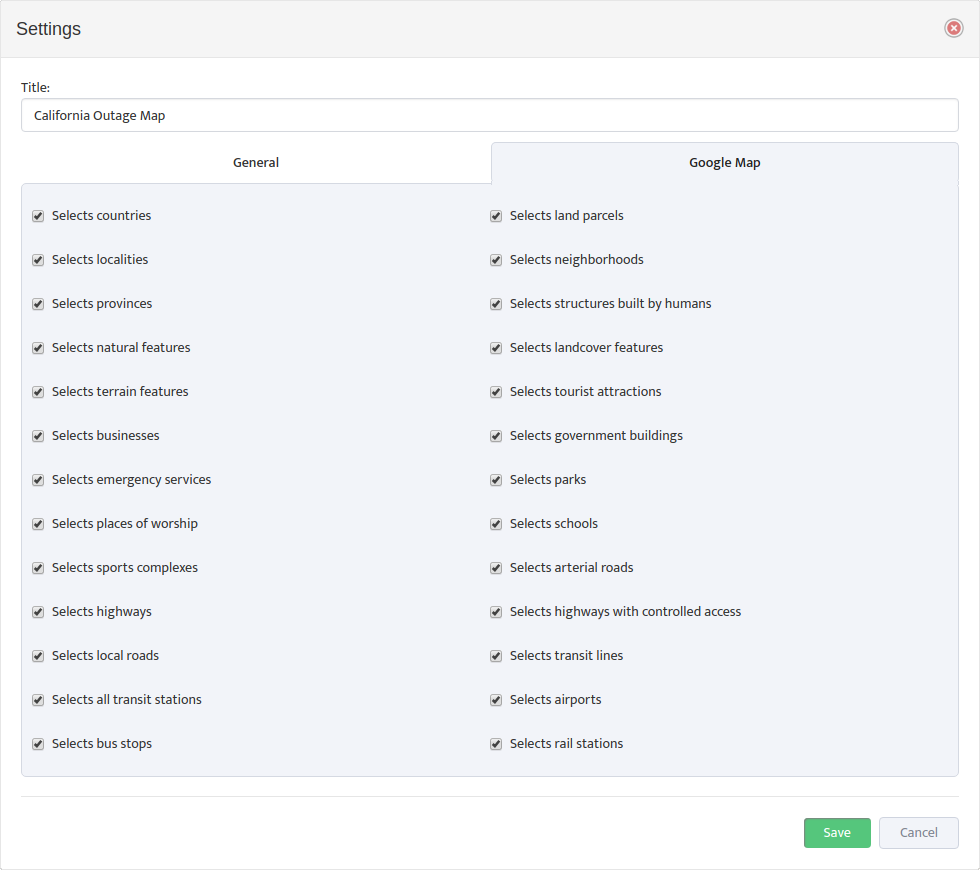
4.4 Display of Hide Map Objects
Outage Maps can display a huge amount of information, not all of which may be useful to you. You can configure a map to display only those objects that are relevant to you.
To show or hide all the Site Level Names on a map simultaneously navigate to: Map Settings -> Google Map tab. Check or uncheck Map Objects as desired.
Network and Server Uptime Calculation Considerations for Monitoring tools
Uptime is one of the most important IT infrastructure operational metrics that gives an overview how “stable” or “reliable” your IT infrastructure is with 99.9999% uptime being a platinum standard.
But how do you calculate an Uptime?
In ideal (continuous and none-discrete) world calculation of Uptime is somewhat simple.
Take number of seconds in monitoring period and number of seconds when monitored object was down and use simple formula:
Uptime = 100 – ((Outage duration / Total time) * 100)
Example:
Monitoring Period: 1 year = 31,536,000 seconds
Total Object Outage Duration: 300 seconds
Object Uptime: 99.999%
Monitored Objects achieving “six nines” uptime should only be “down” for a maximum 31.5 seconds in the 365 days.
| Uptime % | Downtime per Year |
| 99.99% | 3120 sec |
| 99.999% | 300 sec |
| 99.9999% | 31 sec |
| 99.99999% | 3 sec |
But as you get to “six nines” or higher, capabilities and configuration of monitoring tools starts to play critical role in accuracy of uptime calculations.
Single Server Example
Let’s start with an example of Uptime calculation for a single device such as a Server.
First, we need to define what constitutes a server being up or down and what tools we planning to use to determine its state.
Let assume that we use a classic ICMP v4 probing with ‘Polling Interval” equal to 1 second.
In other words, we will be sending Ping packets from a monitoring agent to the Server every 1 second and if server does not respond we shell consider it down.
Simple enough?
Well, may be in perfect world yes, but we live in real world and packets may get lost for reason other than Server being down.
Packets may get lost due to traffic shaping, CRC errors and many other reasons. So, to prevent influx of false positive Server down events we need to increase number
of consecutive packets that must be missed to consider Server to be “down” to a number greater than 1.
Let’s call this number an “Assurance Multiplier”.
Greater “Assurance Multiplier” values shell result in greater probability that we detect an actual Server down event. But at the same time greater “Assurance Multiplier” will result in slower detection time for Server down events and inability to detect short-lived outages with duration time less than (Assurance Multiplier * Polling interval) seconds.
We also need to introduce two new parameters: “Actual Outage Duration” and “Detected Outage Duration” to reflect the fact that duration of the Server outage calculated by monitoring agent may be slightly greater than actual outage of the Server due to the fact that duration of polling interval is > 0.
Summary
“Polling Interval” – Time between two consecutive state polls.
“Assurance multiplier” – Number of consecutive polling intervals when object’s state must be Down to consider monitored object to be truly down.
“Outage Detection Time” – Time is takes for monitoring Agent to detect an outage of the monitored object after outage has started.
“Actual Outage Duration” – Actual Outage Duration of the monitored object.
“Calculated Outage Duration” – Duration of the Outage as calculated by the monitored object.
Considering that Actual Outage Duration > (Polling Interval * Assurance Multiple) worst case scenarios should be calculated as following:
Outage Detection Time = (Polling Interval * Assurance Multiplier) + Polling Interval
Calculated Outage Duration = (Polling Interval * Assurance Multiplier) + 2 * Polling Interval
Lets do the math with following Monitoring Agent Configuration Example : Polling Interval = 1 Sec and Assurance Multiplier = 3
We get following results:
Outage Detection Time = 4 Seconds
Best Detectable Actual Outage > 3 Seconds
Best Calculated Outage Duration > 5 Seconds
Now we can see that provided example of Monitoring Agent configuration is sufficient for grading Server’s Uptime as 99.9999% but not sufficient for 99.99999% classification.
To classify monitoring tool for 99.99999% accuracy you need to decrease Polling Interval or decrease Assurance Multiplier by at least 30%.
So next time when you see a 99.99999% Uptime calculated by a Monitoring tool with a Polling interval of 5 minutes you know that it is likely not true.
It gets more interesting when we move into calculation of Uptime for a Network rather than a single object like Server.