Creating custom Dashboards in Nectus
Creating Custom Dashboards
In this chapter, you’ll learn how to create Custom Dashboards. Nectus lets you create an unlimited number of Custom Dashboards, making it easy to focus on exactly the information you need at any time.
This chapter covers how to:
- Create a New Custom Dashboard
- Add Widgets
- Manage Widgets
- Manage Dashboards
- Available Widgets by Category
1. Create a New Custom Dashboard
You create and configure Custom Dashboards using the Dashboard Widgets dialog box.
- To create a new Custom Dashboard, go to the Nectus Top Menu then navigate to: Monitoring -> Custom Dashboards -> Manage Custom Dashboards and click the Add Dashboard button.
- Enter a Title for the Dashboard then add widgets to it as described in Section 2.
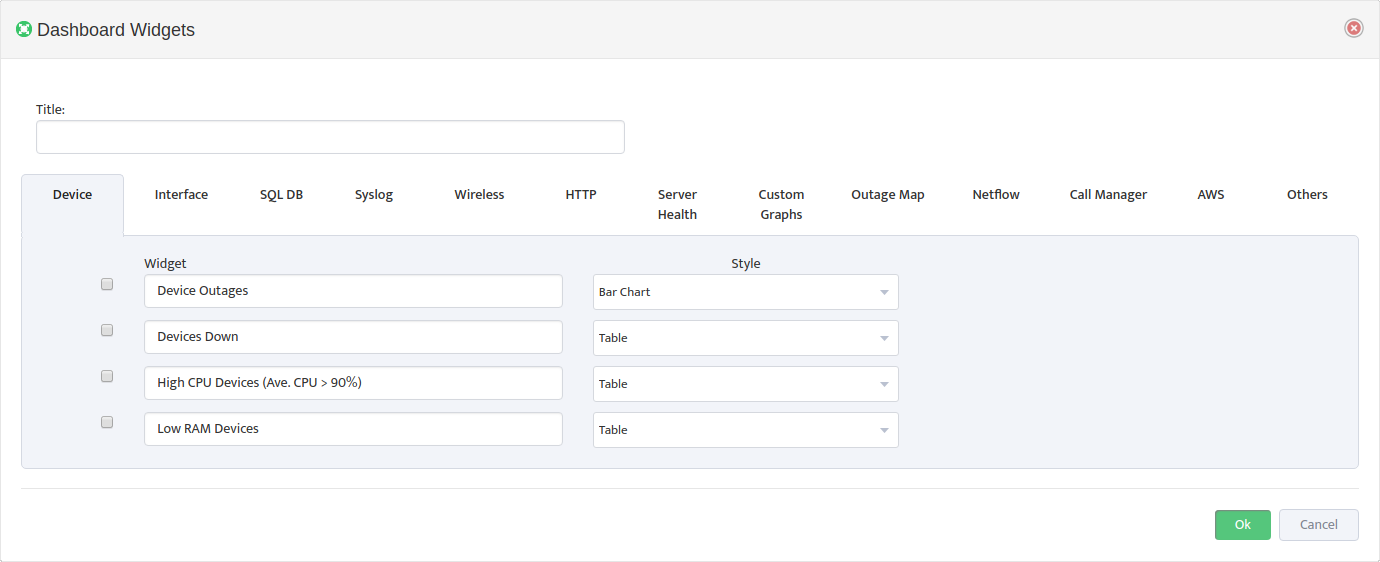
2. Add Widgets
The Dashboard Widgets dialog includes all the available Widgets grouped by Category. You can enable any number of Widgets from any number of Categories in the Dashboard.
Many Widgets have settings you can enter when you add them to the Dashboard. They may also have additional settings you configure once the Widget is live in the Dashboard. See the next section for more details.
3. Manage Widgets
Once a Widget is live in a Dashboard, you can drag it, resize it, or remove it.
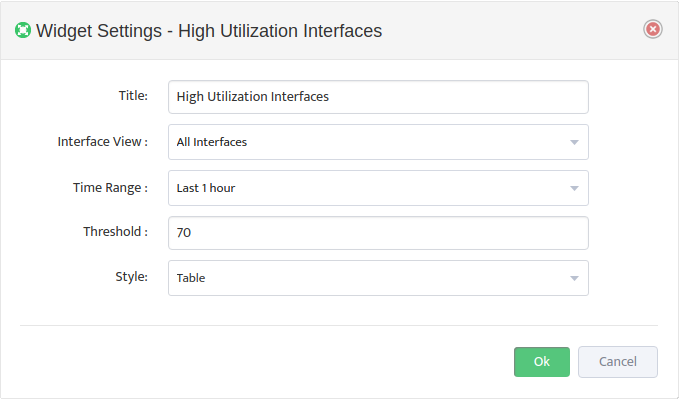
You can customize any Widget by clicking its Settings icon. Most Widgets have a Style setting you can configure. Some Widgets also have Views. Views filter the information that appears in the Widget.
In the following example, the View filters the High Utilization Interfaces Widget so only interfaces that have had utilization levels of 70% of above in the last hour appear.
To keep any changes you make to widgets, click the Dashboard’s Save icon.
4. Manage Dashboards
You manage a Dashboard by clicking the Dashboard’s Settings icon to open the Dashboard Widgets dialog box. You can change the Title, as well as add or remove Widgets.
To keep any changes you make to the Dashboard, click the Save icon.
To make this Dashboard the default, click the Open by Default icon.
5. Available Widgets by Category
Nectus gives you over 60 Widgets, divided into over a dozen Categories. This section lists the Categories and the Widgets in each Category.
5.1 Device Widgets
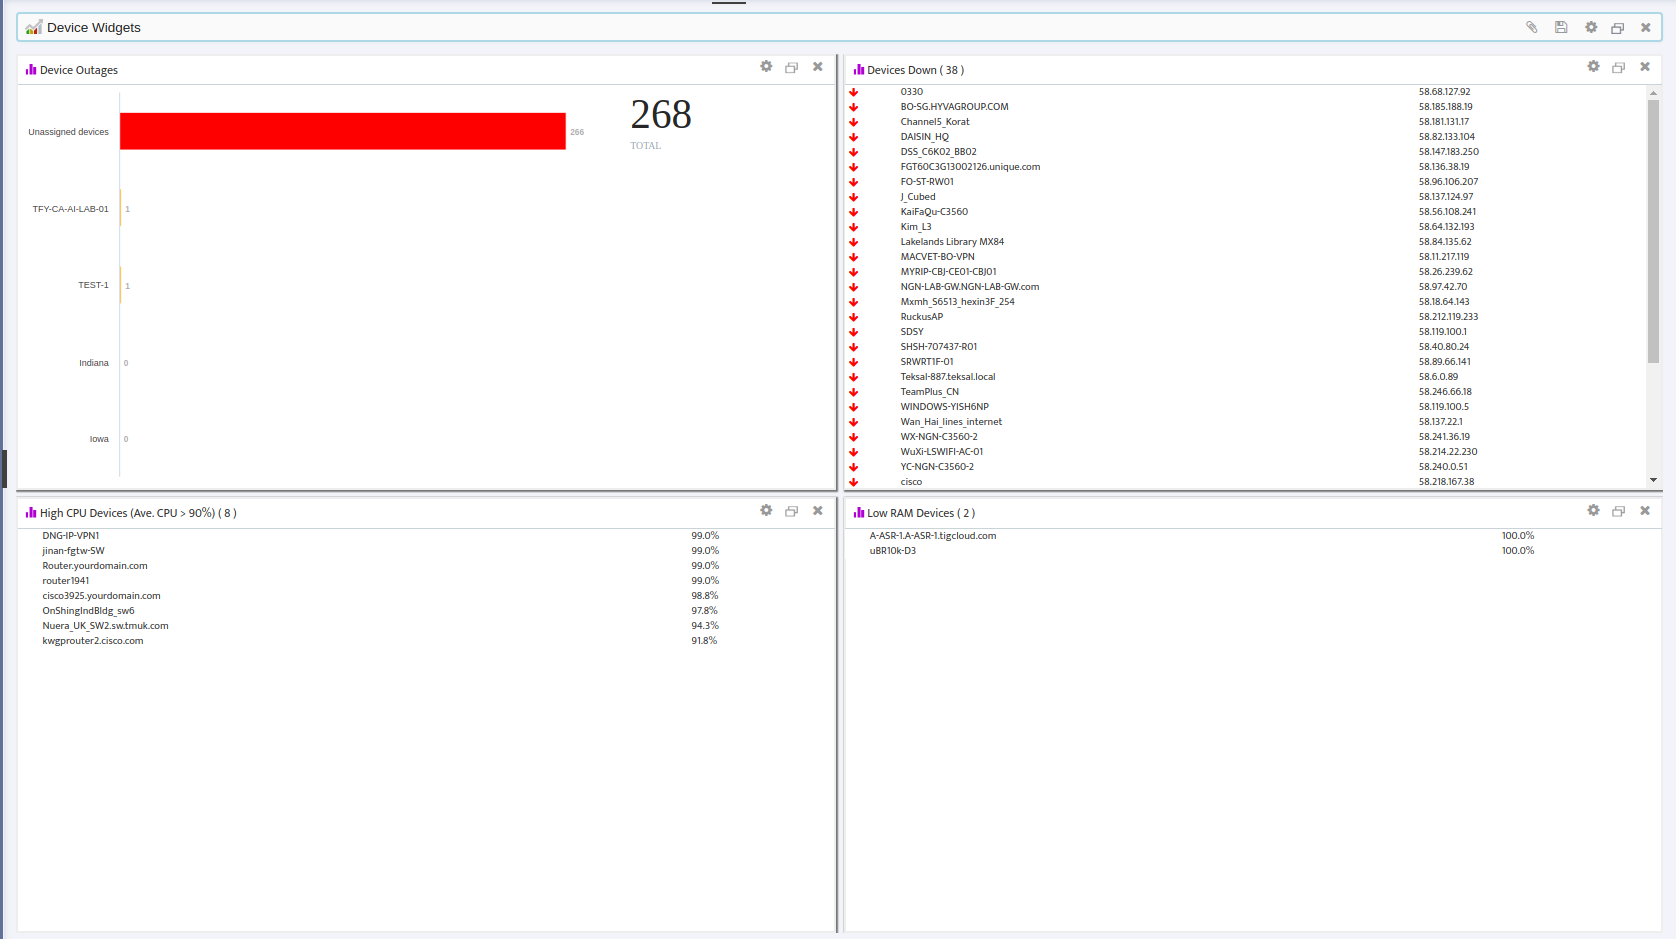
- Device Outages
- Devices Down
- High CPU Devices (Ave. CPU > 90%)
- Low RAM Devices
5.2 Interface Widgets
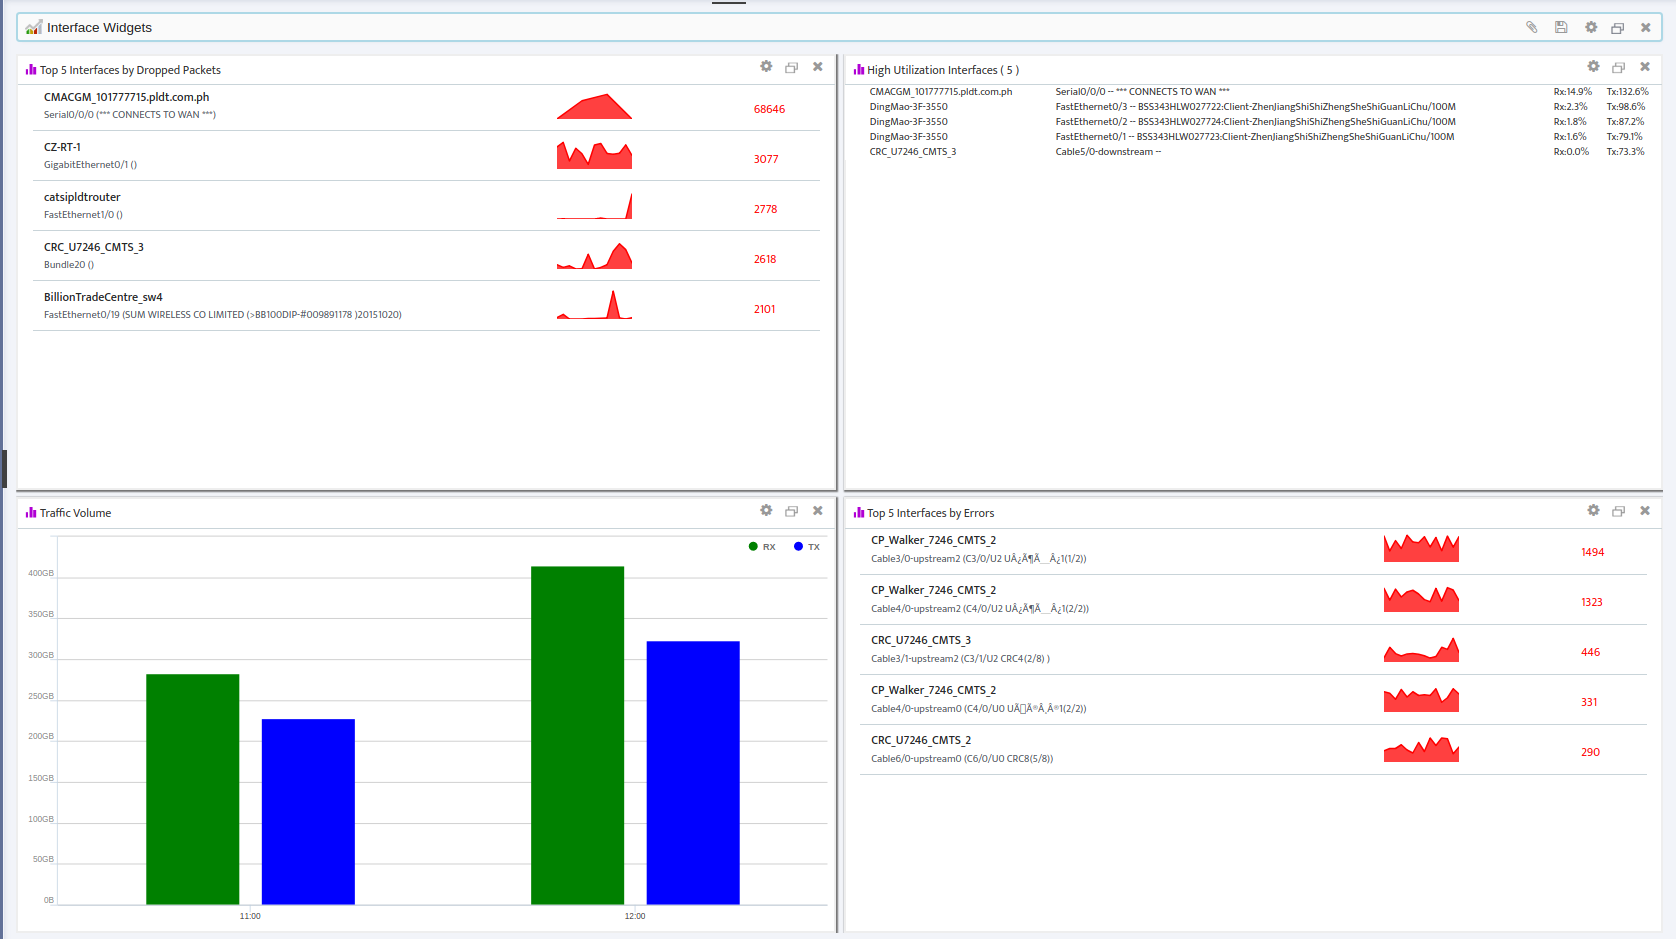
- High Utilization Interfaces
- Interface Outages
- Interfaces Down
- Top 5 Interfaces by Dropped Packets
- Top 5 Interfaces by Errors
- Top 5 Interfaces by Utilization
- Traffic Volume
5.3 SQL DB Widgets
- Resource Pool Stats
- Avg Disk Read/Write IO (ms)
- CPU Usage
- Disk Read/Write Bytes/sec
- Disk Read/Write IO/sec
- Memory Manager Metrics
- Memory Grants Pending
- Target-Total Memory
- Buffer Manager
- Buffer cache hit ratio
- Lazy write/sec
- Page life expectancy
- Page lookups/sec
- Page reads/writes sec
- Databases
- Active Transactions
- DB Data/Log size
- Log Flushes/sec
- Percent Log Used
- Running Query count
- Transactions/sec
- Write Transactions/sec
- SQL Errors
- Errors/sec
- SQL Statistics
- Batch Requests/sec
- SQL Compilations/Re-Compilations sec
- Services
- Server Services
- Sessions and Connections
- Connections
- Sessions
Locks (Total)
-
- Average Wait Time (ms)
- Lock Requests/sec
- Lock Waits/sec
- Number of Deadlocks/sec
- Agent Jobs
- Agent Jobs
5.4 Syslog Widgets
- Major Syslog Events
- Syslog (Severity 1-3)
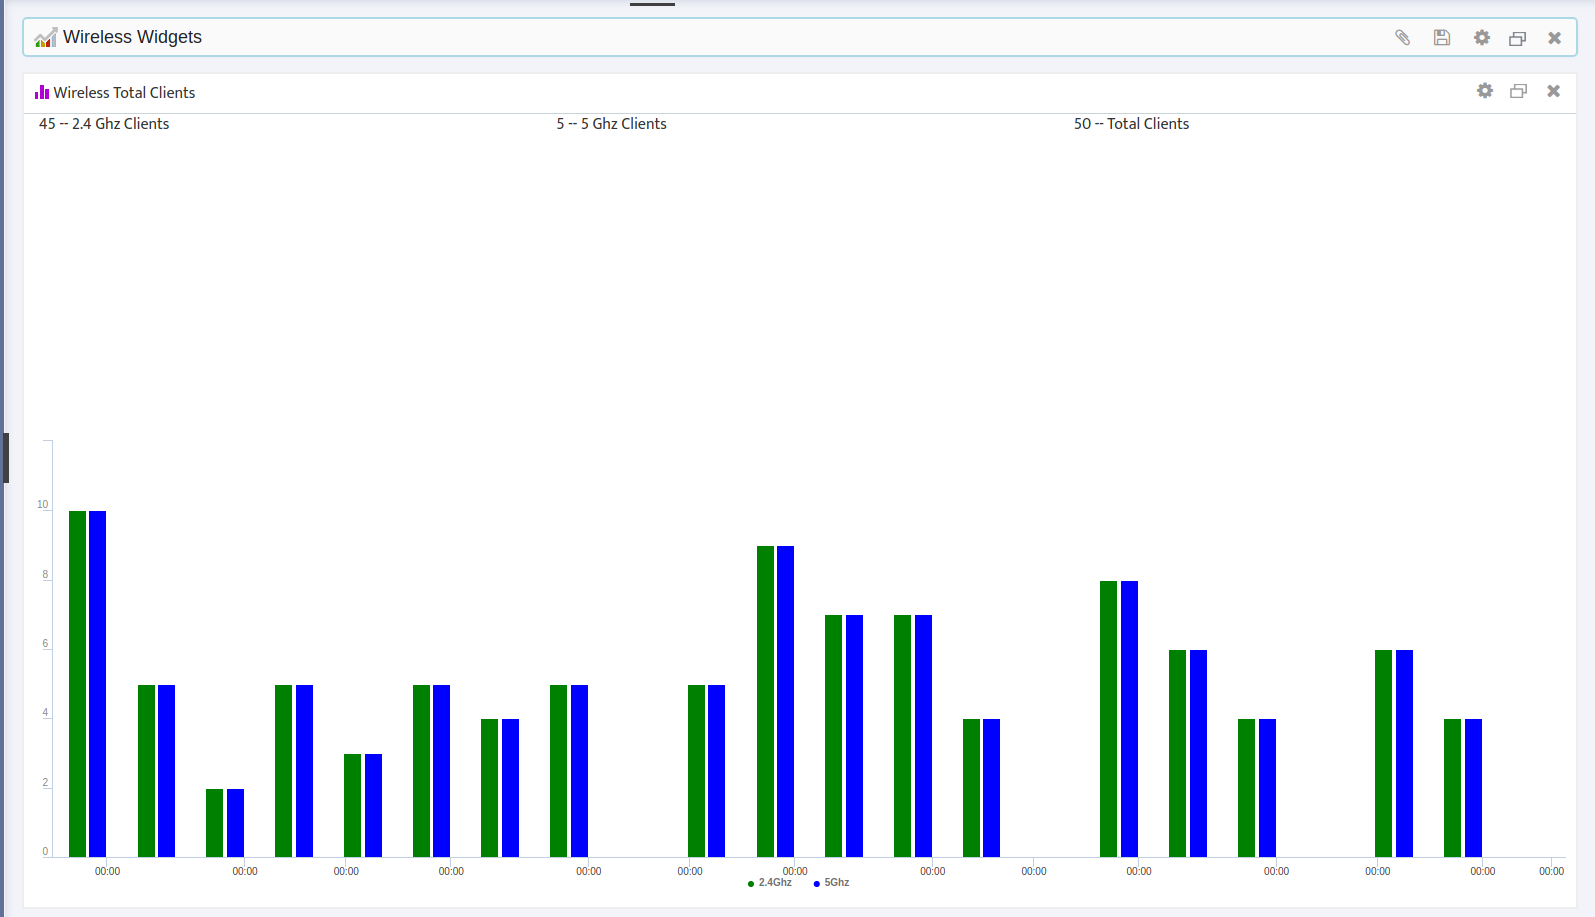
5.5 Wireless Widgets
- Wireless AP Client Load
- Wireless Controllers
- Wireless SSID Client Load
- Wireless Total Clients
5.6 HTTP Widgets
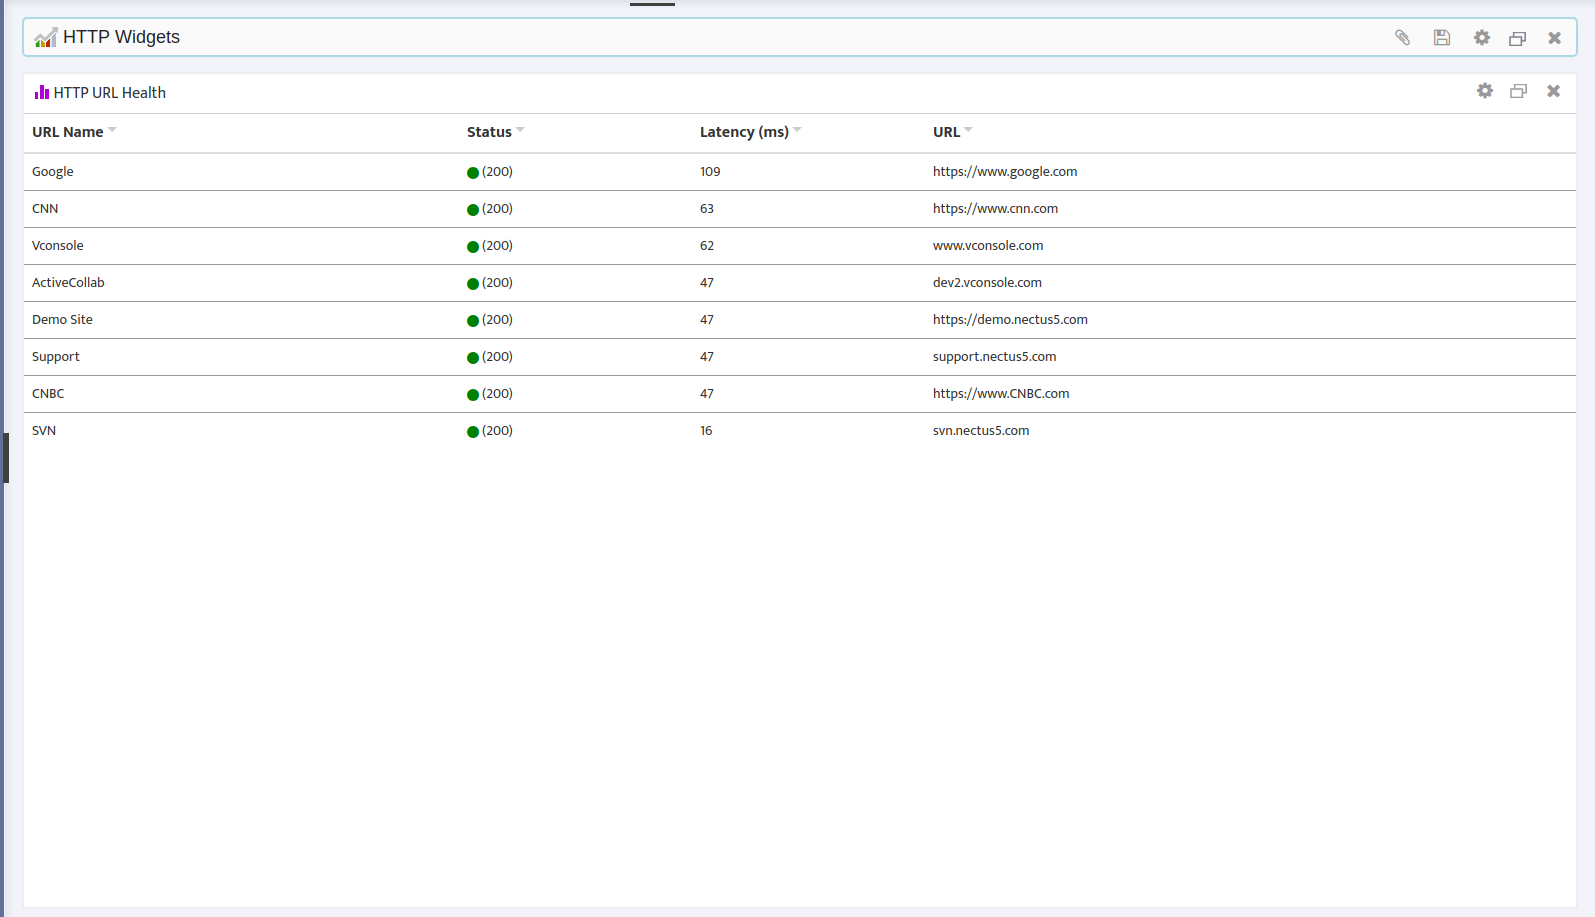
- HTTP URL Health
5.7 Server Health Widgets
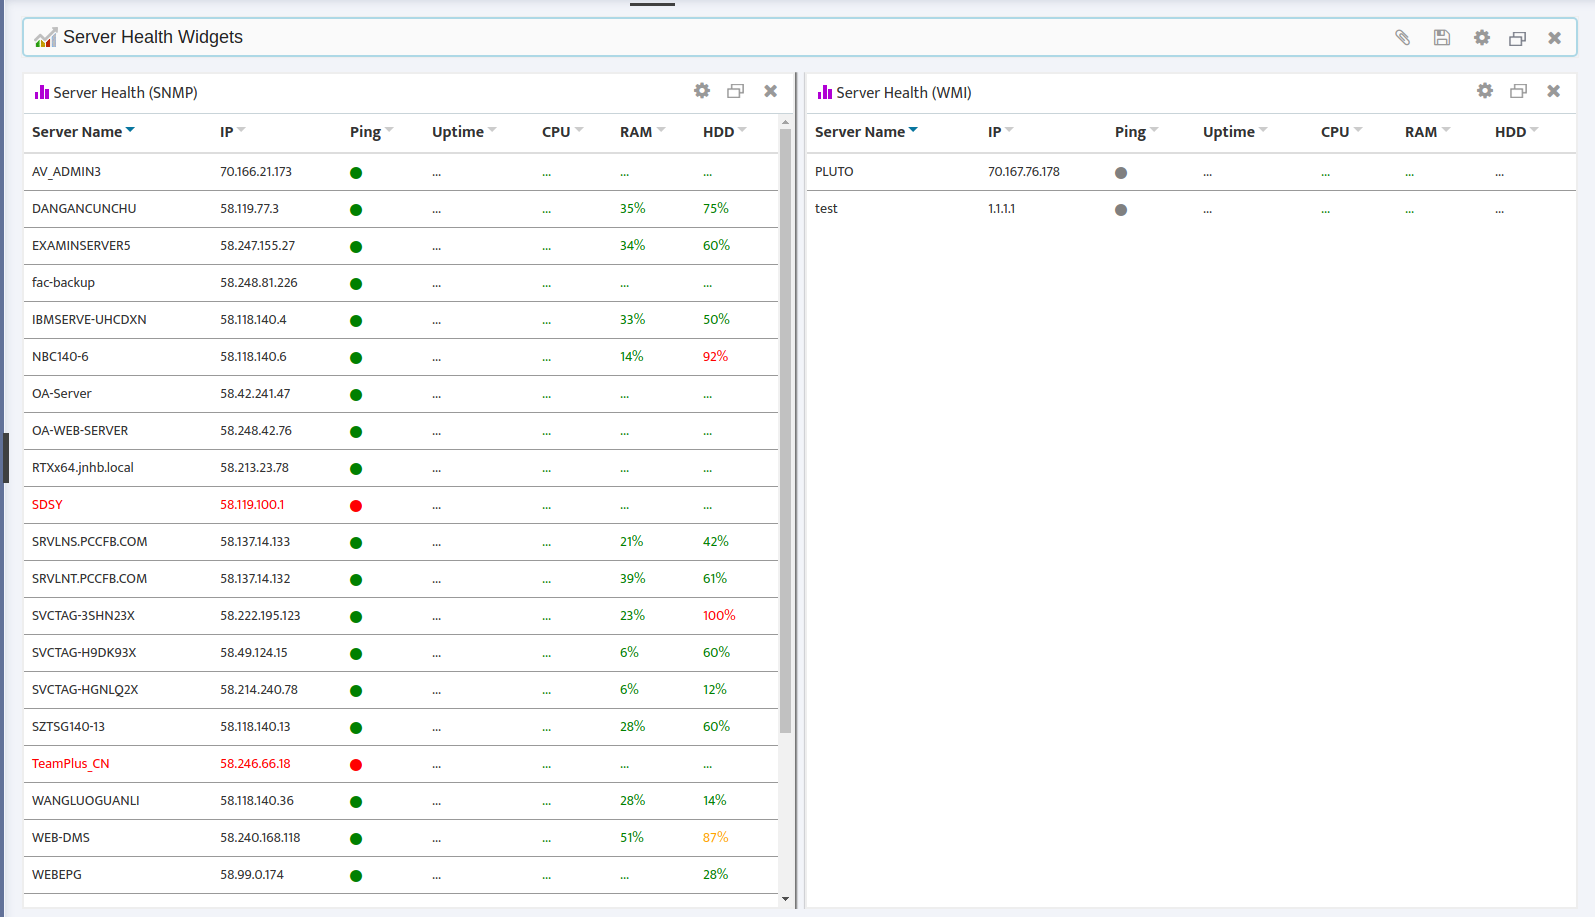
- Server Health (SNMP)
- Server Health (WMI)
5.8 Custom Graphs Widgets
- Custom Graph 1-10
5.9 Outage Map Widgets
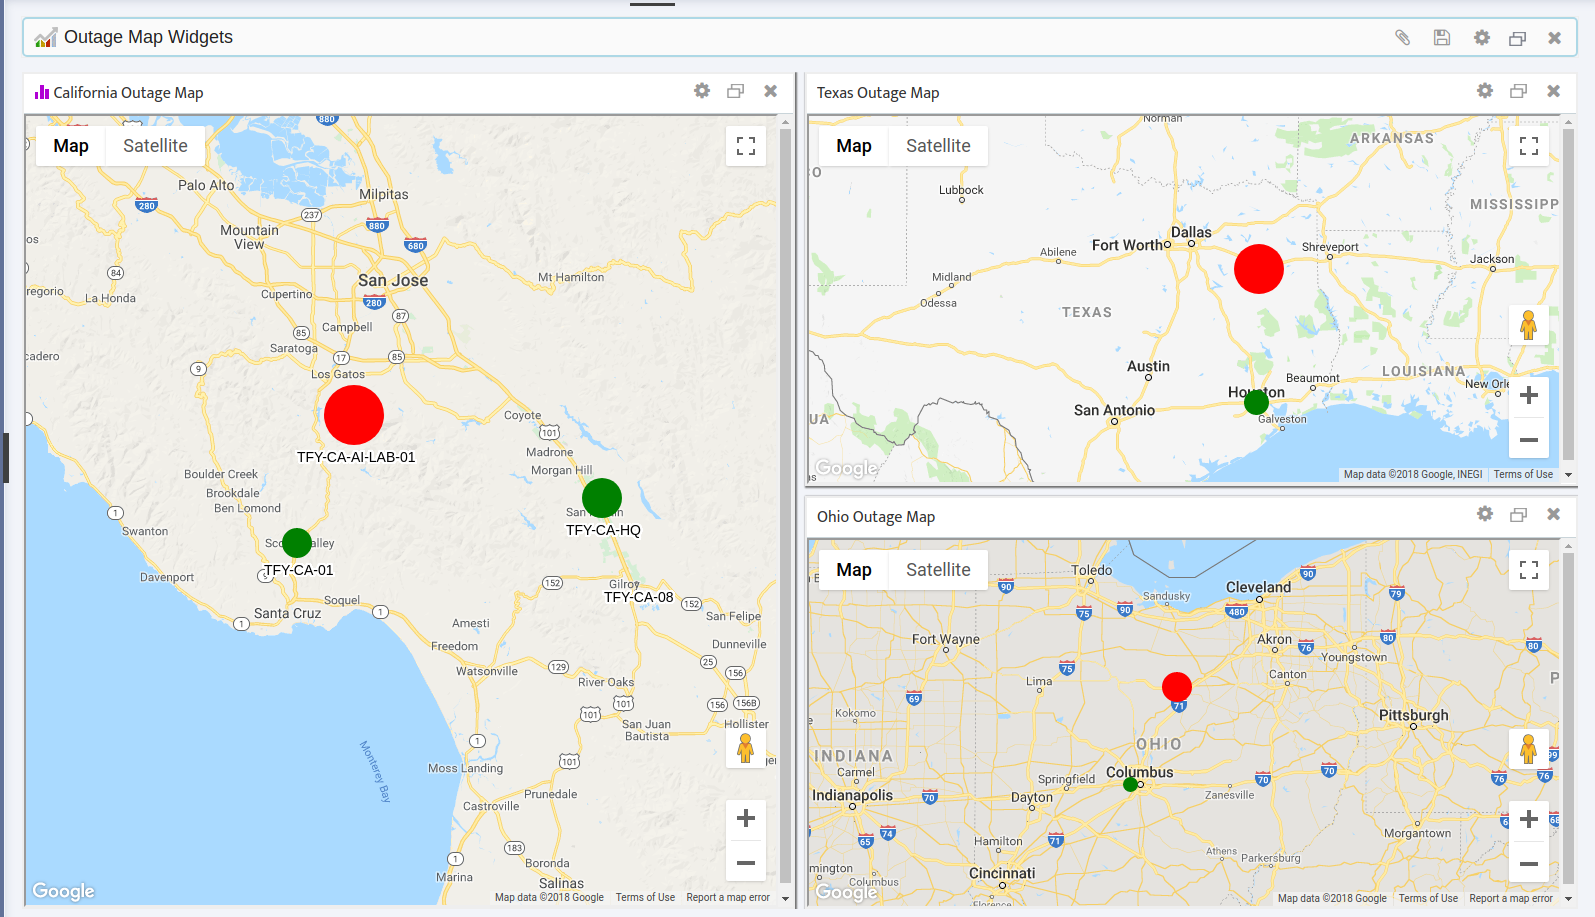
- Outage Map 1-10
5.10 Netflow Widgets
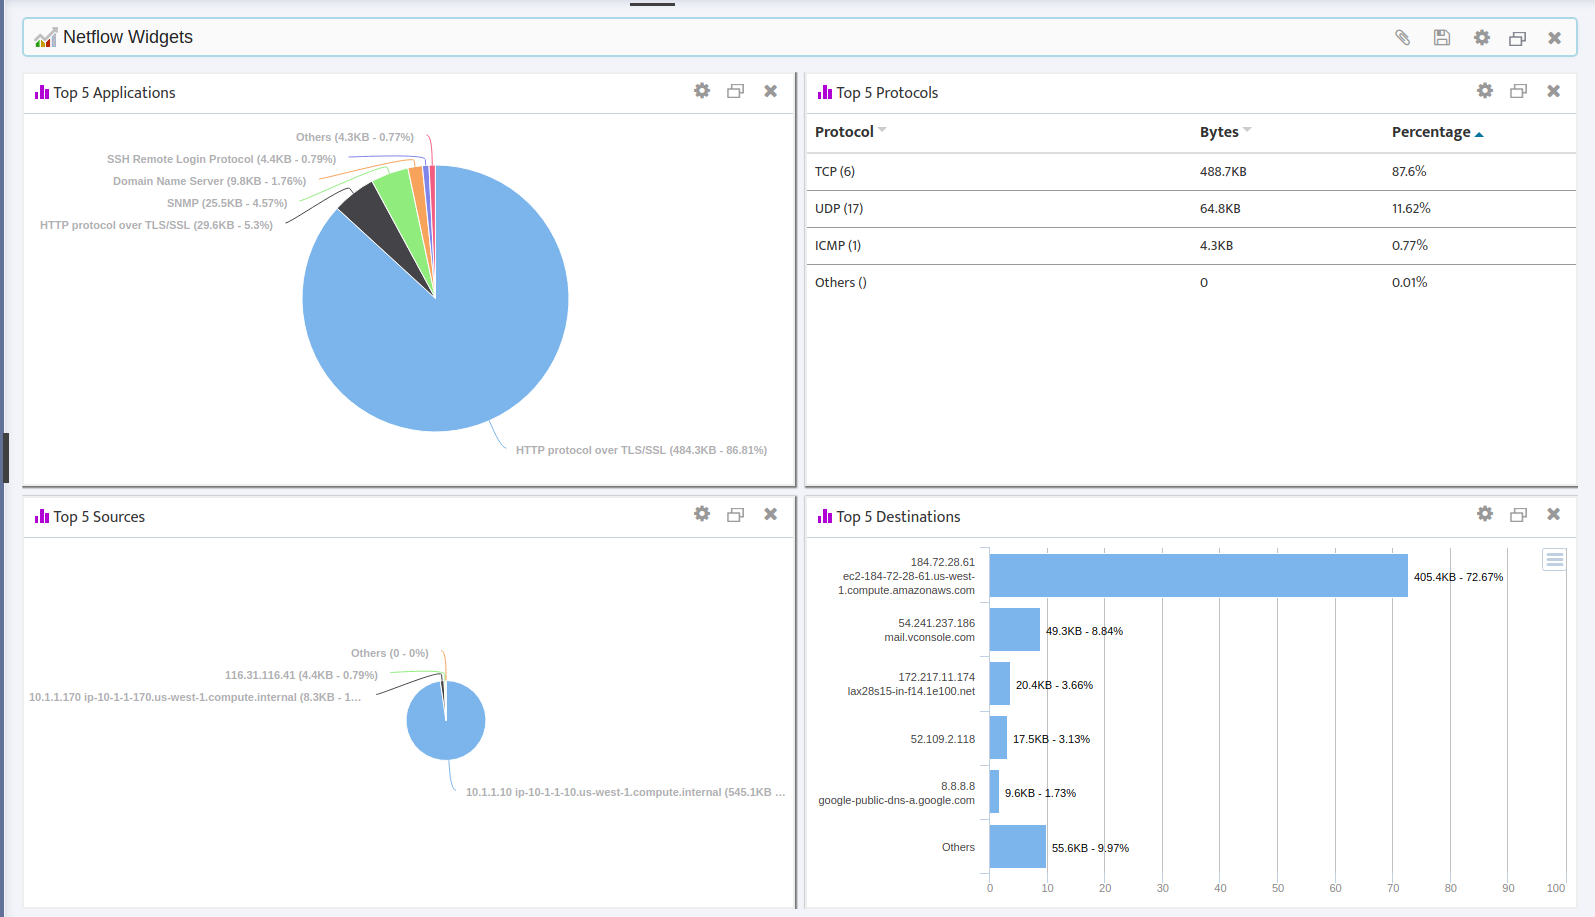
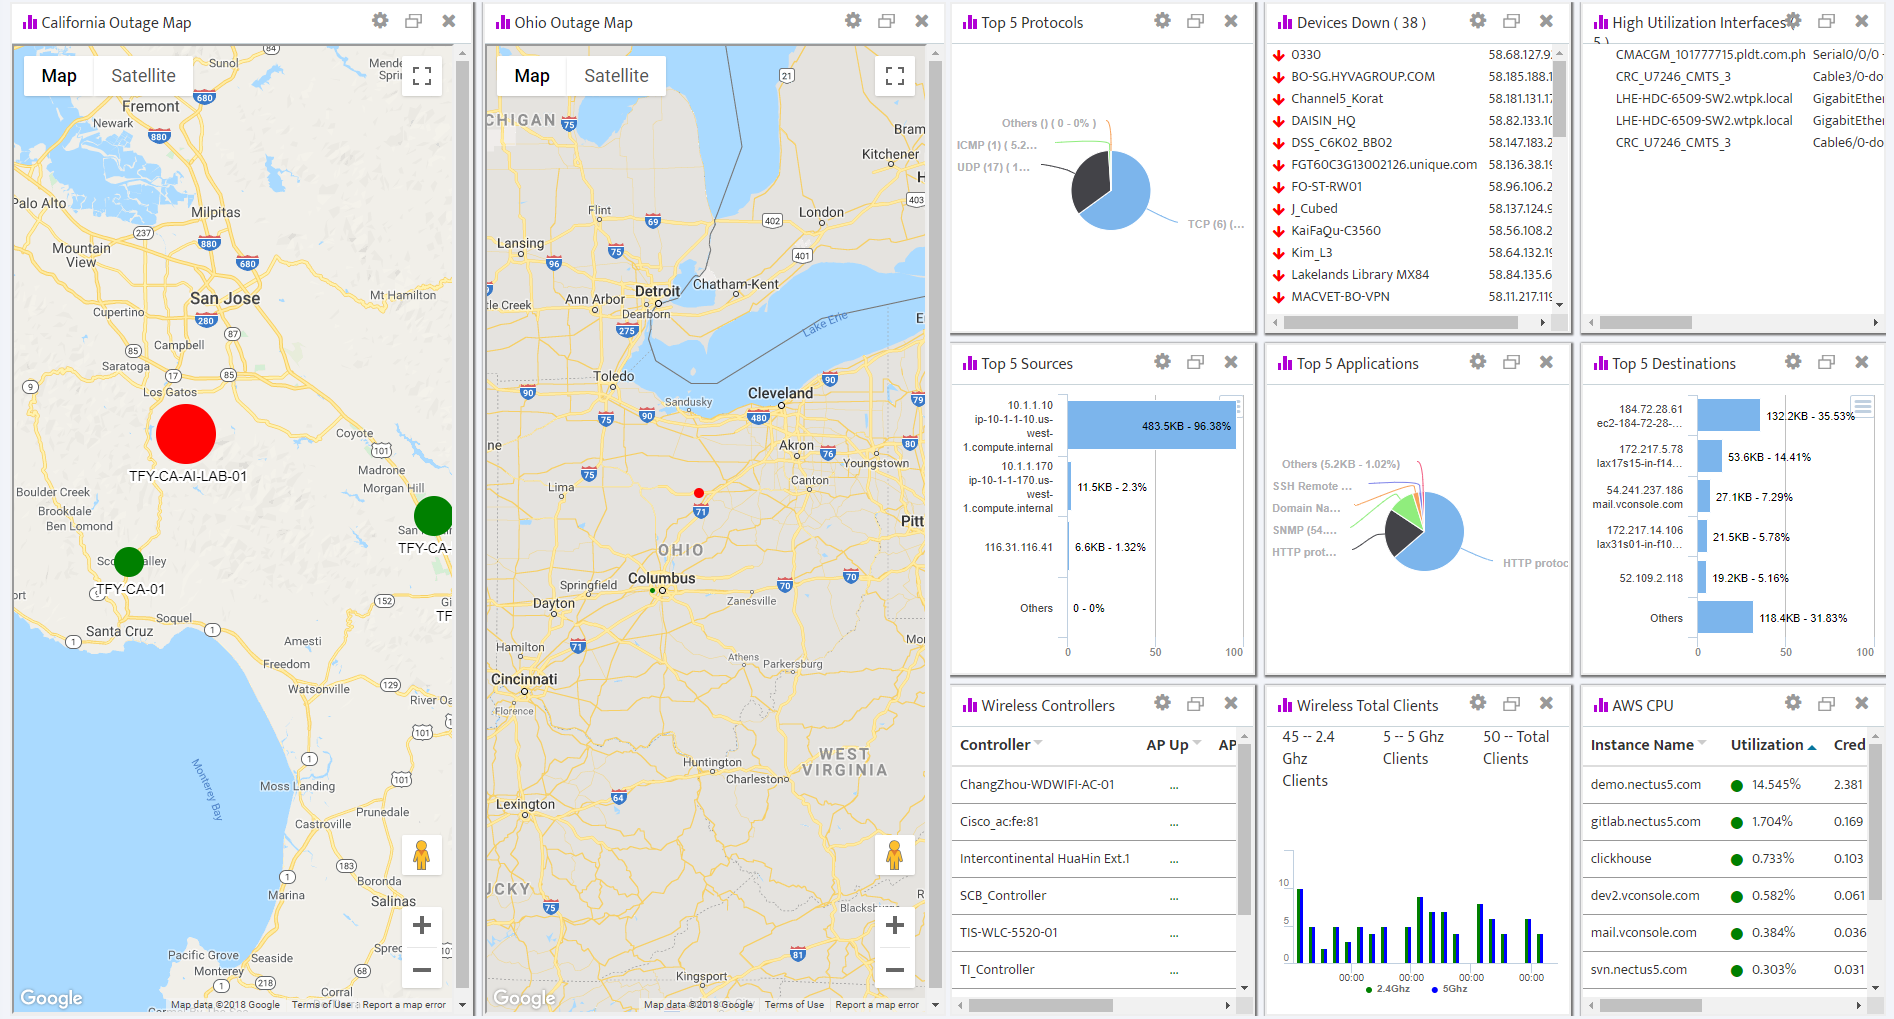
- Top 5 Applications
- Top 5 Protocols
- Top 5 Sources
- Top 5 Destinations
5.11 Call Manager
- Call Manager Health
5.12 AWS
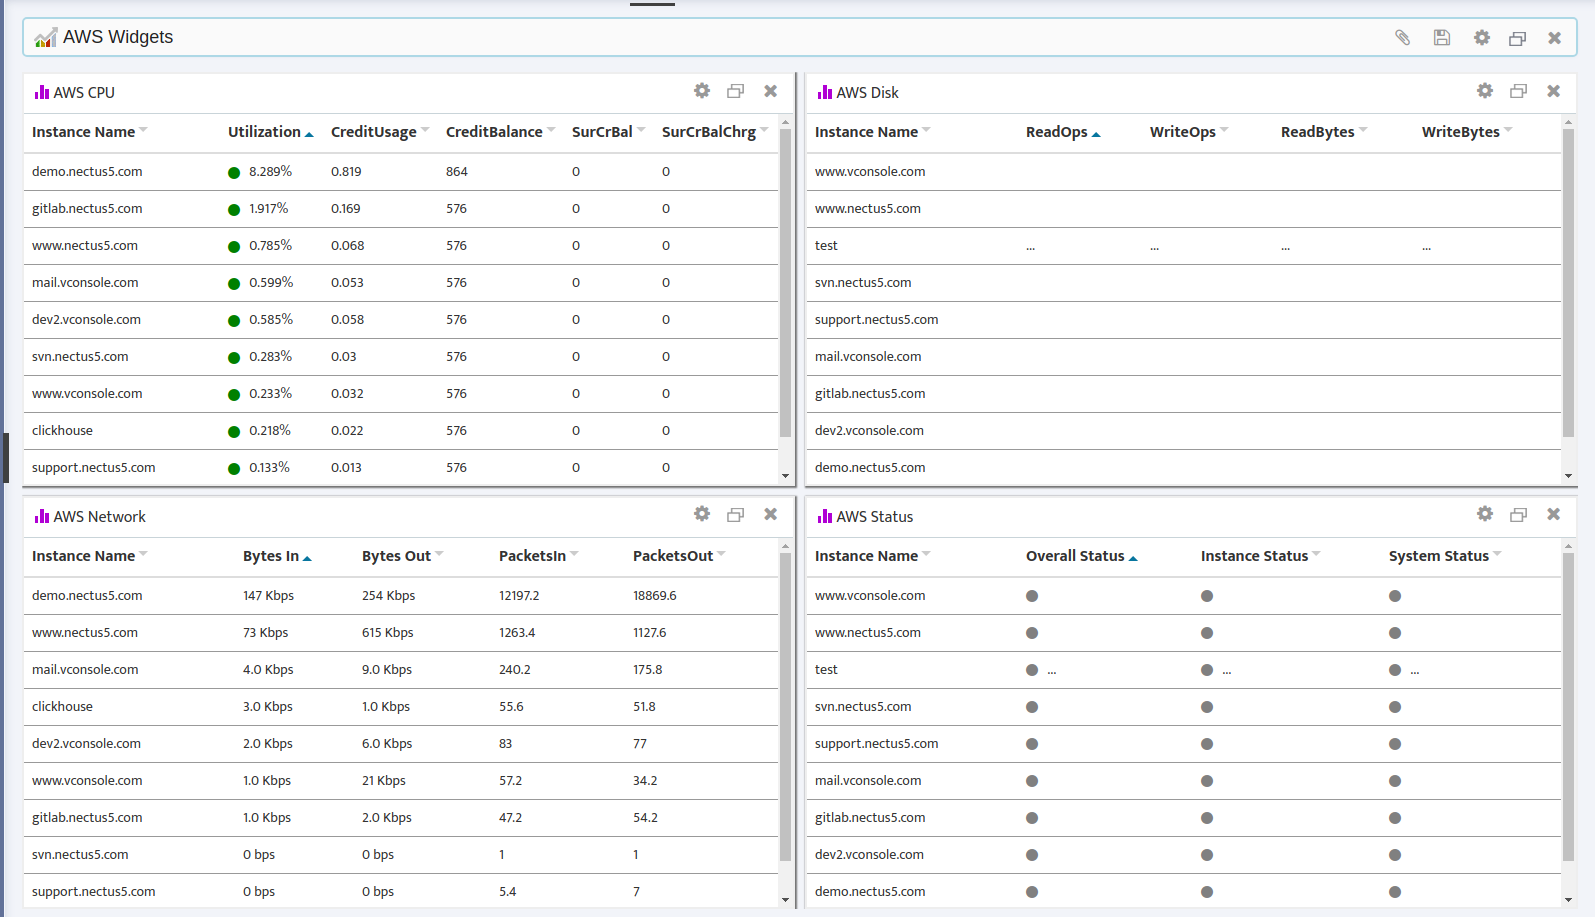
- AWS CPU
- AWS Disk
- AWS Network
- AWS Status
5.13 Others
- Maintenance Schedule
- Network Uptime