Creating Hierarchical Site Structure in Nectus
In this chapter you’ll learn how to create a Hierarchical Site Structure in Nectus and populate it with Devices. This activity is fundamental to using Nectus.
Specifically, you will learn how to:
- Create a New Site
- Delete a Site
- Move a Site
- Add a Device to a Site
- Delete a Device from a Site
- Move a Device to a Different Site
Creating a New Site
Like everything in Nectus, creating a Site is fast and simple. Follow these instructions to get it done:
- In the Sites Panel on the Nectus Home screen, click Sites. The “All Sites” list appears. Right-click All Sites.
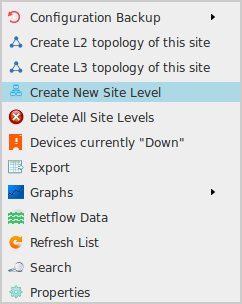
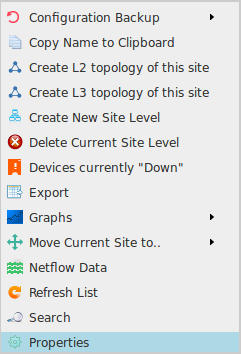
- In the menu that appears, click Create New Site Level.
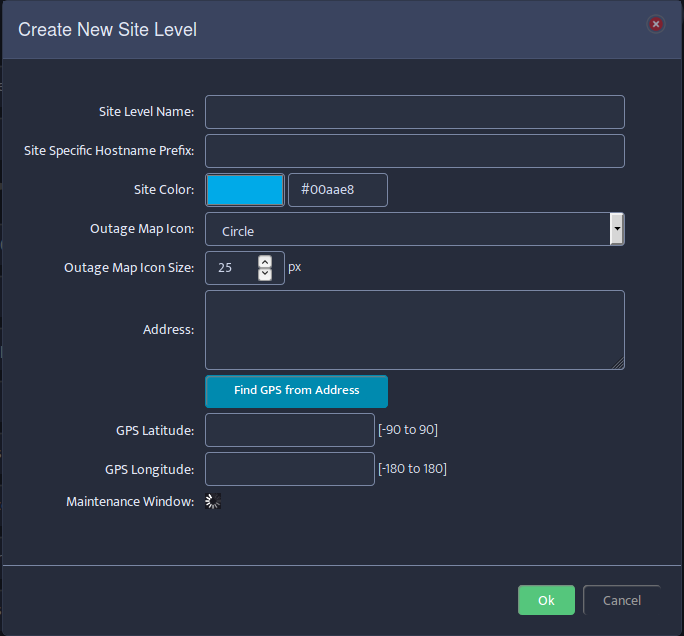
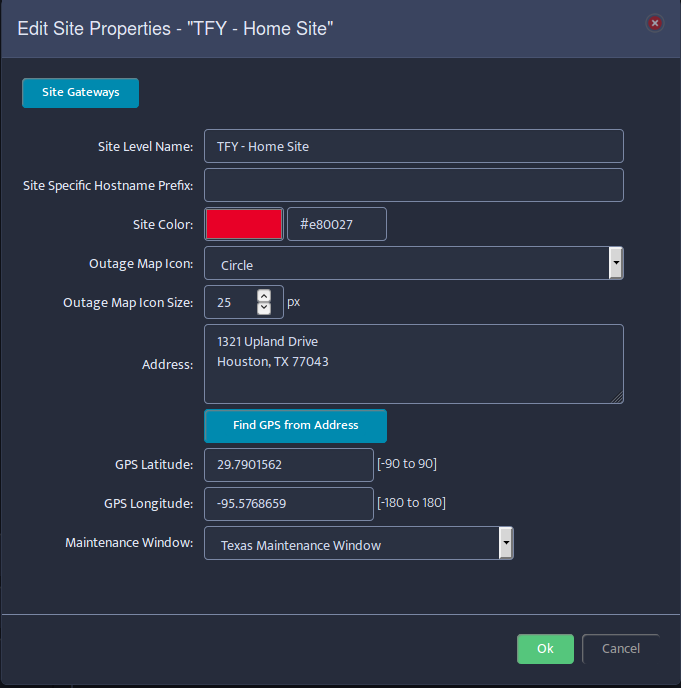
- In the Create New Site Level dialog box that appears, enter the Site Level Name and any other information relevant to the Site you are creating.
- Click Ok to add the Site to your Nectus Hierarchical Site Structure.
Deleting a Site
Deleting an existing Site is even easier than creating a new one. Follow these steps:
- Click Sites in the Sites Panel on the Nectus Home Screen. The “All Sites” list appears.
- Open the All Sites list by clicking the plus sign ( + ) to the left of the list.
- Navigate to the Site you want to delete and right-click it.
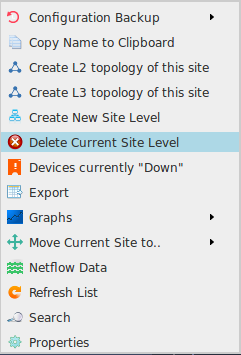
- In the menu that appears, select Delete Current Site Level. A confirmation dialog box appears.
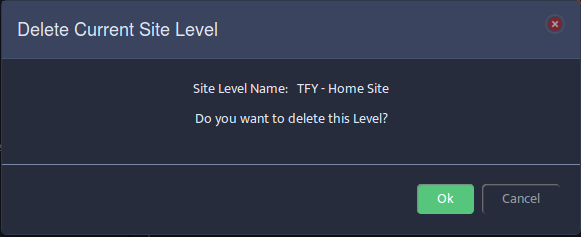
- Click Ok to delete the Site.
Moving a Site
You can move a Site to a new location in the existing hierarchy. This location can be at the same level in the hierarchy or at any other level. Any Site can be moved to any location within the hierarchy. Follow these instructions to move a Site:
- Click Sites in the Sites Panel on the Nectus Home Screen. Open the “All Sites” list and navigate to the Site you wish to move.
- Right-click the Site name.
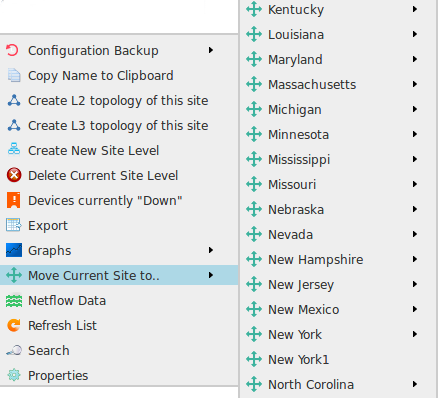
- In the drop-down menu that appears, hover the cursor over the Move Current Site to… option. A list of all the top-level Sites in your hierarchy appears.
- Hover the cursor over a location in this list to see a list of any Sites under this location.
- Click a location to place your original Site under that location. Clicking All Sites in the hierarchy moves your Site to the top level.
Adding a Device to a Site
Here, we are assuming that you have already added your available Devices to the Unassigned Devices list. Follow these steps to add a Device to a Site by taking it from the Unassigned Devices pool:
- In the Sites Panel of the Nectus Home screen, click Sites. The “All Sites” list appears.
- Open the Unassigned Devices list by clicking the plus sign ( + ) to the left of the list.
- Right-click the Device you want to add to a Site.
- In the menu that appears, hover the cursor over the Move Device to… option. A list of all the available top-level Sites appears.
- Navigate through the Site hierarchy by hovering the cursor over Sites to view their sub-sites. Click the Site you want to add the Device to.
- The Device moves from the Unassigned Devices pool into the Site you selected.
Deleting a Device from a Site
Follow these steps to delete a Device from a Site by moving it back to the Unassigned Devices pool:
- In the Sites Panel on the Nectus Home screen, click Sites. The “All Sites” list appears.
- Open the All Sites list by clicking the plus sign ( + ) to the left of the list.
- Navigate to the Site that contains the Device you want to delete.
- Open the Site by clicking the plus sign ( + ) to the left of the list. The Device appears below the Site.
- Right-click the Device name. A menu appears.
- Hover the cursor over the Move Device to… option. A list of your top-level Sites appears.
- Select Unassigned Devices in the list to delete the device from the Site and return it to the Unassigned Devices pool.
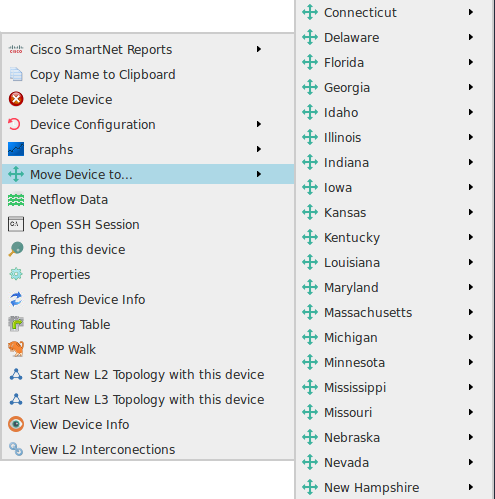
Moving a Device to a Different Site
Moving a Device between Sites is very similar to deleting a device. Here are the steps:
- In the Sites Panel on the Nectus Home screen, click Sites. The “All Sites” list appears.
- Open the All Sites list by clicking the plus sign ( + ) to the left of the list.
- Navigate to the Site that contains the Device you want to delete.
- Open the Site by clicking the plus sign ( + ) to the left of the list. The Device appears below the Site.
- Right-click the Device name. A menu appears.
- Hover the cursor over the Move Device to… option. A list of your top-level Sites appears.
- Navigate through the hierarchy of Sites and click the Site you want to move the Device to.