Network Engineer Toolset in Nectus NMS
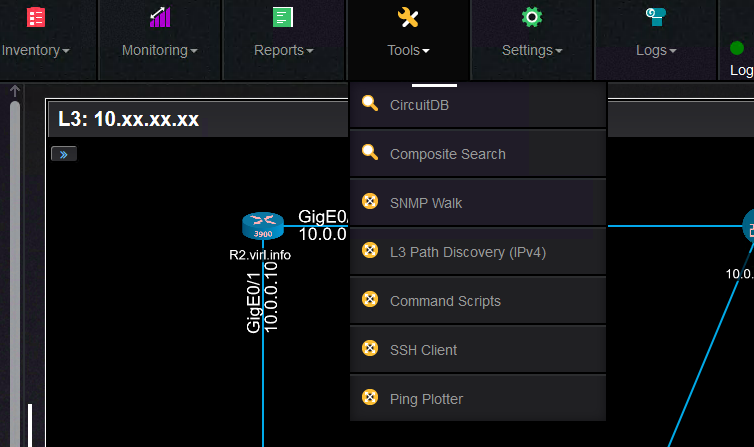
Under the Tools menu, there are quite a few tools that can help the operator to understand better the network, to perform troubleshooting and to gather information from devices.
These are the options:
First let’s see the Layer2 and Layer3 topologies dynamically built by Nectus.
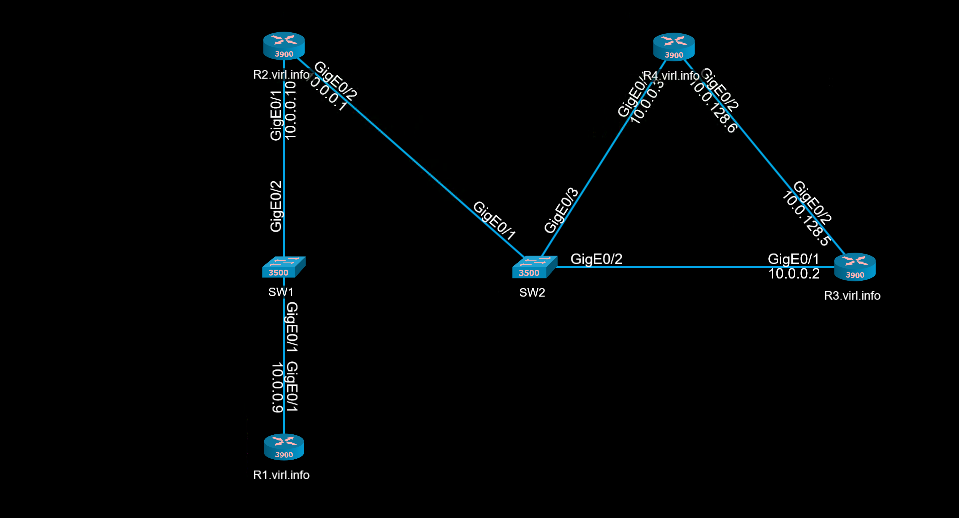
This is the example of Layer2 topology:
And the Layer3 topology would look like this:
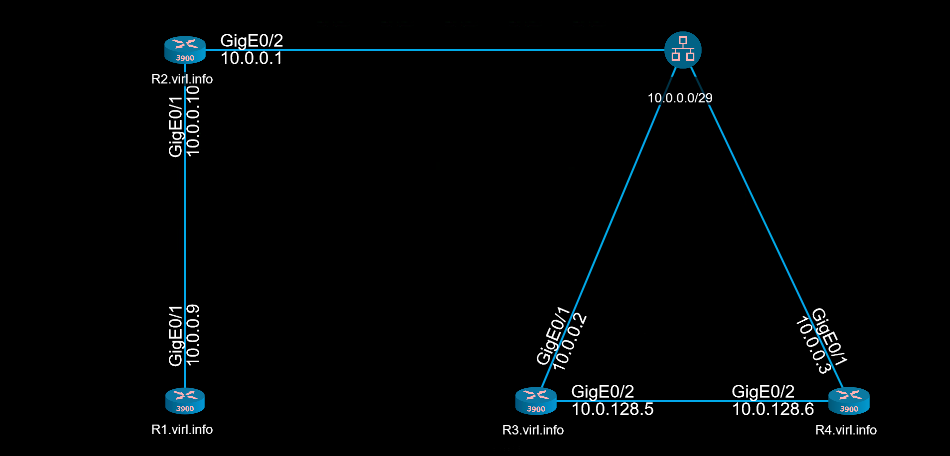
OSPF in area 0 and full-mess IBGP is configured on all routers.
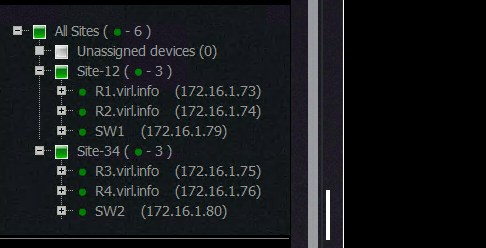
The devices were split in two different sites to simulate two different geographically points of presence:
So let’s go through all the options from Tools menu.
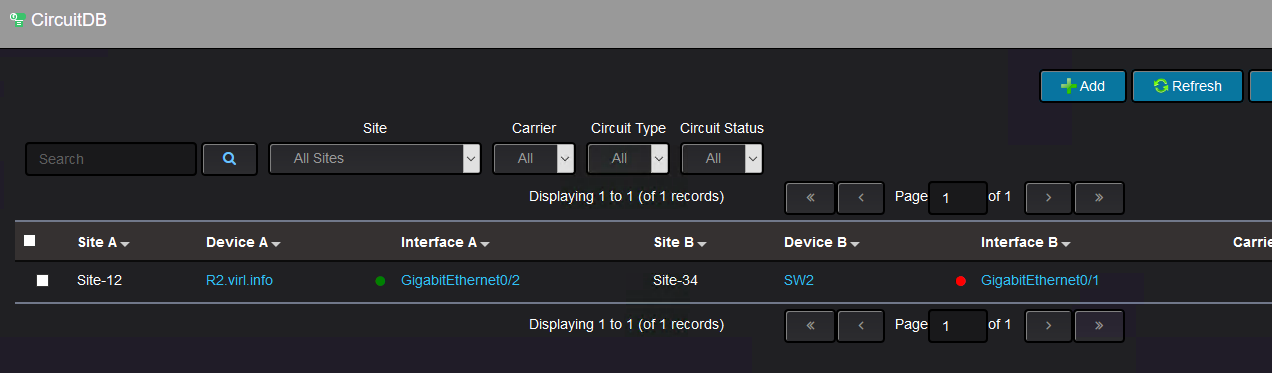
The first one is CircuitDB. This allows you to manually configure circuits and provide information about it like the locations of the circuits ends, rack/room location, type of physical medium, status, who is the provider and technical support contact info:
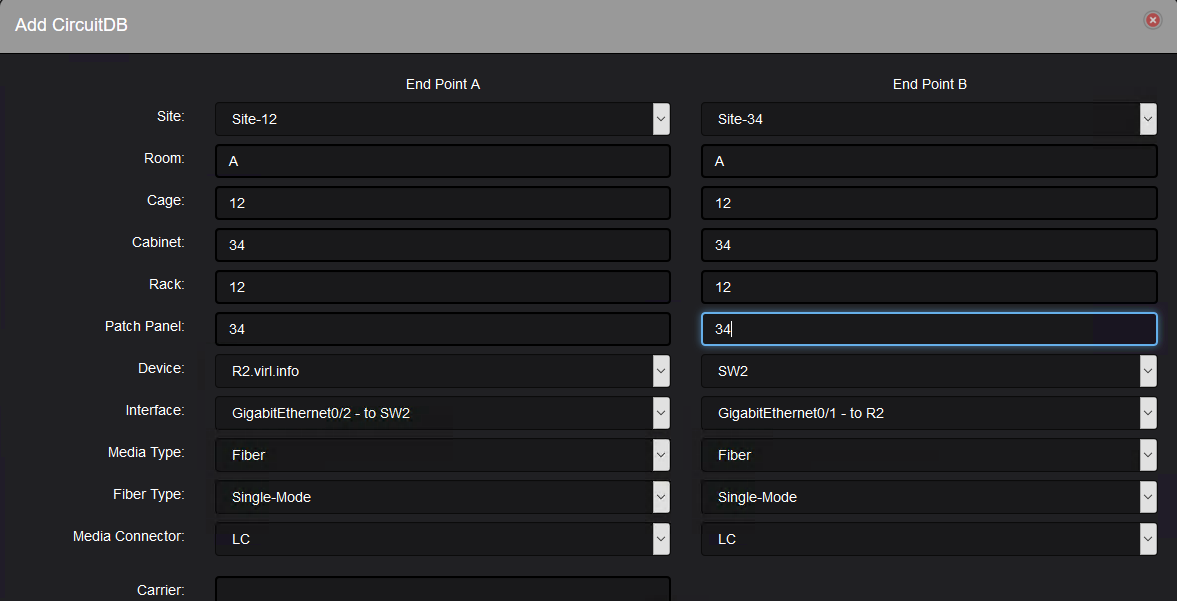
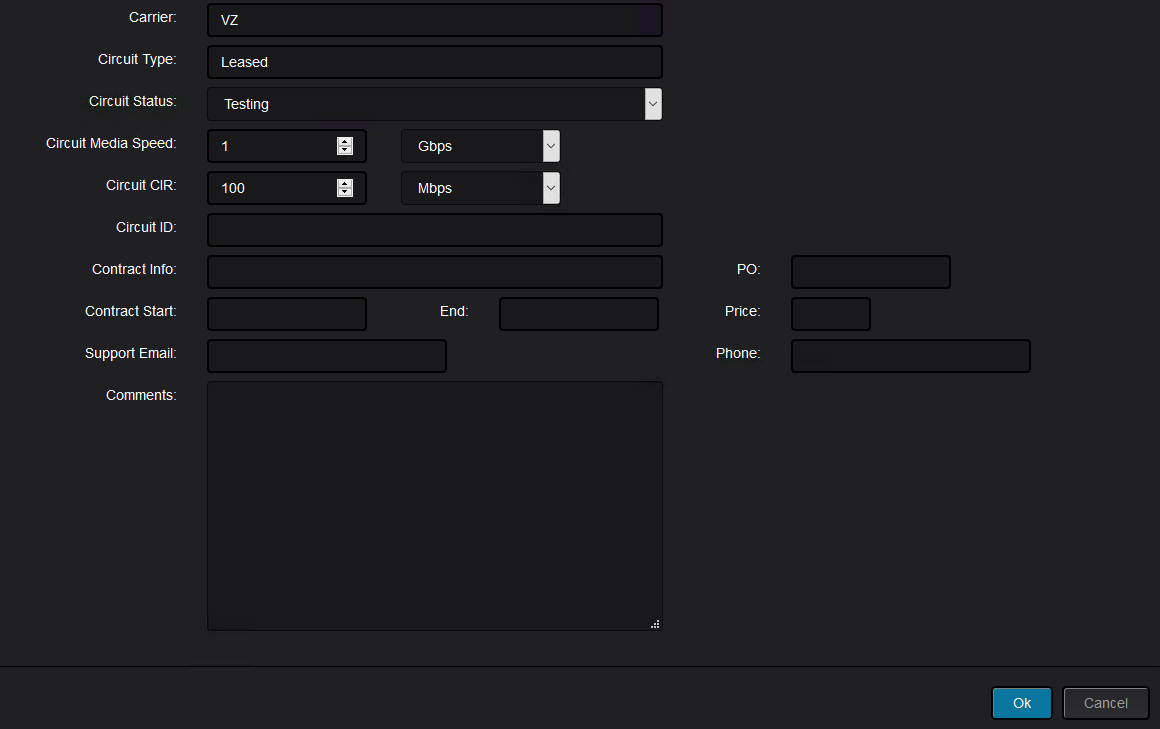
In this case, it is about the link between R2 and SW2. And some other details before the circuit is added:
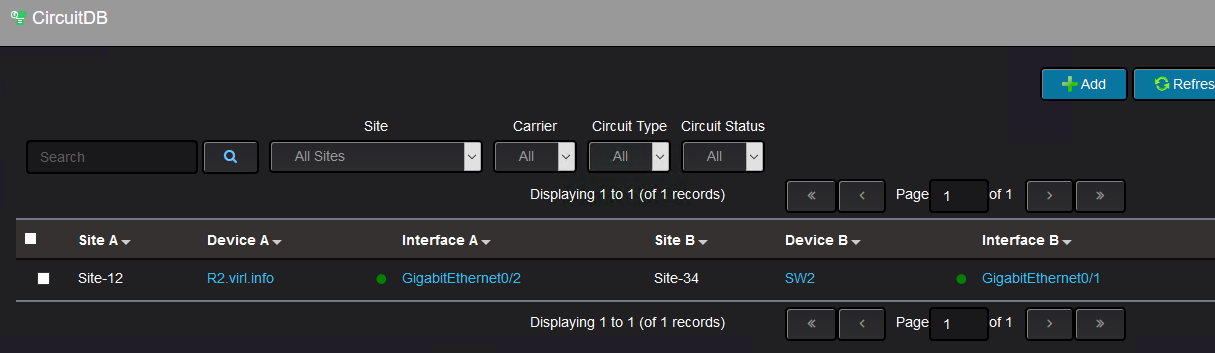
This circuit shows up in the database:
After link failure simulation (the interface was shut down on the switch side), the circuit shows like this:
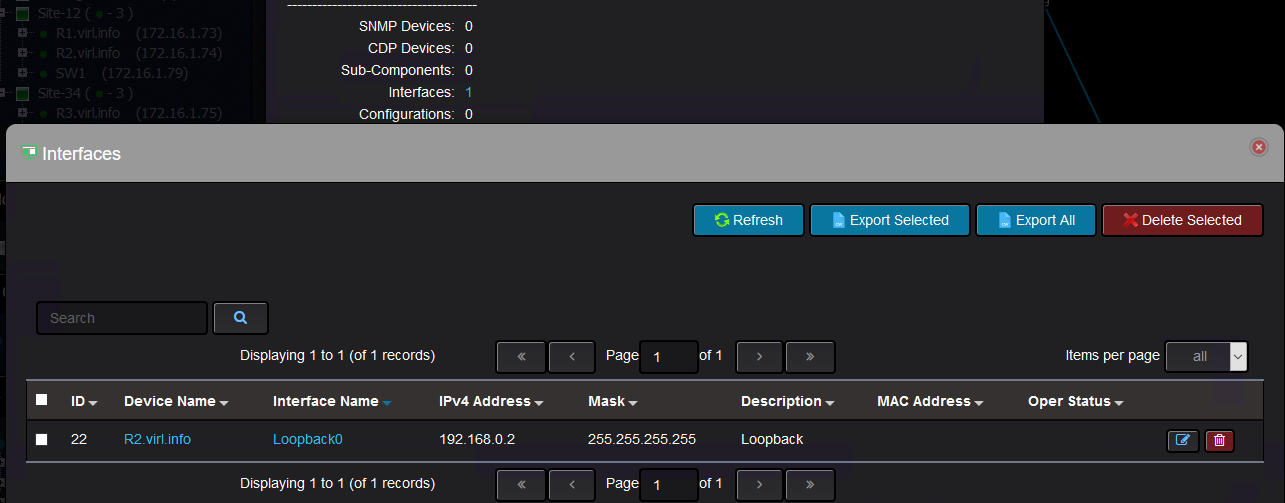
The next one is the ability to search through all the information that Nectus collected from the devices. In this case, you might want to know where an IP address is configured:
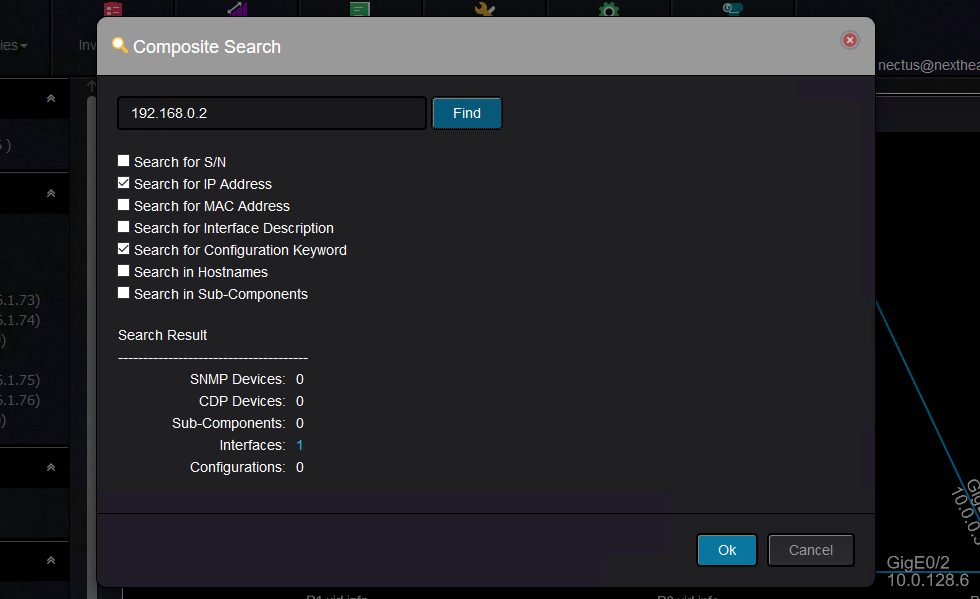
And the result is this:
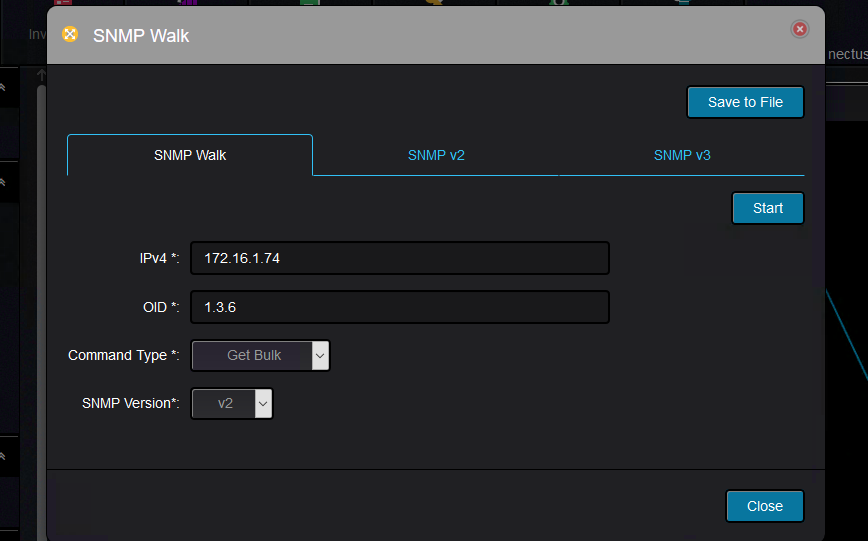
Going further, you can use Nectus to perform SNMP walk. First you need to decide if the device is using version 2 or version 3 and provide the appropriate information based on the version used. This is for version 2:
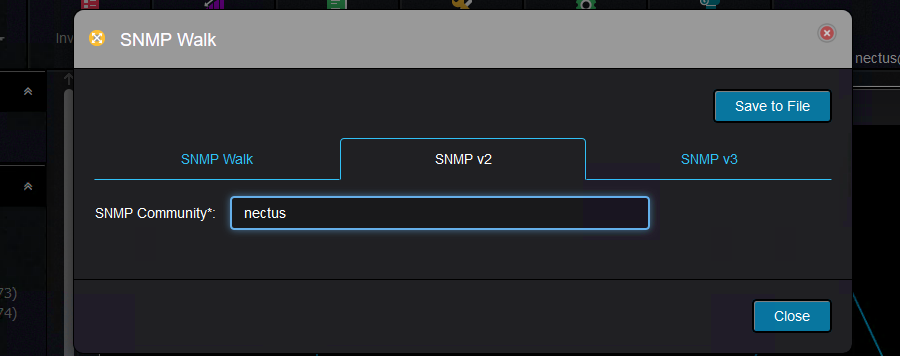
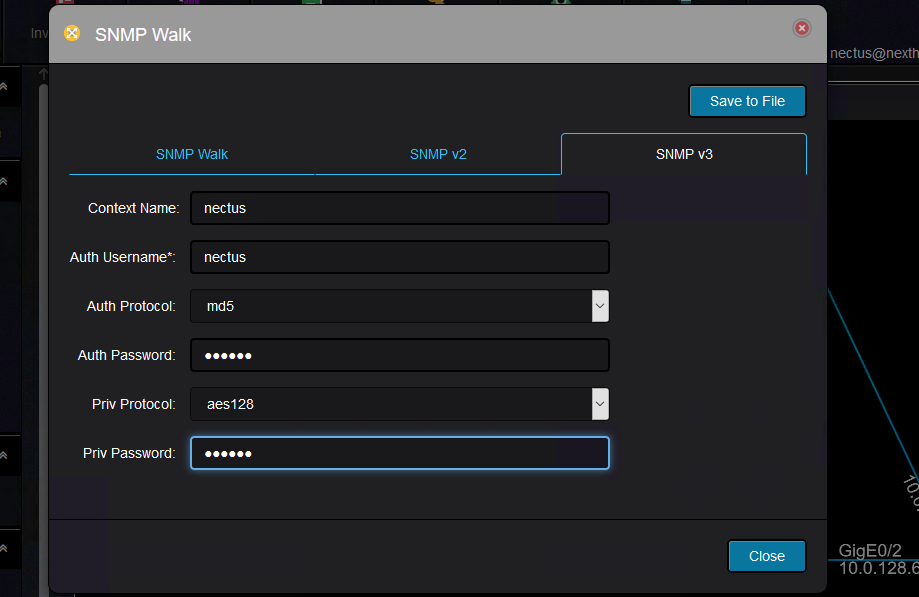
And this is for version 3:
Once the information is provided, you can move to interrogate the device specifying an IP address, SNMP community and OID:
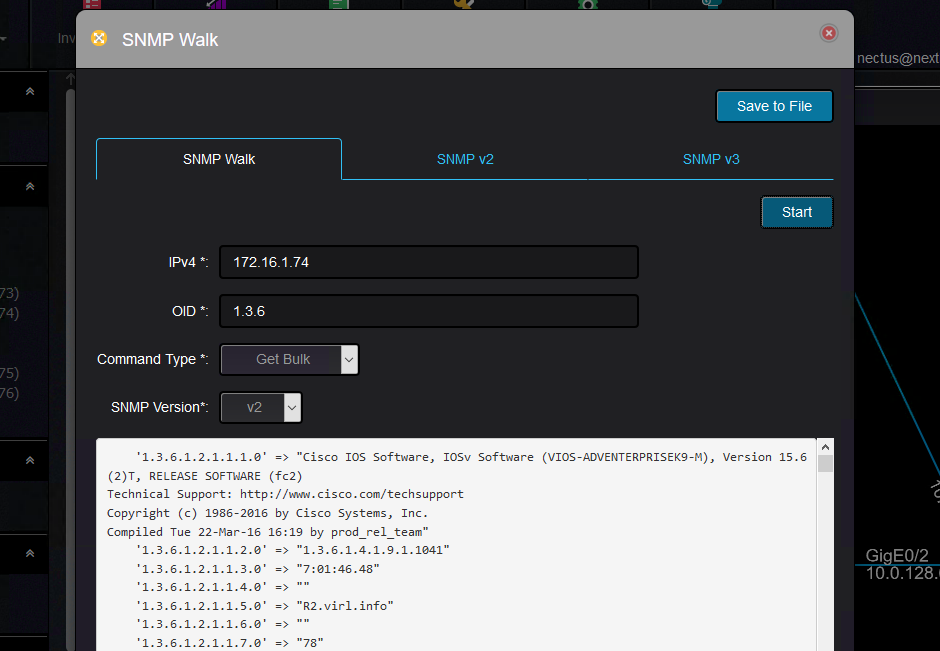
The result is returned like this:
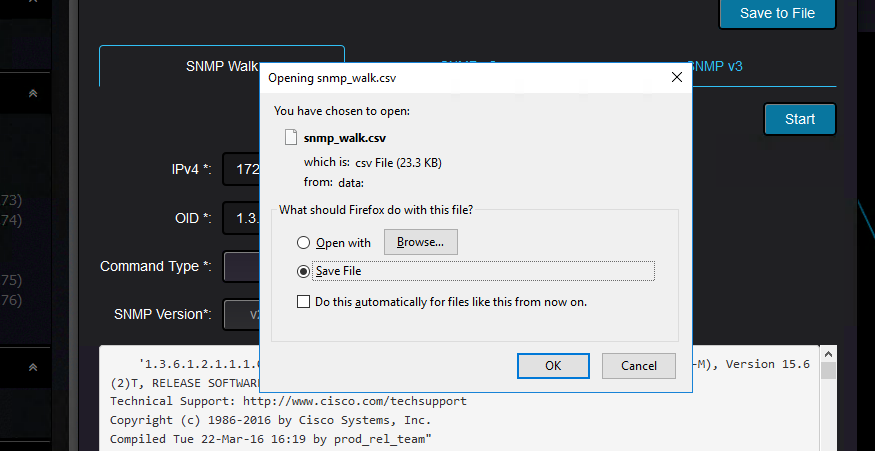
You can save the output for further processing:
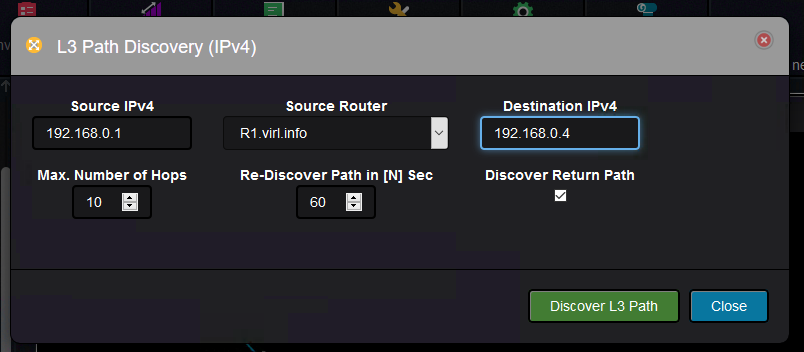
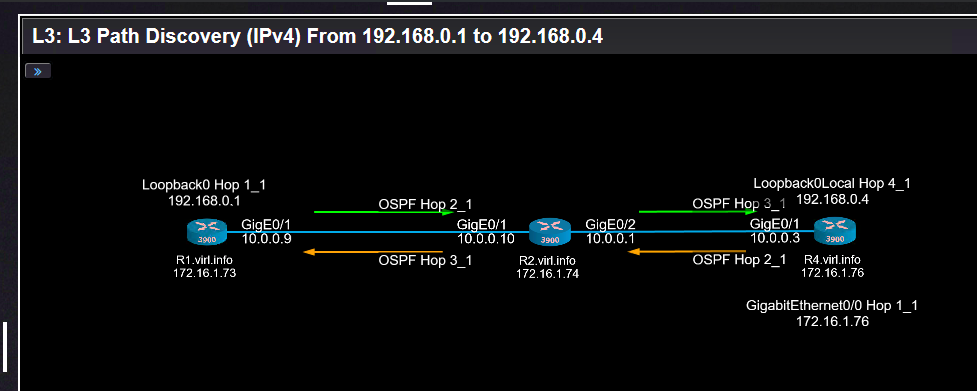
The next tool is the one that can show you how the packets between two endpoints go through the network, something like a visual traceroute executed from a device, but without actually connecting to the device. This is an example of path discovery between R1 and R4’s loopbacks IP addresses:
And the result is the following one:
Nectus can run scripts containing commands against all or specific set of devices.
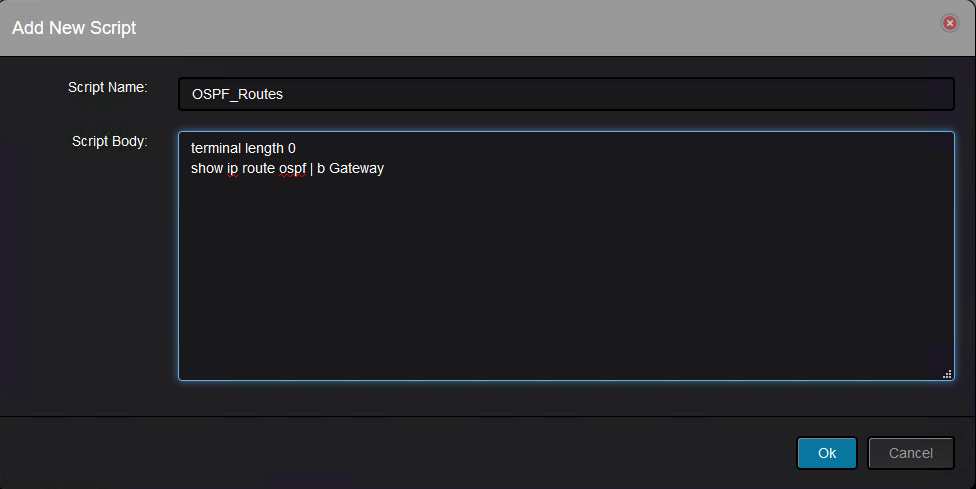
There are few options available with these command scripts and first they are added from this tab:
For testing purposes, we want a script that collects the OSPF routes and it is very simple to do with following script:
Once the script is added it can be run manually and you will be asked on what devices to run the script:
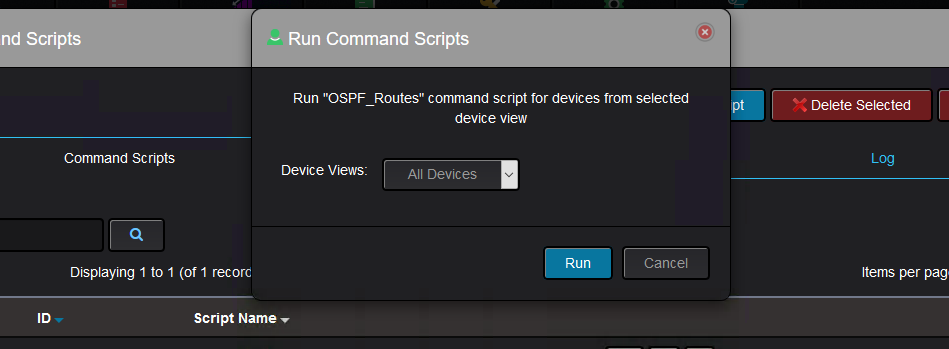
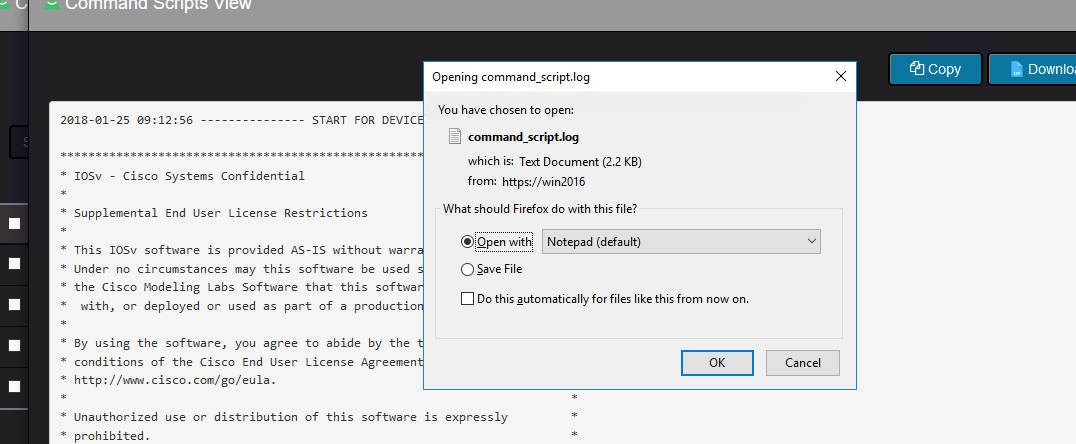
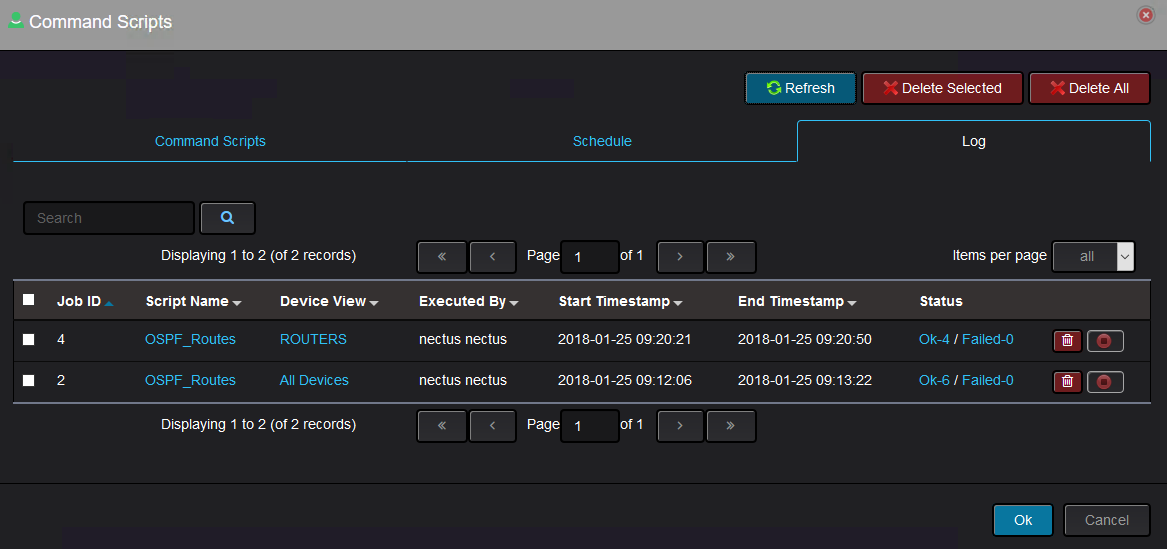
By default, there is only one view and that is to have all the devices. Once you run the script, a log will be generated that can be seen in the Log tab:
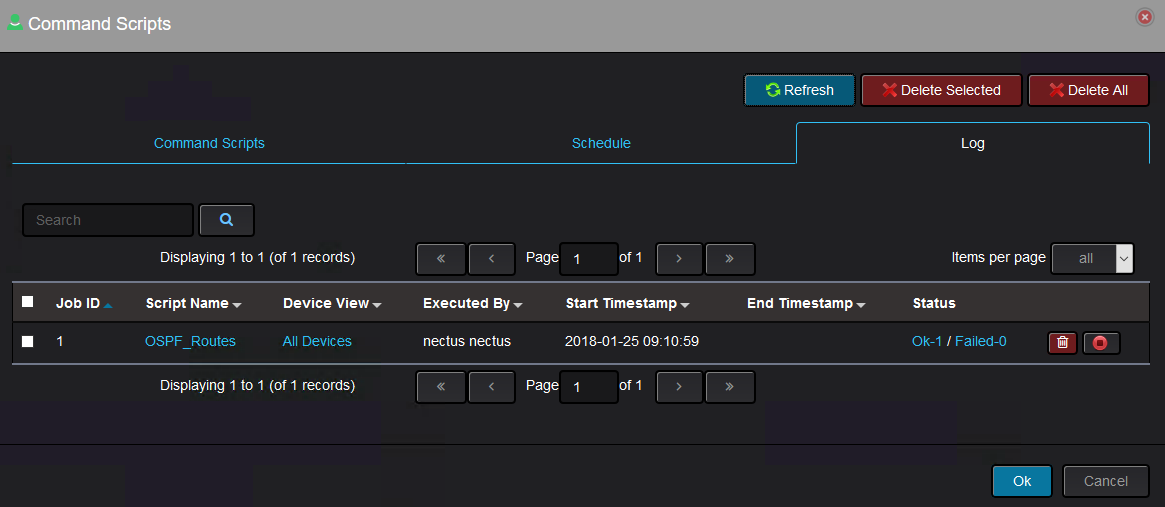
See how the script successfully ran on one device and you can see on what device the script ran by clicking on the OK status:
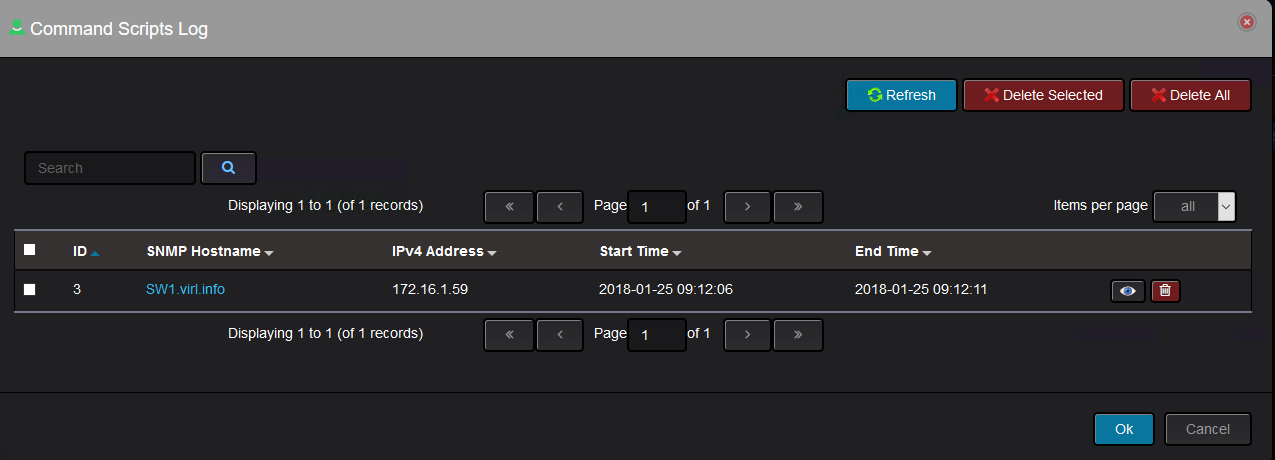
Unfortunately, SW1 is not running OSPF, therefore the content will be empty.
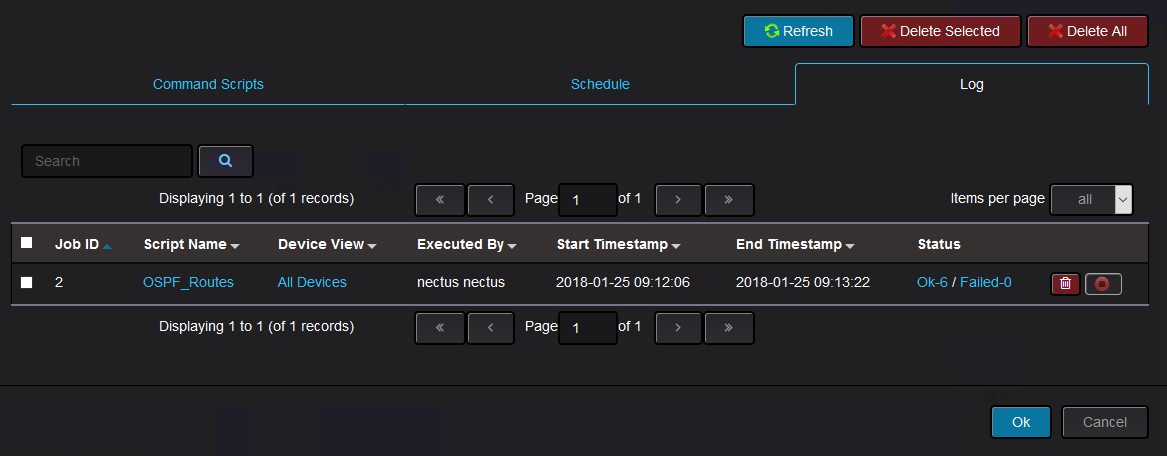
Eventually, the script finishes successfully running on all devices:
Let’s check OSPF routes from R2 using the CLI command:
R2#show ip route ospf | b Gateway
Gateway of last resort is not set
10.0.0.0/8 is variably subnetted, 7 subnets, 3 masks
O 10.0.0.12/30 [110/2] via 10.0.0.9, 00:36:55, GigabitEthernet0/1
O 10.0.128.0/30 [110/2] via 10.0.0.3, 00:23:33, GigabitEthernet0/2
O 10.0.128.4/30 [110/2] via 10.0.0.3, 00:23:33, GigabitEthernet0/2
[110/2] via 10.0.0.2, 00:23:33, GigabitEthernet0/2
192.168.0.0/32 is subnetted, 4 subnets
O 192.168.0.1 [110/2] via 10.0.0.9, 00:36:55, GigabitEthernet0/1
O 192.168.0.3 [110/2] via 10.0.0.2, 00:23:33, GigabitEthernet0/2
O 192.168.0.4 [110/2] via 10.0.0.3, 00:23:33, GigabitEthernet0/2
R2#
And this is the output collected by Nectus5:
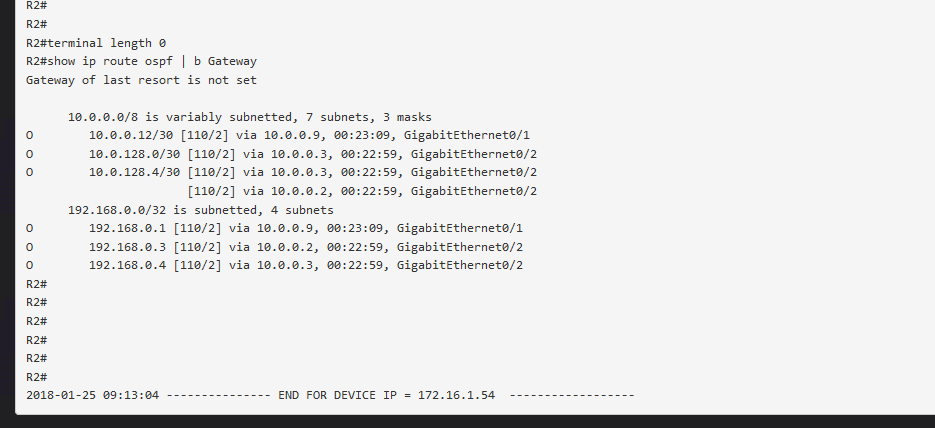
The output can be saved for later analysis:
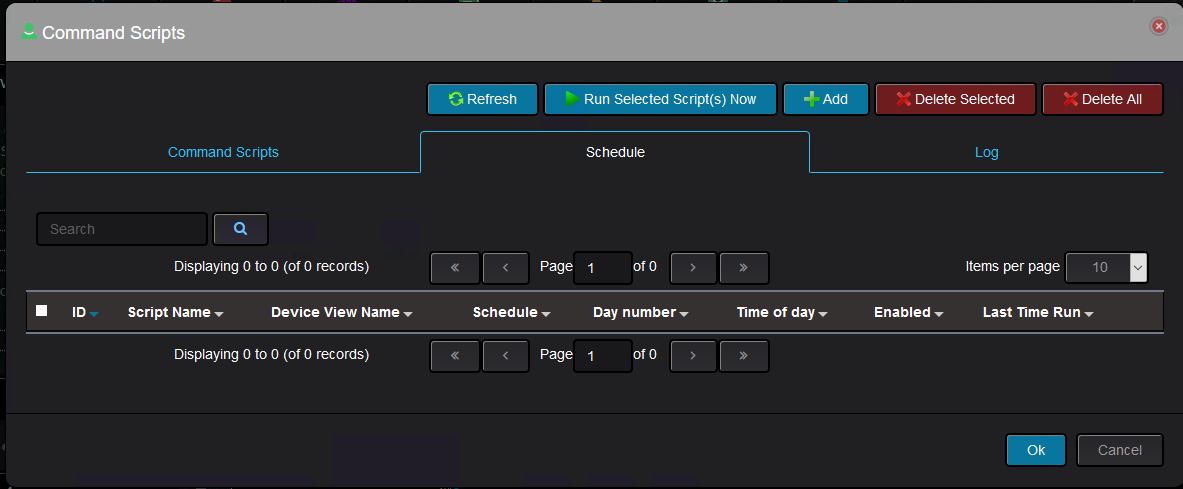
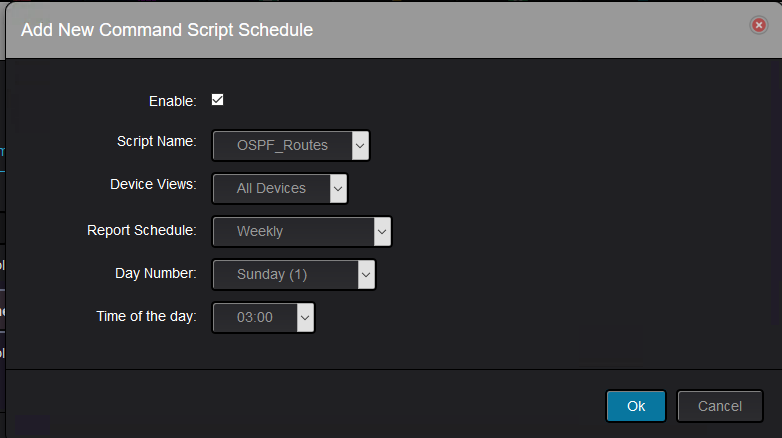
There is the possibility to schedule the scripts to run at specific date/time.
You just need to specify what script to run, on which devices and when:
Regarding the Device Views option, it is just how you want to consolidate devices in different sets so you can take actions on them.
By default, there is only one device view and that is to include all devices.
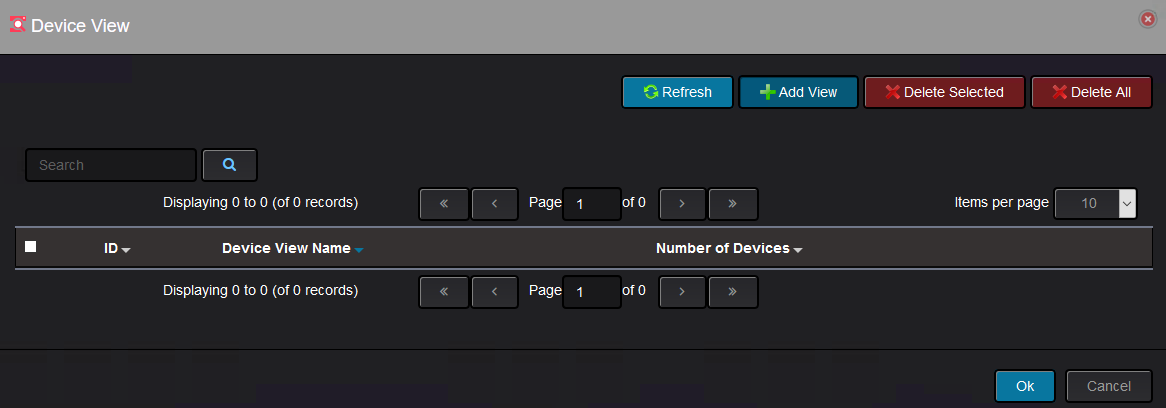
The device views can be managed in top menu “Inventory”:
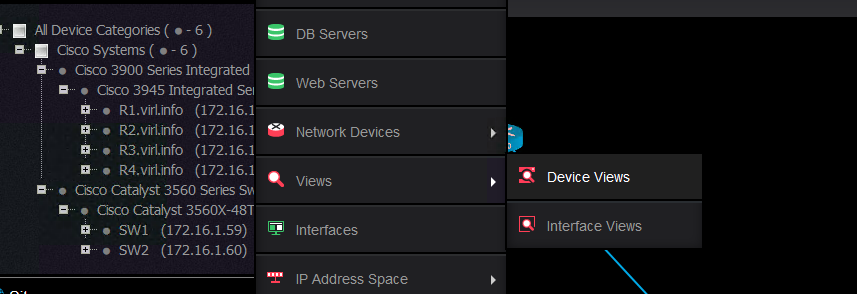
The default device view is not shown in the list:
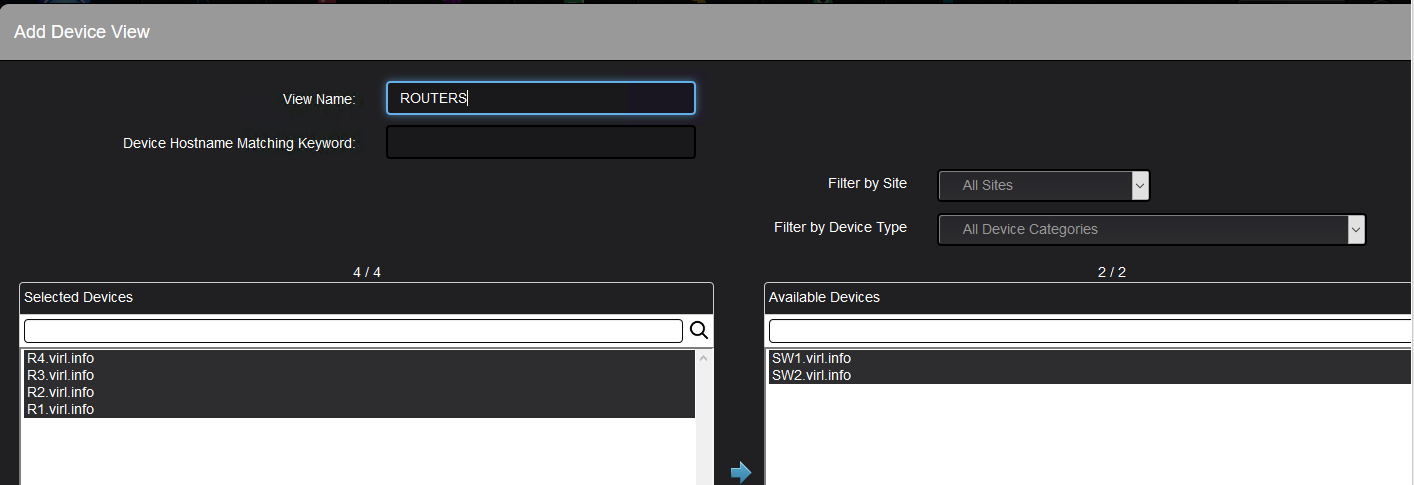
You can add your own and name it appropriately. In this case, I would like a device view that contains only the routers:
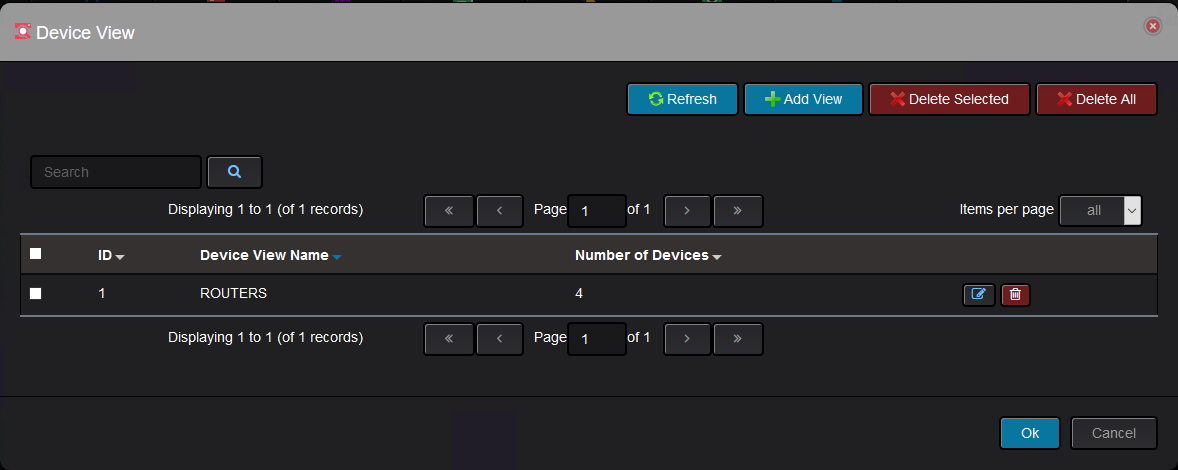
And now this custom device view is showing:
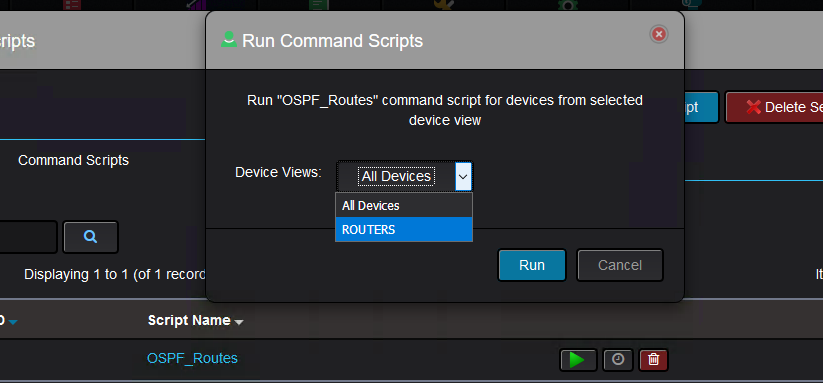
Coming back to the command scripts, you can select now on which device view to execute the scripts:
The log section of the feature will show against which device view the script was run:
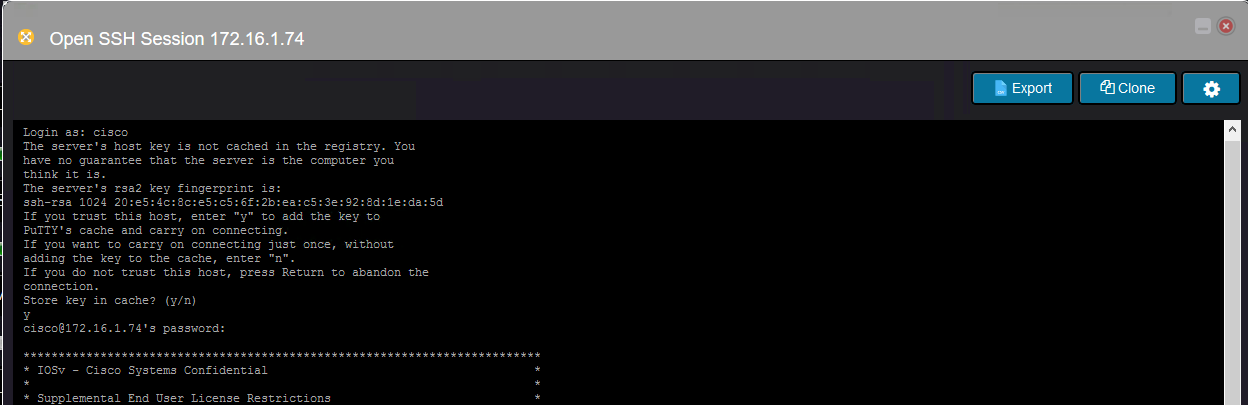
Nectus allows to connect to the devices using ssh directly from a web interface:
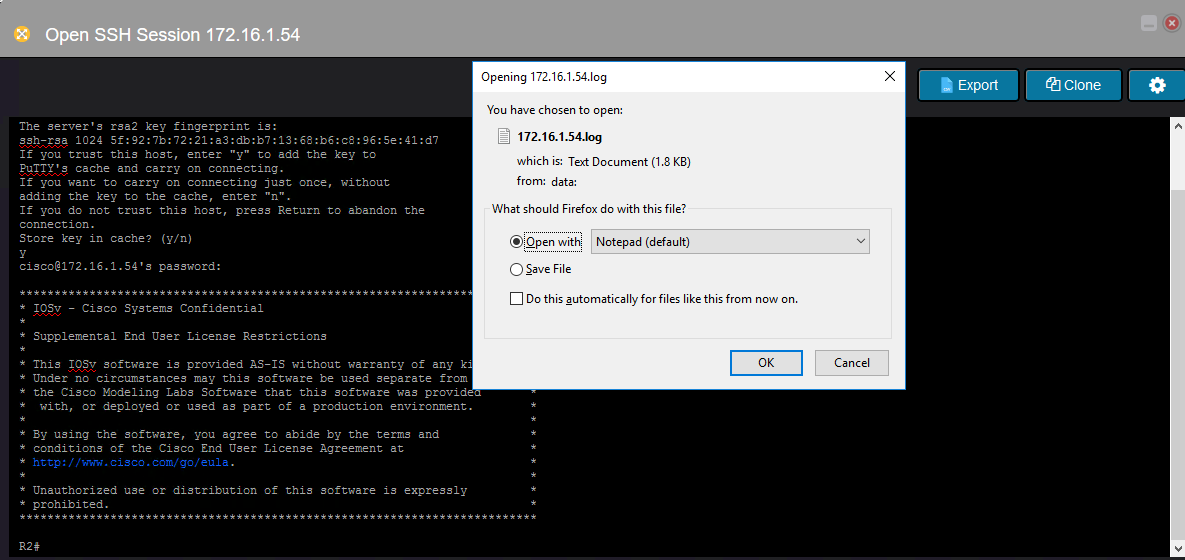
You can save the session log output to a file:
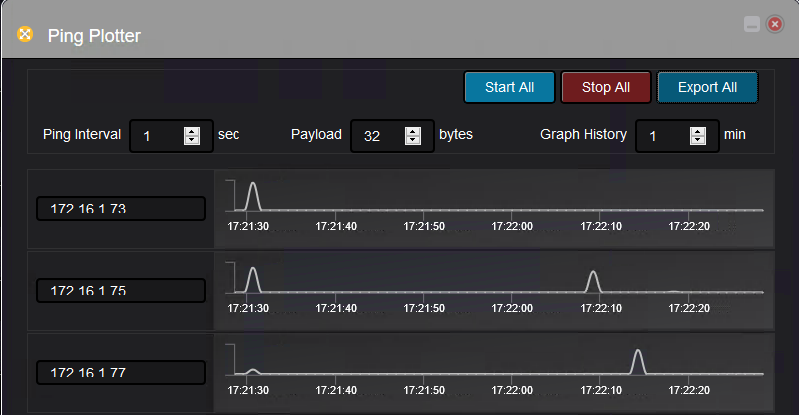
Nectus can use ping plotter to check device reachability. You just need to specify few parameters:
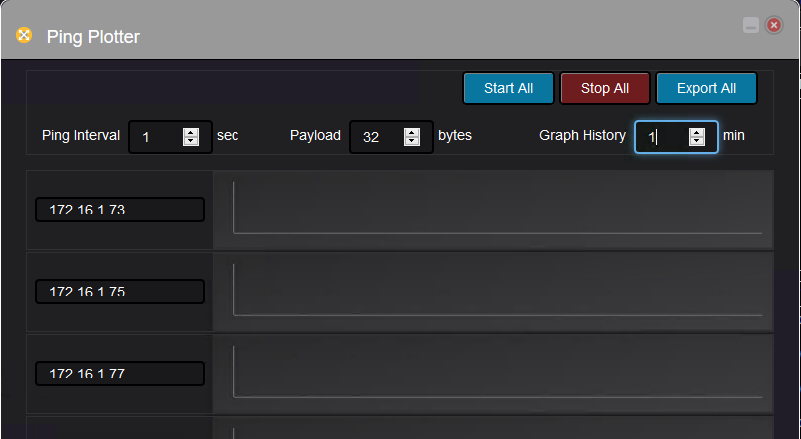
And the result is this: