Cisco Wireless Heat Maps
In this post, we will cover the wireless heat maps and how they are created in Nectus.
A heat map will allow to visualize the state of the wireless coverage and help to take decision in order to improve the coverage.
Using the information from APs along with a map of physical location, you can find out where are the hot and cold spots.
A heat map is a L2 topology diagram where you can add access points and optionally the controller to which the access points are associated with.
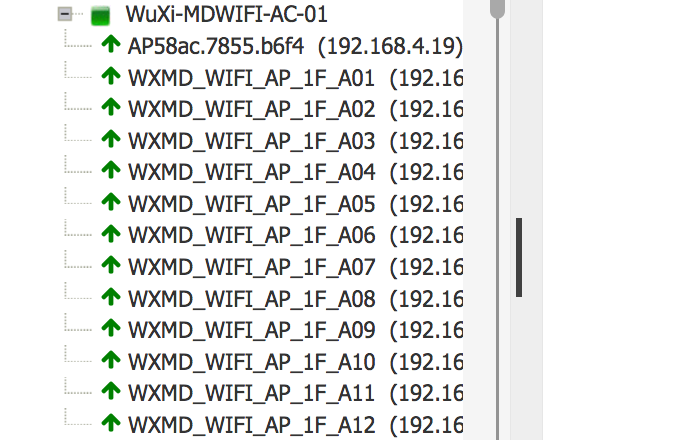
You can add the controller and the APs from the list of controllers:
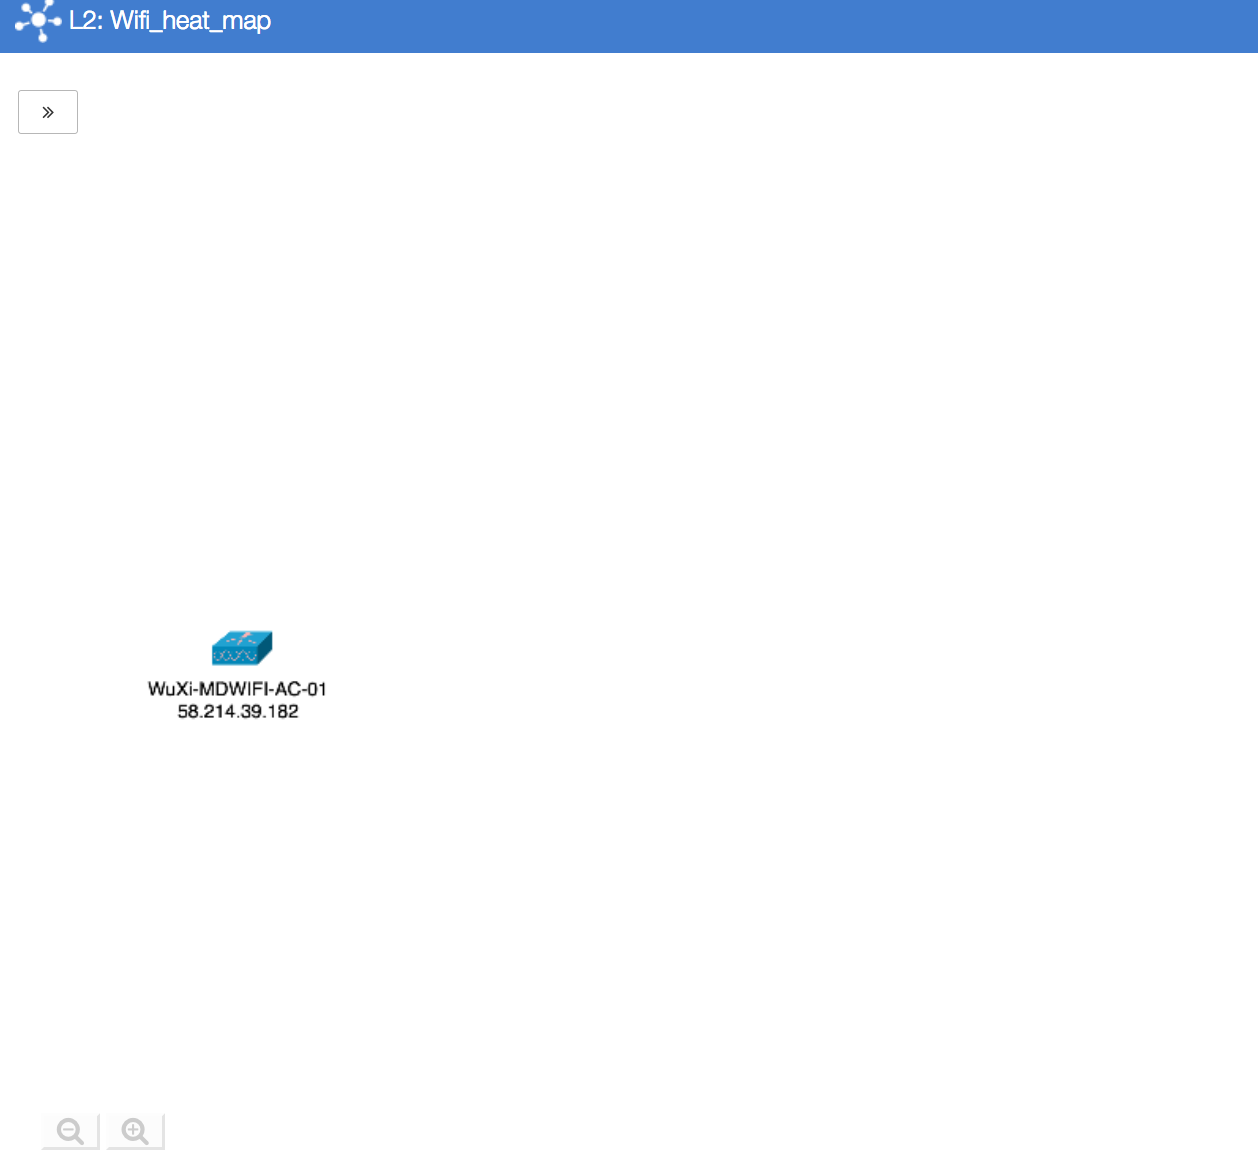
If the controller and several APs are added to the topology, it will look like this:
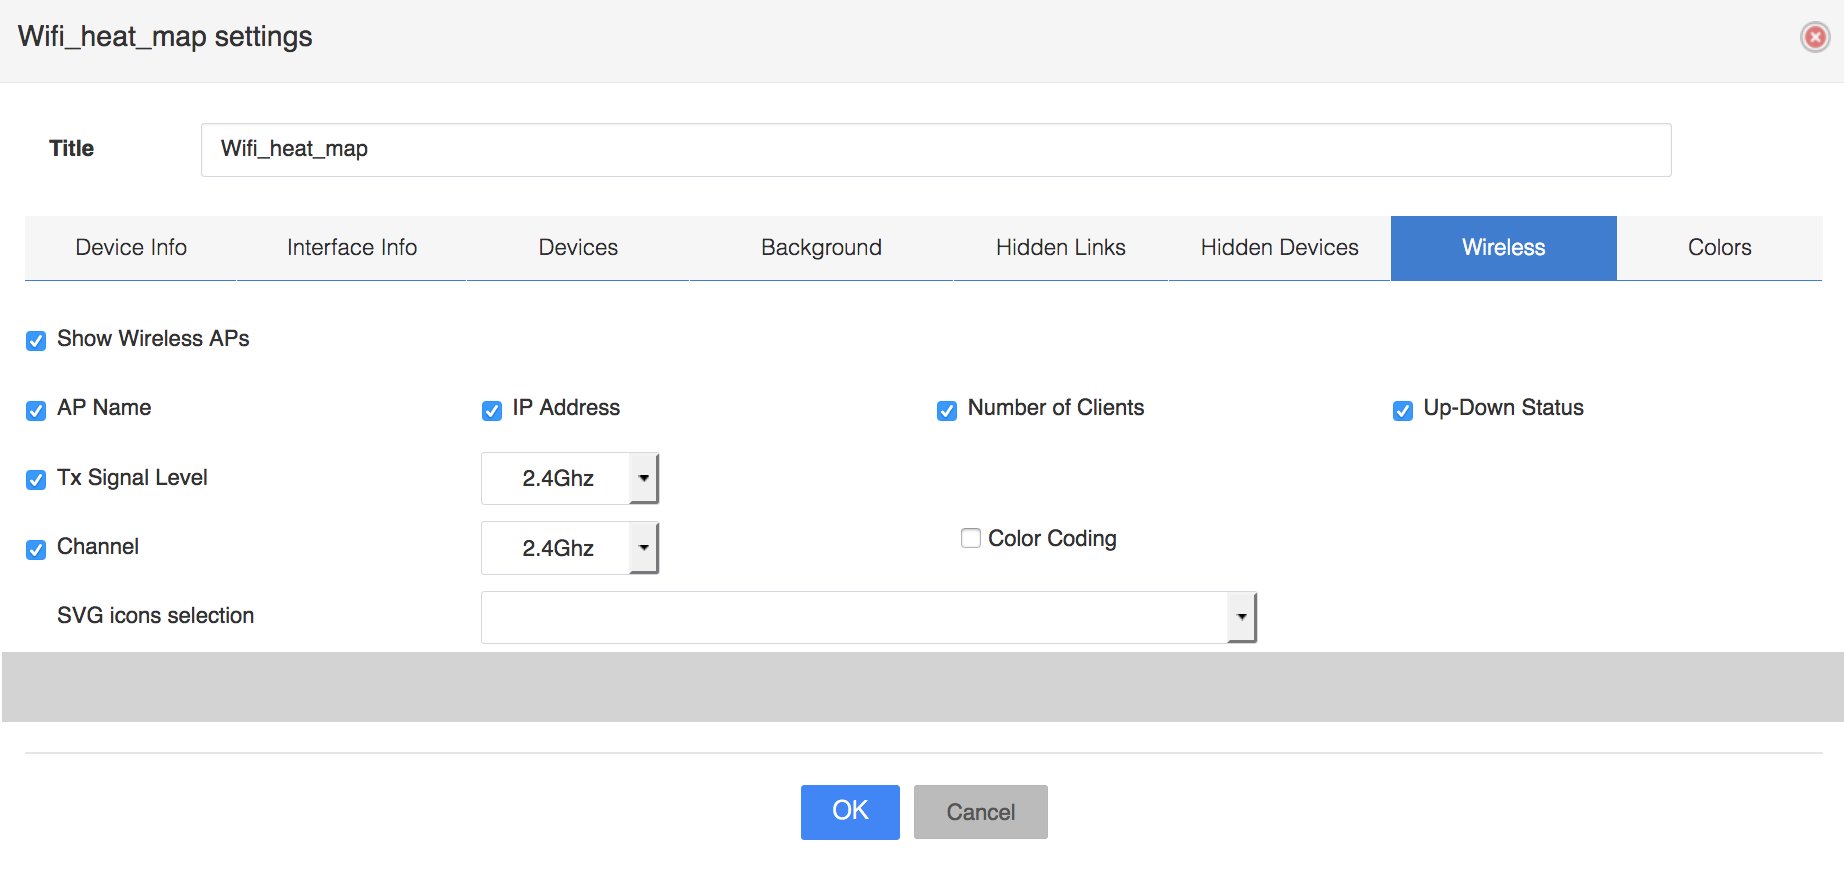
In the topology toolbar settings option, you must check the option to see access points in the topology:
Afterwards, the topology looks like this:
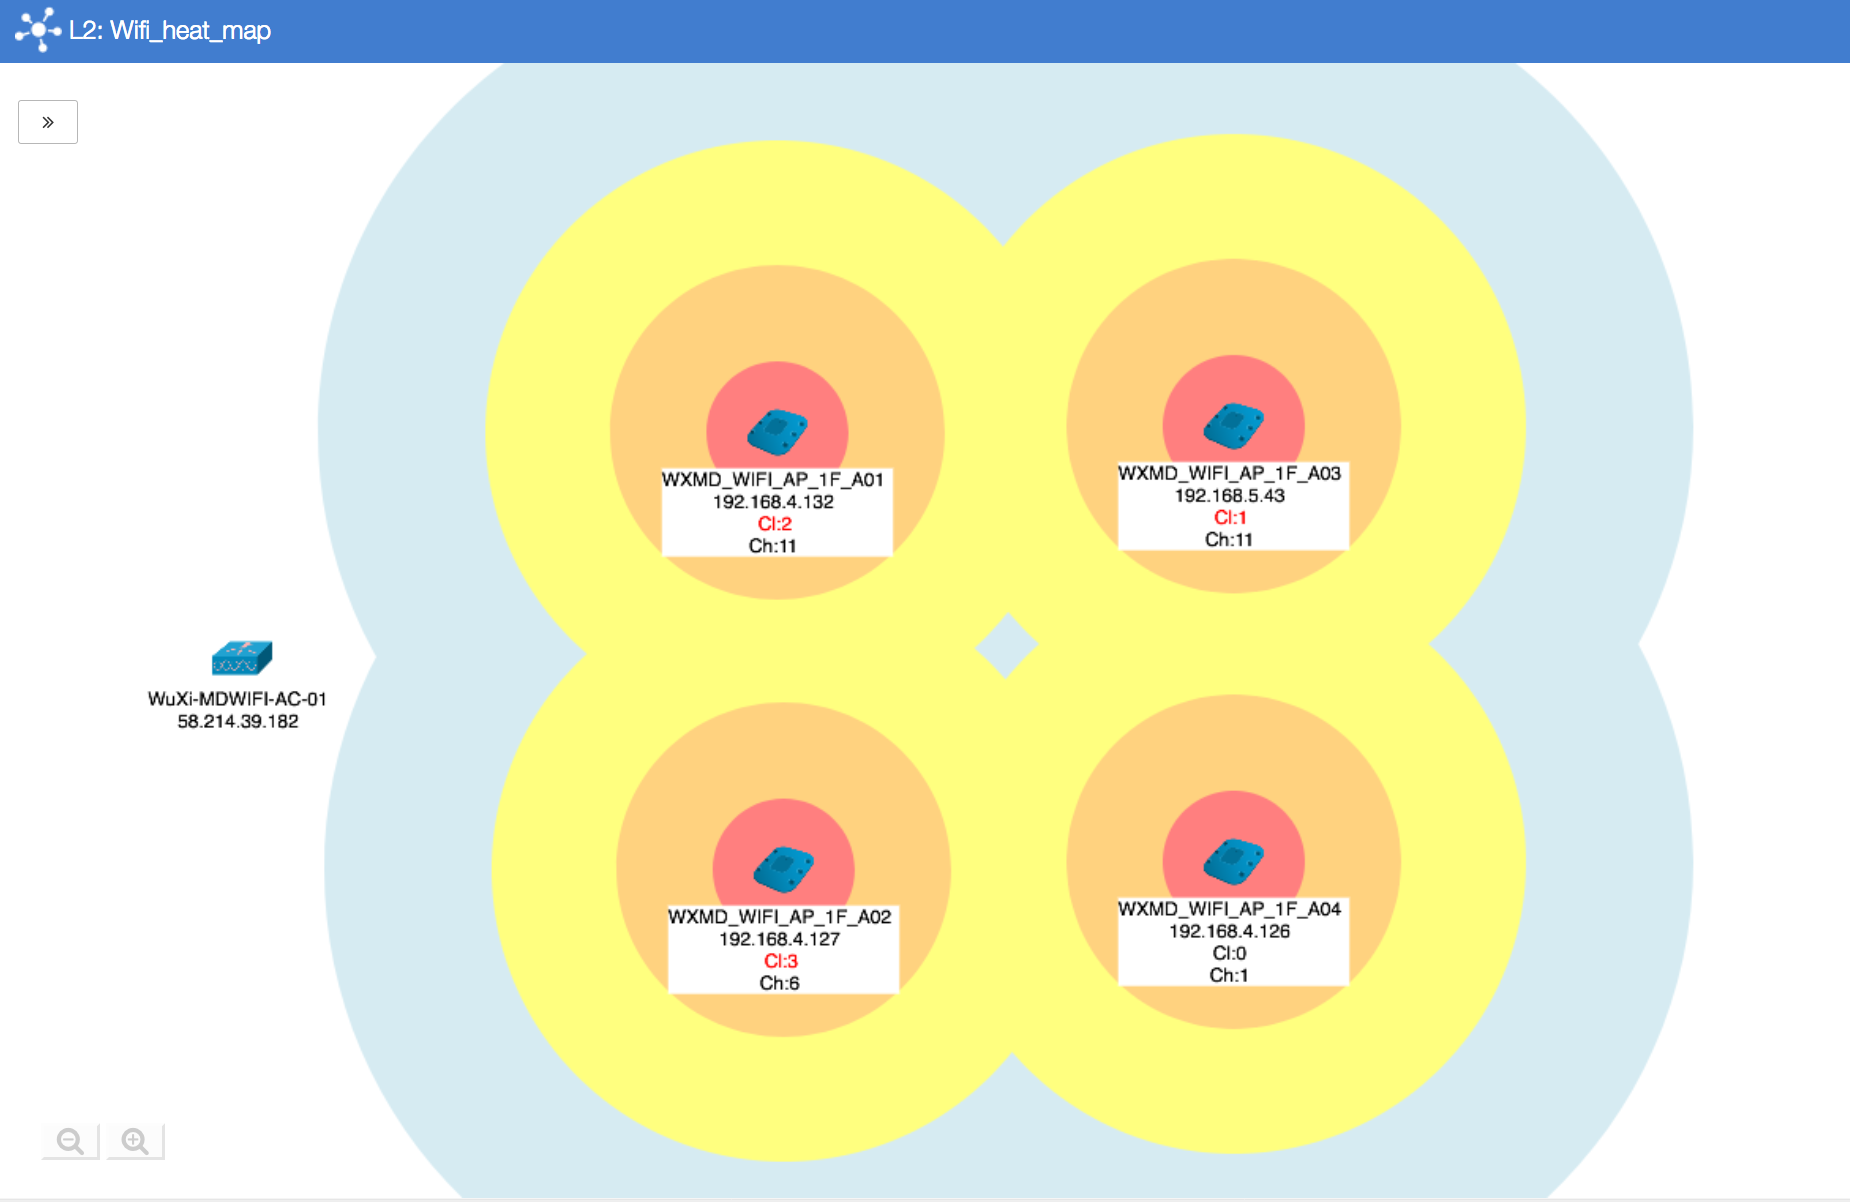
You can see which channel is used on each AP and how many clients are connected to each AP.