Nectus can monitor OpenFlow capable devices in the same way as the non-OpenFlow devices.
In this article we will show how Nectus can discover and monitor switches that are SDN OpenFlow ready.
We will use following sample topology for demonstration with Floodlight OpenFlow controller and three OpenFlow switches: Read more
Under the Tools menu, there are quite a few tools that can help the operator to understand better the network, to perform troubleshooting and to gather information from devices.
These are the options: Read more
This post will cover the SysLog server functionality of Nectus network monitoring software.
As with any modern network monitoring software Nectus has the ability to receive and store the syslog messages from routers, switches or servers.
Syslog messages can be accessed from Top menu “Logs”: Read more
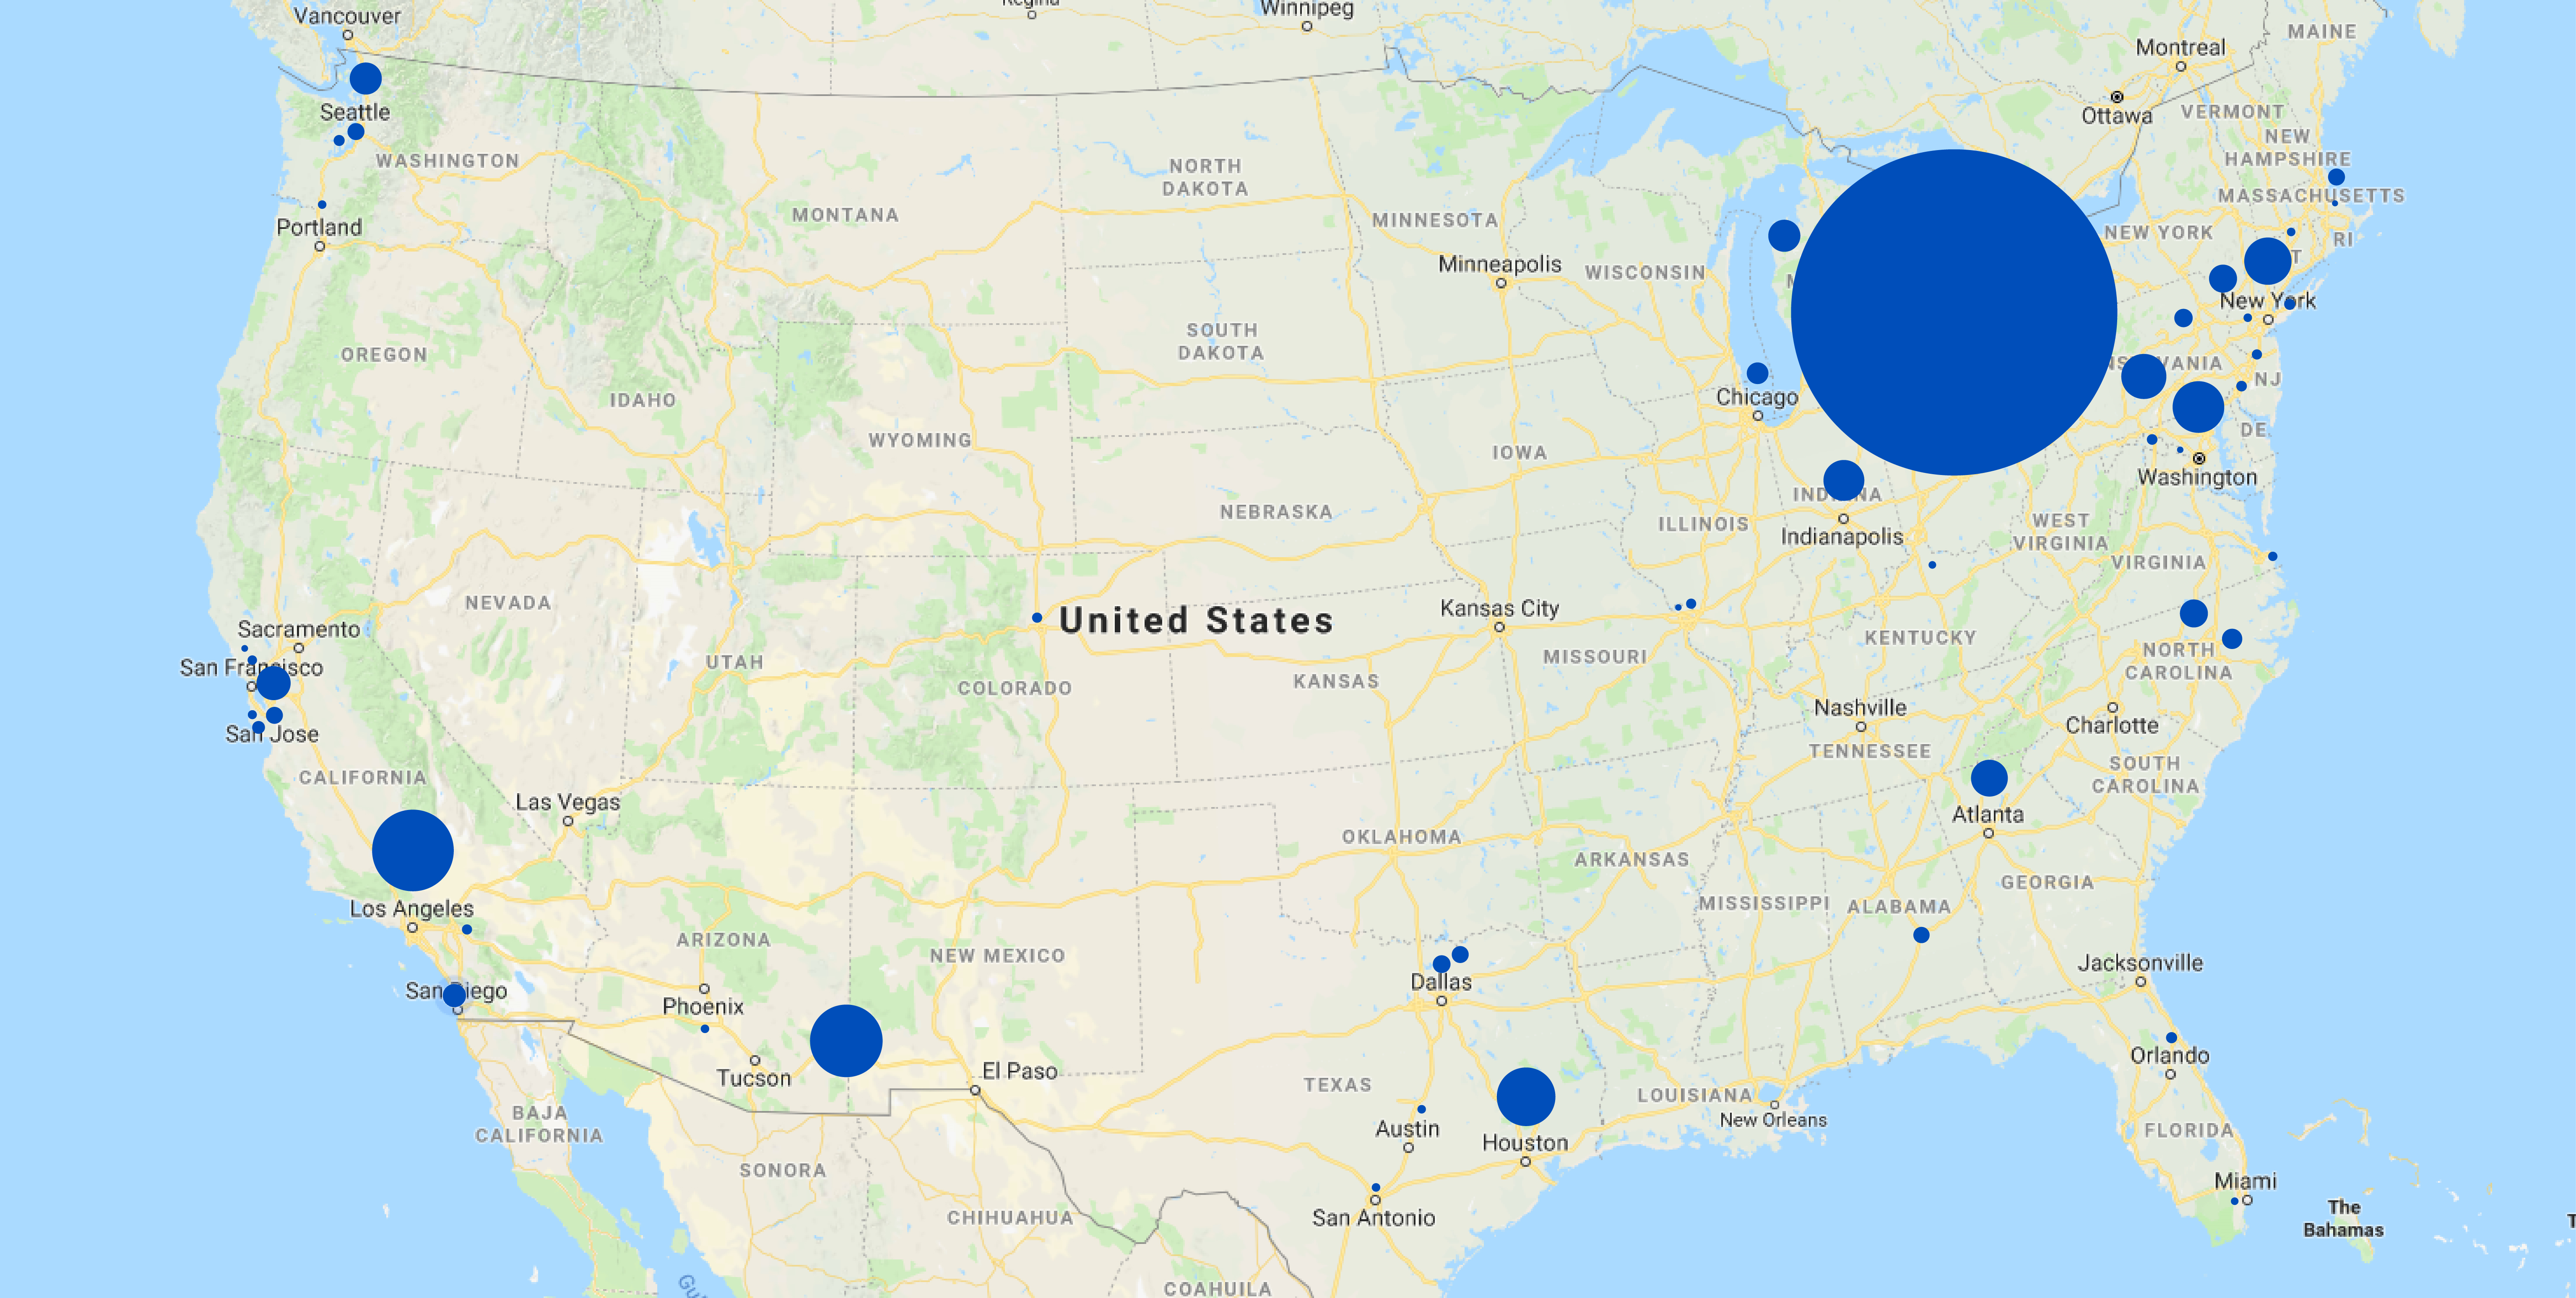
Note: Information is based on Nectus IP geo-location service
| State | City | IPv4 Addresses |
| Ohio | Columbus | 225326103 |
| California | Los Angeles | 54776440 |
| Arizona | Fort Huachuca | 54644594 |
| Texas | Houston | 42689210 |
| District of Columbia | Washington | 32721834 |
| New York | New York City | 31867103 |
| Virginia | Ashburn | 31828300 |
| Indiana | Indianapolis | 26421929 |
| Georgia | Atlanta | 25527566 |
| California | Palo Alto | 25105708 |
| Washington | Redmond | 24885468 |
| Michigan | Dearborn | 23705811 |
| North Carolina | Durham | 21588969 |
| New Jersey | Newark | 21491795 |
| California | San Diego | 21485402 |
| Illinois | Chicago | 20074587 |
| North Carolina | Raleigh | 18955414 |
| New Jersey | Bedminster | 17843408 |
| Texas | Richardson | 17241943 |
| Texas | Dallas | 16869204 |
| Massachusetts | Cambridge | 15868348 |
| California | San Jose | 15336783 |
| Washington | Seattle | 15260827 |
| Alabama | Montgomery | 14906638 |
| California | Cupertino | 13954110 |
| Washington | Bellevue | 13800919 |
| Connecticut | Fairfield | 13507953 |
| California | San Francisco | 12561267 |
| Pennsylvania | Philadelphia | 12464449 |
| Virginia | Reston | 11731922 |
| Florida | Lake Mary | 10572081 |
| New Jersey | Mount Laurel | 10087552 |
| Colorado | Denver | 9869523 |
| Missouri | Saint Louis | 9426794 |
| California | Norwalk | 9273764 |
| Virginia | Virginia Beach | 9107341 |
| Michigan | Ann Arbor | 8772940 |
| California | Mountain View | 8474238 |
| Connecticut | Middletown | 8241397 |
| Texas | San Antonio | 7877211 |
| Texas | Austin | 7734993 |
| Arizona | Phoenix | 7649529 |
| Oregon | Portland | 7600141 |
| New Jersey | Rahway | 7312241 |
| Florida | Miami | 6713810 |
| Ohio | Cincinnati | 6688810 |
| California | Concord | 6607183 |
| Virginia | Dulles | 6470388 |
| Missouri | Town and Country | 5898488 |
| Massachusetts | Boston | 5557232 |
| Louisiana | Monroe | 5300043 |
| Colorado | Greenwood Village | 5070591 |
| Pennsylvania | Pittsburgh | 4780729 |
| Missouri | Kansas City | 4578123 |
| Virginia | Herndon | 4492530 |
| Michigan | Detroit | 4336217 |
| Pennsylvania | Doylestown | 4203957 |
| North Carolina | Charlotte | 4085710 |
| Tennessee | Nashville | 3916537 |
| Georgia | Duluth | 3805720 |
| Nevada | Las Vegas | 3792683 |
| Illinois | Naperville | 3716723 |
| Florida | Orlando | 3665033 |
| California | Sacramento | 3601243 |
| Utah | Salt Lake City | 3592200 |
| Alabama | Redstone Arsenal | 3428226 |
| Minnesota | Minneapolis | 3412363 |
| Florida | Tampa | 3400441 |
| New Jersey | Morristown | 3304100 |
| California | Santa Clara | 3252933 |
| New York | Rochester | 3189712 |
| Maryland | Baltimore | 3079657 |
| Minnesota | Saint Paul | 3019512 |
| Arizona | Kingman | 2983075 |
| Massachusetts | Springfield | 2927039 |
| Wisconsin | Milwaukee | 2811053 |
| Colorado | Fort Collins | 2752782 |
| Wisconsin | Madison | 2732615 |
| California | Belmont | 2725536 |
| Texas | Plano | 2671935 |
| Virginia | Arlington | 2668836 |
| Connecticut | Stamford | 2609471 |
| Ohio | Cleveland | 2600011 |
| Kansas | Overland Park | 2528866 |
| Texas | Irving | 2512563 |
| Kentucky | Richmond | 2509411 |
| Texas | Fort Worth | 2494944 |
| Arkansas | Little Rock | 2446145 |
| Florida | Jacksonville | 2423627 |
| Missouri | Columbia | 2266295 |
| Oregon | Beaverton | 2224613 |
| New York | Buffalo | 2210272 |
| California | San Ramon | 2131203 |
| Ohio | Akron | 2098568 |
| California | Pleasanton | 2097585 |
| Maryland | Rockville | 2072266 |
| California | San Mateo | 2044008 |
| Nebraska | Omaha | 2020147 |
| New York | Albany | 2018827 |
Meltdown and Spectre bugs in simple words.
All modern processors have very important feature called “Speculative Execution” where CPU tries to predict all possible operations that might be required to be executed next and actually executing those without knowing for sure which one will be the next.
Those guesses are called Speculative Branches. By the time when next operation is determined CPU already executed it as part of “Speculative Execution” but it also executed all other branches that no longer needed. Not only it executed unneeded operations it also kept the data for those branches. Data that was processed during unneeded Speculative Execution branches remains accessible for some time before it is completely discarded.
But data protection is only enforced for main execution branch, but not for Speculative Execution branches making it possible to access sensitive data that normally should not be accessible. Good intentions causes harm..
One of the latest features that was added this week is “Routing Table” view in device context menu. Read more
PowerPoint Nectus features presentation as of January 2018
Trust me. CLI is not going anywhere. CLI is the only way to troubleshoot SDN.
There will be plenty of new CLI commands to “show” flow tables logic, operation
and debug communications between data plane and controller.
I would say importance of CLI is even greater in SDN as you now has
to observe operation between Control plane and Data plane which previously “just worked”.
CLI is here to stay, it just going to be used mostly for monitoring rather than configuration.
So.. you upgraded your network from legacy dedicated hardware to OpenFlow based SDN, laid off all of your network engineers who know CLI and ask yourself a question: How do I monitor my SDN now?
How do I pull a power supply status or CPU temperature? How to read TCAM utilization level? How to see an SFP status or number of CRC errors?
If we look into OpenFlow specifications, it defines communication protocol between OpenFlow controller (control plane) and OpenFlow switch (data plane) it goes into details of flow creation and management but there is nothing that tells how hardware monitoring has to be implemented on OpenFlow SDN switch.
Access to operational monitoring features that we love so much is not a part of OpenFlow specifications and will not be a part of SDN controller functionality. Old and proven SNMP-based monitoring is likely to continue to be a primary way to monitor your Data plane operation as it was with legacy dedicated hardware unless OpenFlow specs get expanded with new monitoring specifications.
This post will cover how Nectus can dynamically build topologies and how you can check various performance statistics.
Nectus gives the possibility to build automatically L2 and L3 topologies based on the discovered devices.
Additionally, it allows the administrator to create custom topologies by dragging on the map the devices that are required to be on the topology. Read more
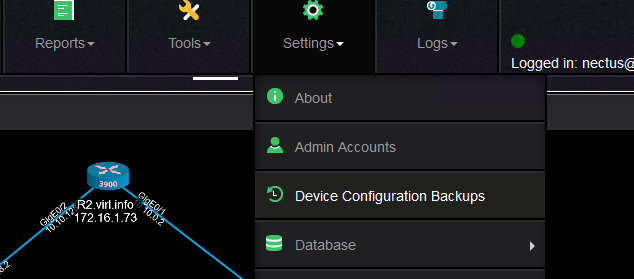
This post will cover the configuration backup and change tracking features available in Nectus.
Nectus provides the ability to back up the configuration of the devices discovered, on a scheduled basis and manually.
Nectus comes with some default settings regarding the configuration backup and for others administrator input is required.
This is the configuration backup settings menu:
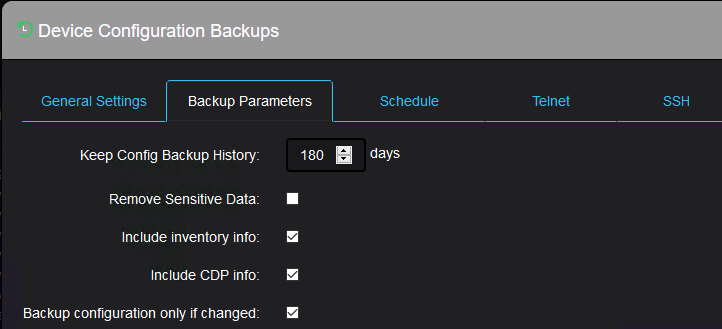
Multiple tabs on the menu allows you to specify some parameters like what to be backed up and for how long to keep a configuration backup:
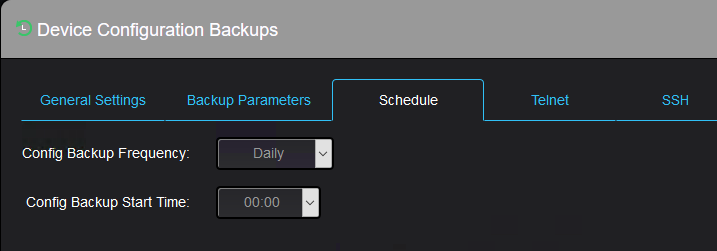
Or how often and when the automatic backup should happen:
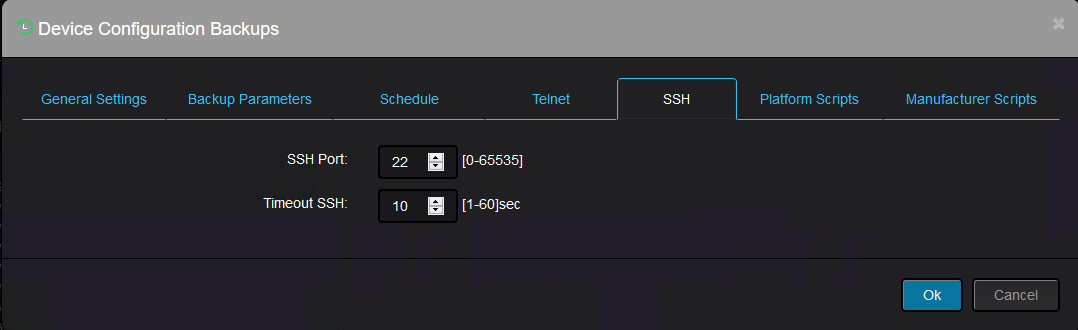
The next two tabs are for telnet protocol configuration:
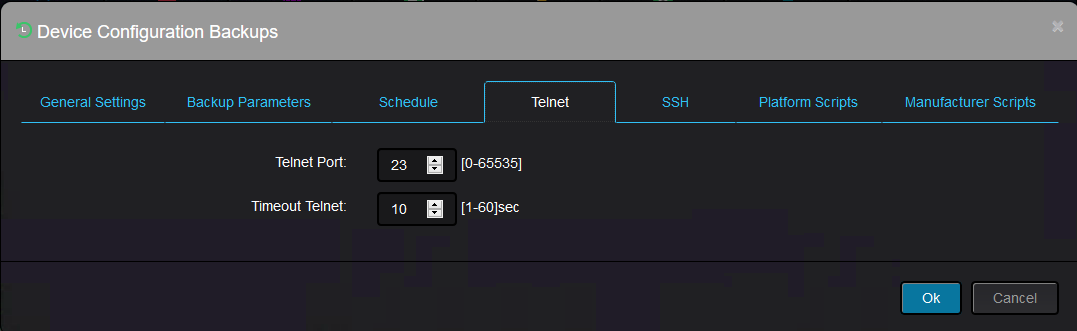
And ssh protocol configuration:
The remaining two tabs allows the administrator to use custom specific scripts for backup (in case you would like to perform partial backup for instance).
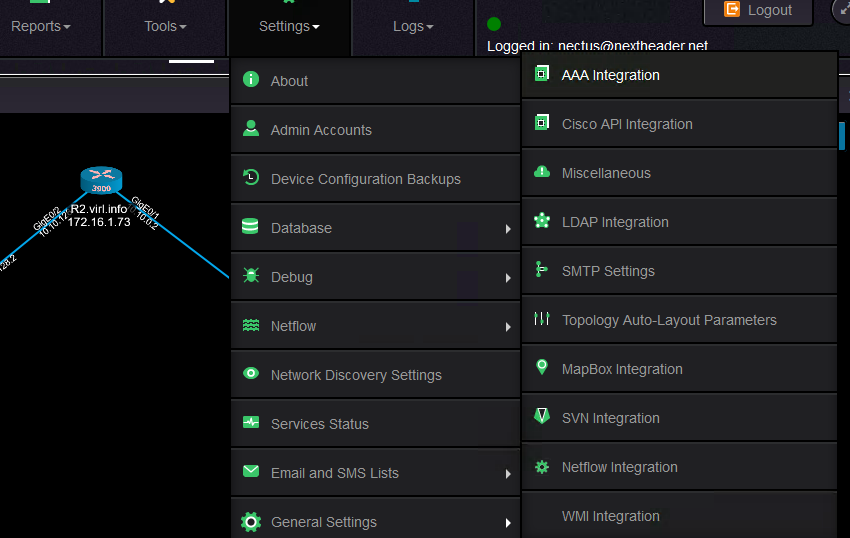
Nectus must connect to the device using a valid username/password combination on that device.
If the username/password exist on the device, then it must be fed to Nectus.
This is where you set this up:
And these are the input values required
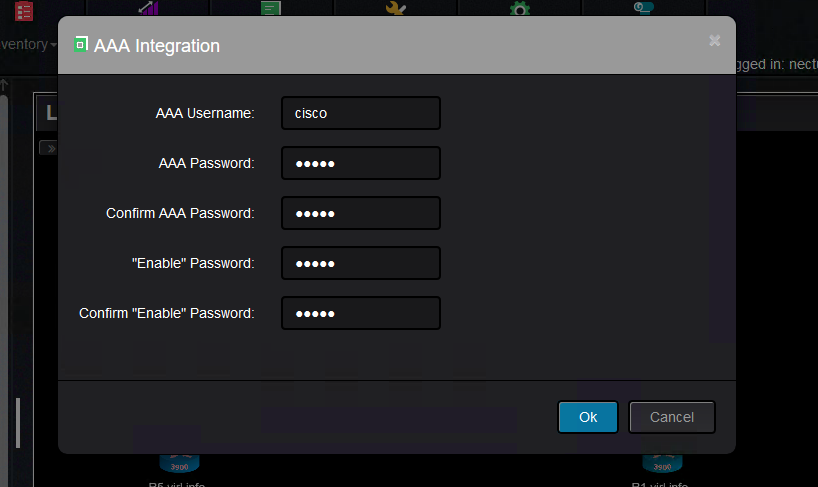
Once this is done, you can backup configuration per device, per group of devices (vendor, platform, model) or for all devices.
This is how you can backup a group of devices, which in this case is the same as all the devices are backed up (this is because there are only Cisco devices in the topology):
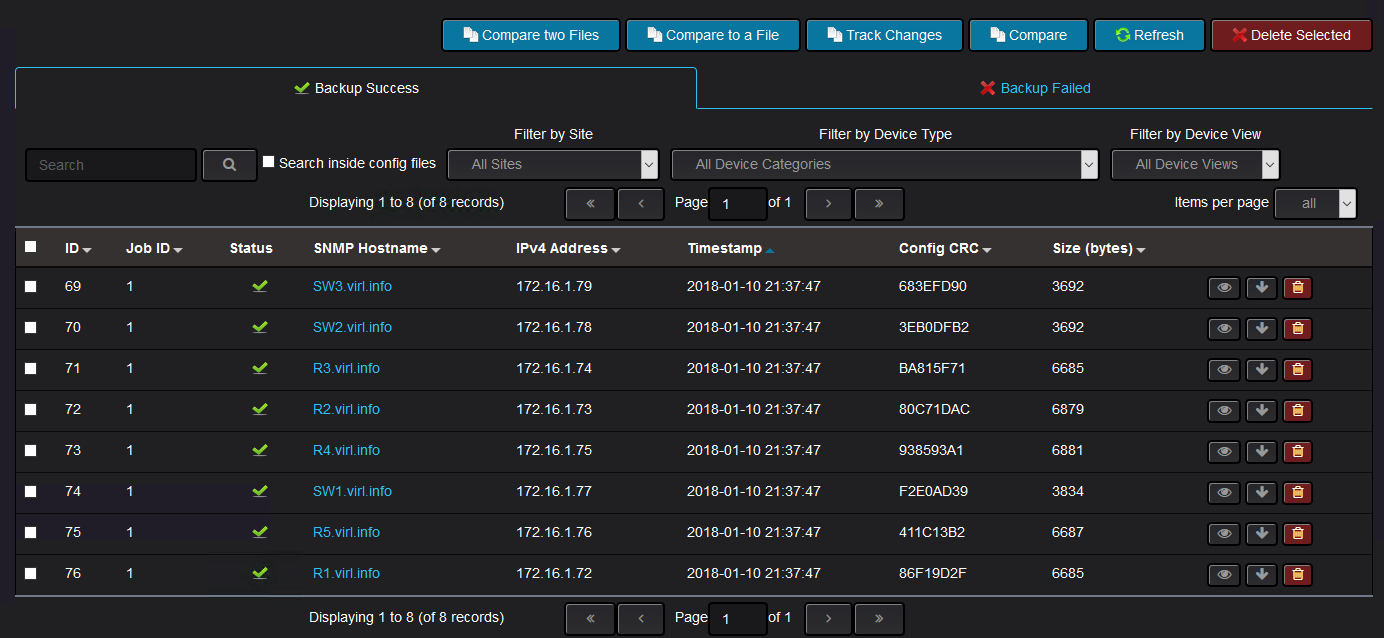
From the inventory menu, you can see the successful backups and the failed backups.
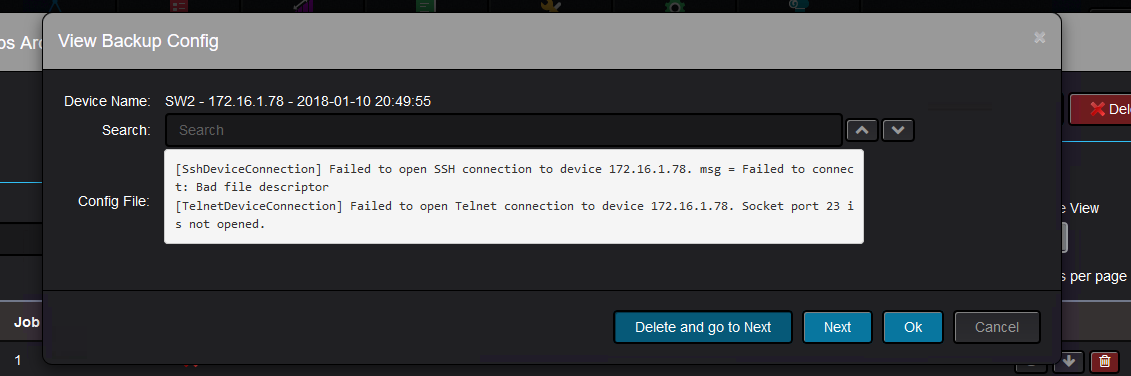
If the backup failed, then you would see like this:
You can see the reason it failed, which in this is because Nectus could not establish a telnet or SSH connection to the device:
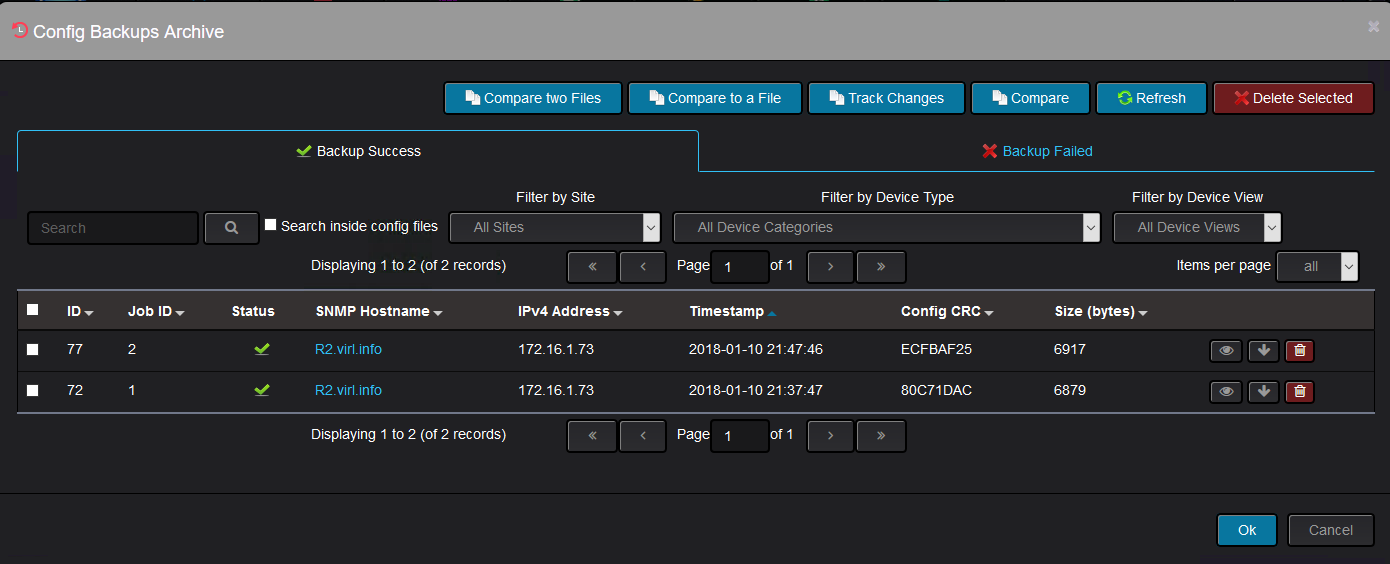
If the backup is successful, the device configuration should show up:
Clicking on any of the files, you will see the configuration of the device at the time configuration backup was triggered:
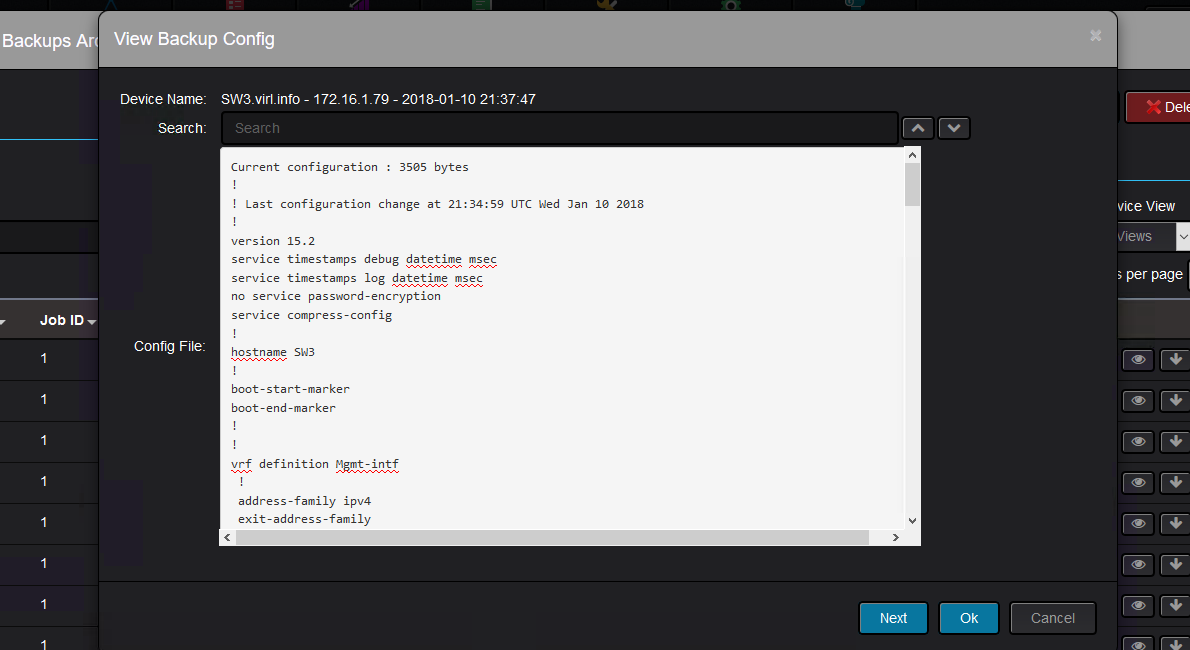
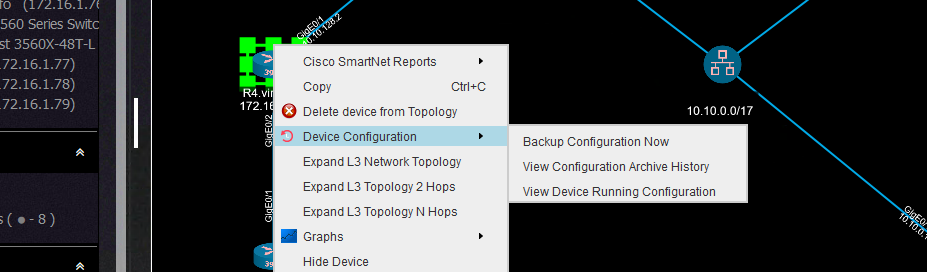
Each device context menu has a configuration backup section where you can perform various actions:
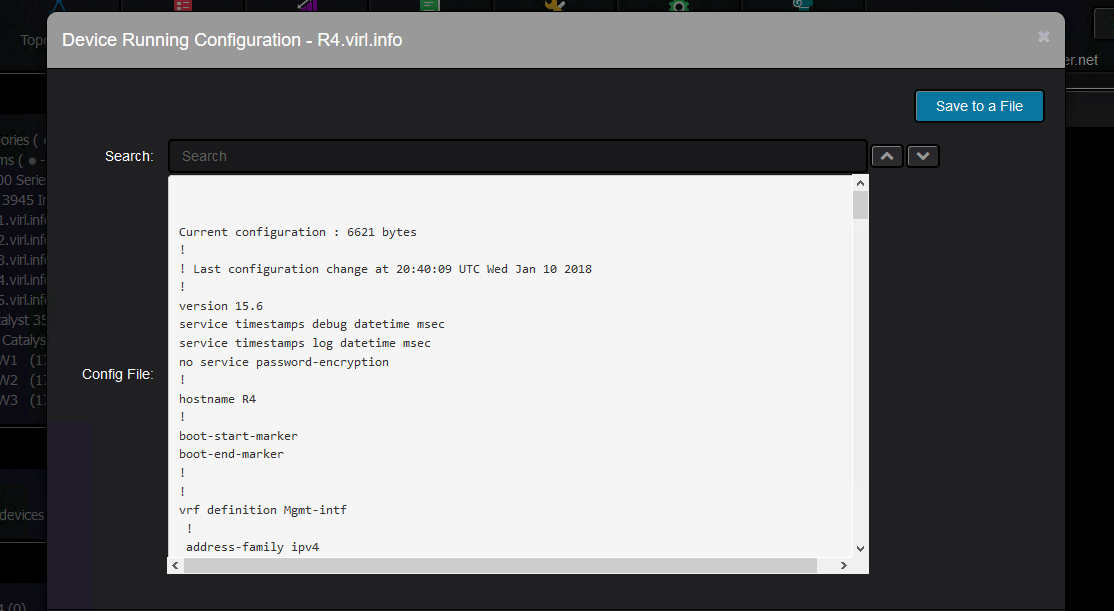
You can backup the configuration, view the running configuration:
Or you can view the archive of all the device backups:
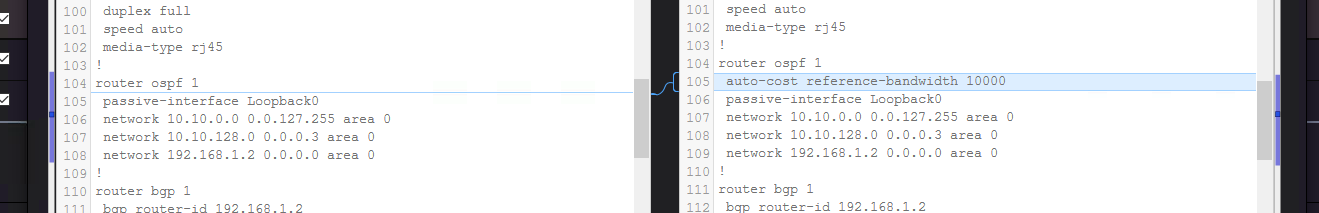
Further on, you can compare two backup files to see what has changed.
They do not need to be consecutive backups. Here, “auto-cost reference-bandwidth” was configured on the device:
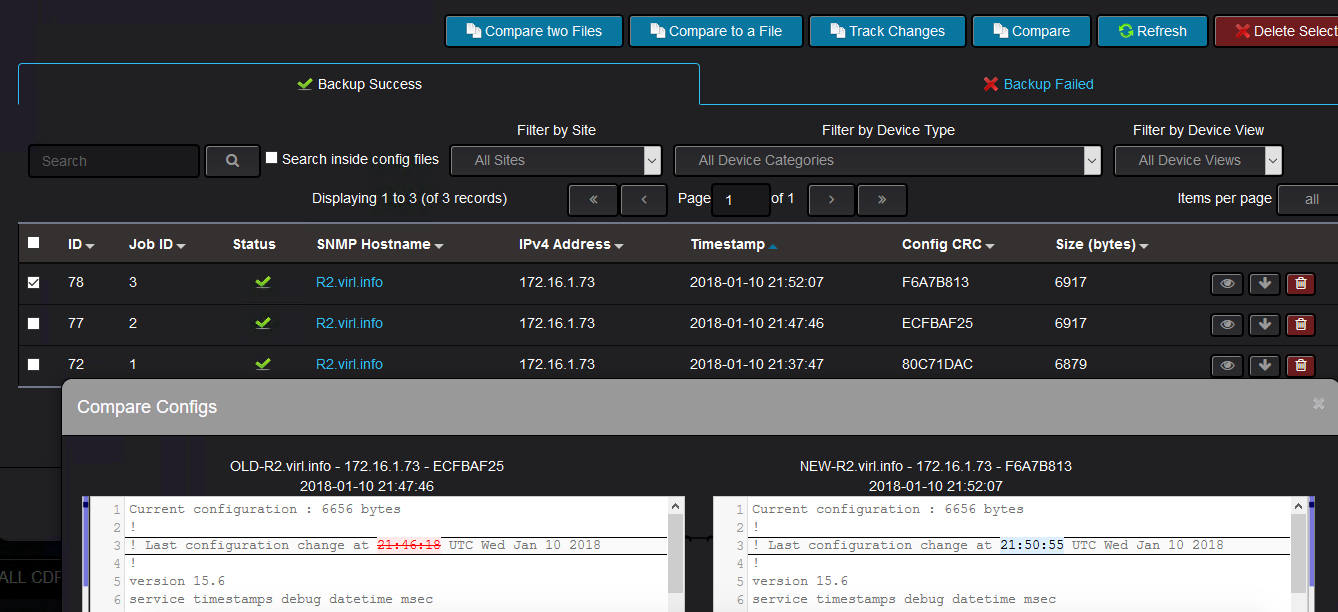
Another useful feature is the tracking change feature which shows the changes between two consecutive backups.
You select the newer backup and Nectus will show what has changed since the previous backup was taken:
In case there are backups that were taken before Nectus was deployed and you would like to see what are the changes between those configurations and the ones taken by Nectus,
you have the possibility to compare the Nectus backups with the external files. You can even compare two external configuration backups with the help of Nectus.
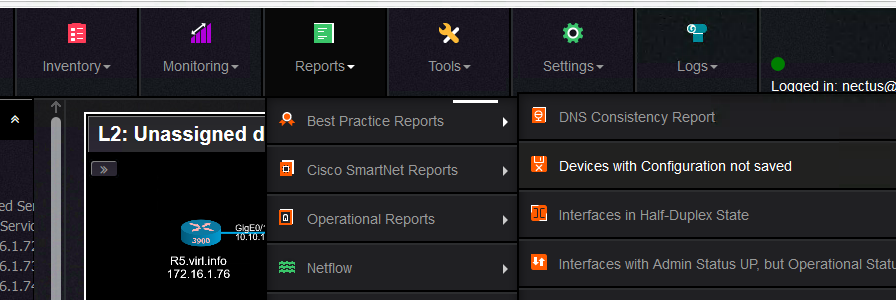
Another useful feature that is related to configuration backup, is the report that tracks the devices whose configuration was not saved after the last change.
You can trigger this report like this:
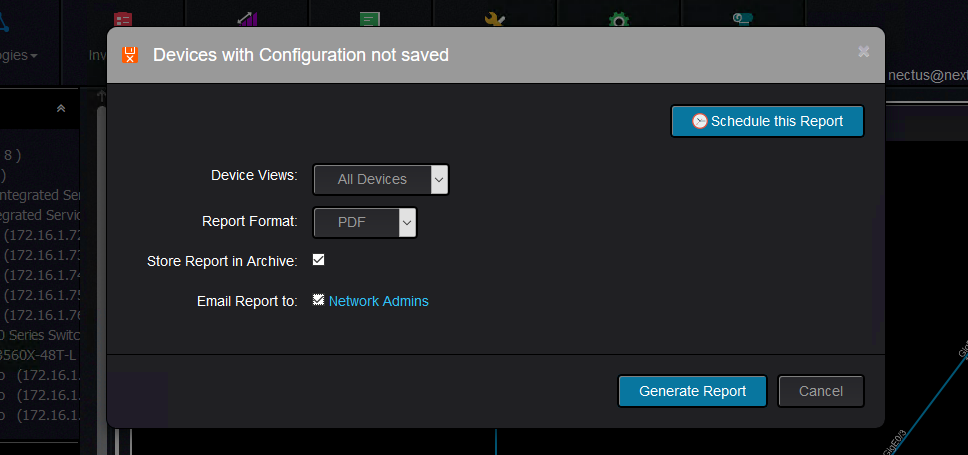
You can specify if you want to send the report to an email address and if you also want to keep this report for auditing purposes:
And the report looks like this:
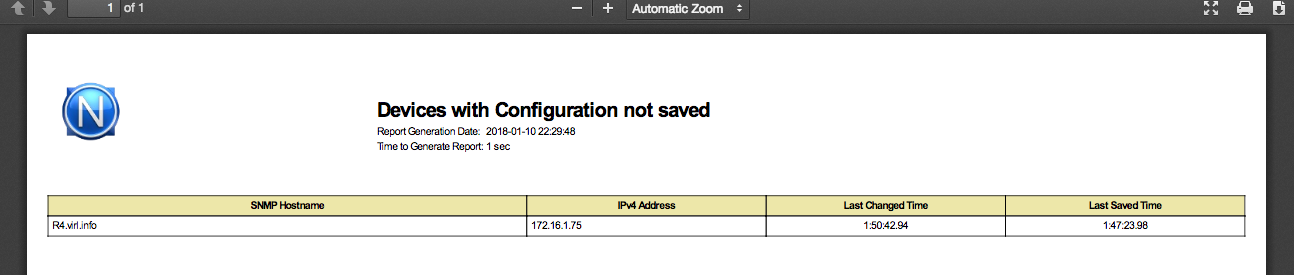
Keep in mind that the time you see in the report is the uptime of the router. For instance, in the above example,
the device configuration was saved last time when the router had an uptime of 1h47m
and the last configuration change was done when the router had an uptime of 1h50m.
And this would pretty much all about configuration backup and change tracking in Nectus and how it can help you to save your configurations and see
what has changes from one backup to the next one or any other backup.
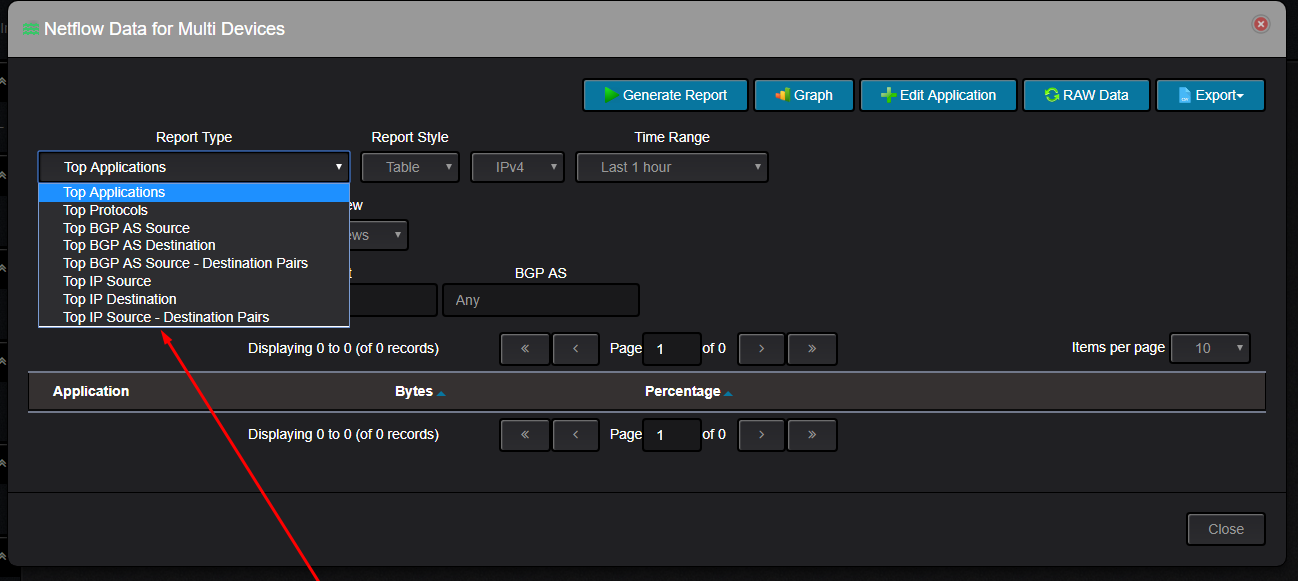
Here is the list of NetFlow reports currently supported by Nectus
Top Applications
Top Protocols
Top Source IP
Top Destination IP
Top Source + Destination IP pairs
Top Source BGP AS
Top Destination BGP AS
Top Source + Destination BGP Pairs
Nectus beats Solarwinds in pretty much any aspect: Speed, Usability, Size, Installation Time, Support.
We optimize every little function or procedure to perfection and re-write it with Assembler language if it is not good enough.
We develop custom stress-testing tools (such as Netflow Generator ) so we can push the Nectus KPI limits higher.
Our product is designed by CCIEs for CCIEs and every single UI page is designed by active network engineer that knows exactly how information should be presented because they use Nectus themselves every day.
We also have a three-click rule: Any information that user wants must be available in no more than 3 clicks.
Also Nectus doesn’t have a User Manual. Because it does not need any.
When it comes to Network Discovery we are absolute market leaders and can determine router model by the sound of its Fan. Just kidding..
But here is how we actually do it.
Let say IP address 10.20.45.1 is alive and we need to determine what type of device this is.
Step 1: Perform SNMP Get operation for sysObjectID.0 (1.3.6.1.2.1.1.2.0)
snmpwalk -v2c -c public 10.20.45.1 sysObjectID.0
This OID stores platform specific string which suppose to be unique for each device type.
For example device responds with: .1.3.6.1.4.1.9.1.924
This string is called Platform Specific OID and contain Vendor code in seventh position.
Each vendor has IANA assigned unique number listed here https://www.iana.org/assignments/enterprise-numbers/enterprise-numbers
In our case code is “9” which means that this is a Cisco device.
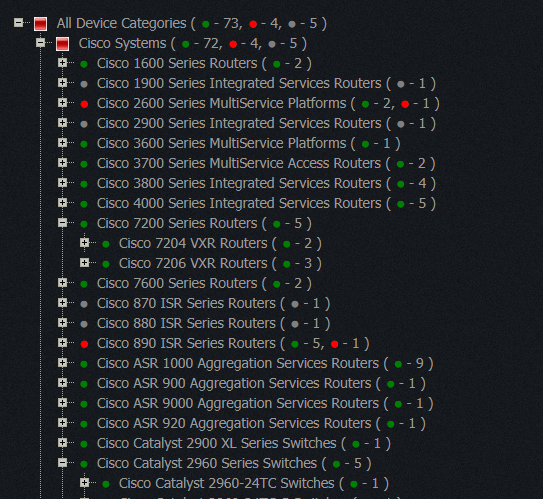
The remaining numbers define platform info and that information is collected from MIB files published by each vendor which we all collected and combined into a single repository of 1200 vendors which contains now around 56,000 different platform OID which we all classified by Device Category and Model.
At the end we have very nice device classification tree like this
In this article we will see some of the features of Nectus that can enhance the Virtual Internet Routing Lab (VIRL) experience.
VIRL is Cisco’s network simulation platform where you can run Cisco OS (IOS, IOS XE, IOS XR, NX-OS, ASA) virtual machines and other third party virtual machines (this includes Linux servers, traffic generators and other networking vendors virtual machines) to build topologies for feature testing and validation before introducing them in production.
We will explain some features of Nectus that can complement VIRL to help you visualize better your network.
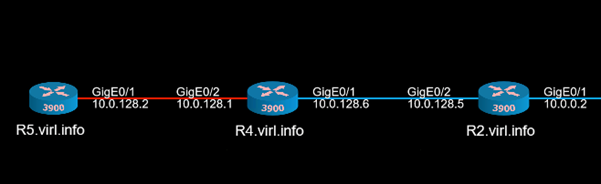
This is the VIRL topology that will be used:
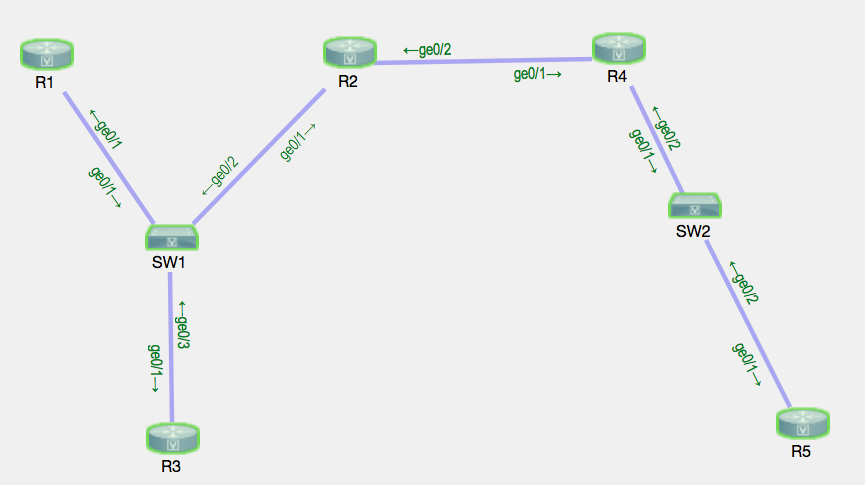
The devices were started with some predefined configuration that included interface IP configuration, routing protocols (EIGRP, BGP).
VIRL topology is using shared flat network so that each device will get an IP address from 172.16.1.0/24 network on their GigabitEthernet0/0 interface as their management IP address.
Nectus was installed on a Windows 2016 server that was acting as an OpenVPN client connecting to VIRL server which means that it received an IP address from the range 172.16.1.20 – 172.16.1.39, thus making the Nectus and the VIRL routers to be in the same subnet.
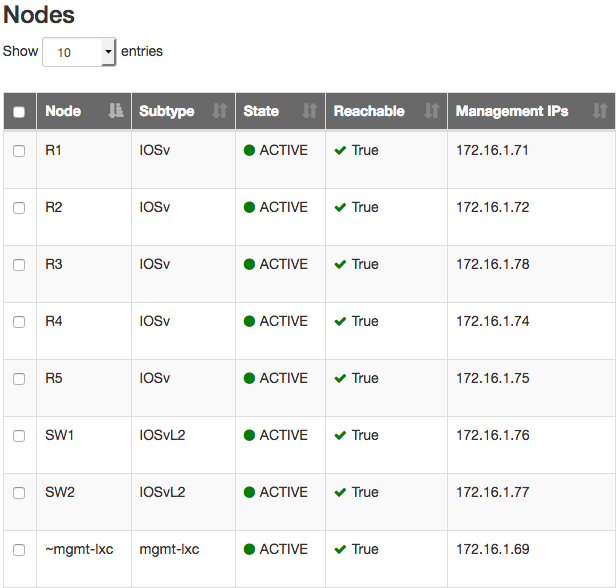
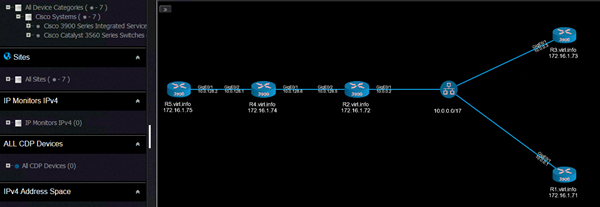
Once Nectus starts discovering the devices from 172.16.1.0/24 subnet (as per discoverable subnets configured on Nectus), it builds a list with them categorizing them based on the vendor, type of the device, model of the device.
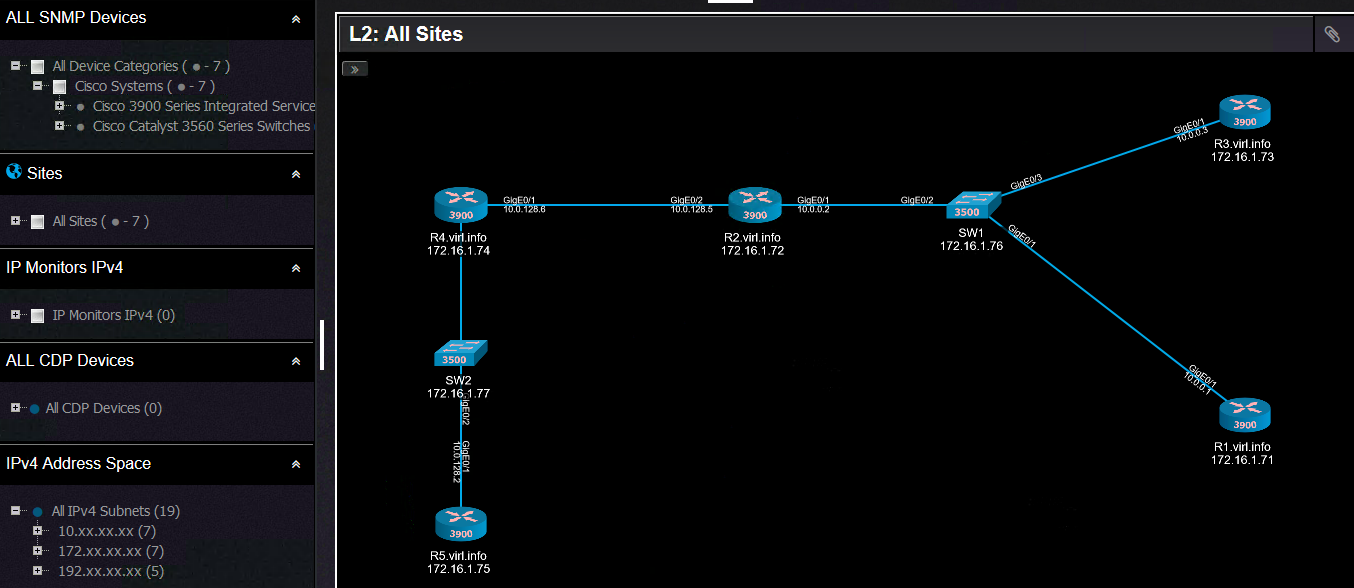
Based on the information collected through SNMP, Nectus can build L2 and L3 topologies.
This is the L2 topology:
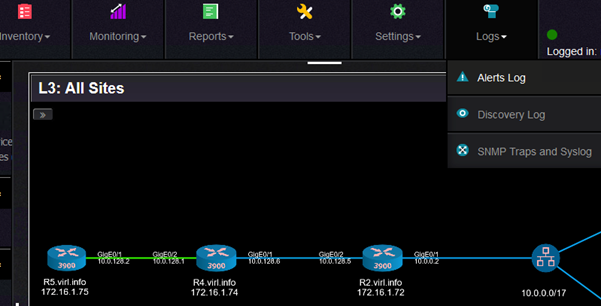
And this is the L3 topology:
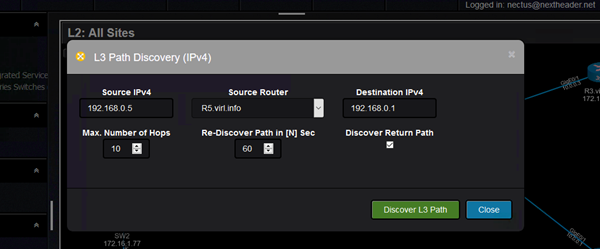
One interesting feature that Nectus can do is to give you a visual result of the path between two points in the network.
This is called L3 Path Discovery (for now only available for IPv4). Source IP, source router and destination IP are the input values:
And the result looks like this:
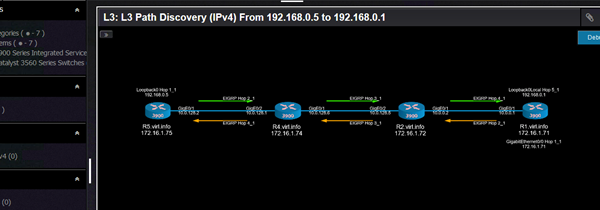
The interesting part is that it can discover asymmetric paths in the network to give a better understanding about how traffic flows in the network.
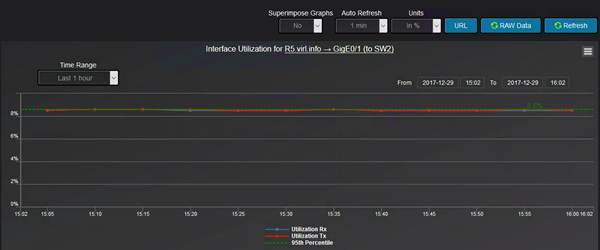
Another interesting set of features is that you can get real time graphs with the some of the characteristics of the interfaces (utilization, availability, errors, dropped packets, traffic volume).
This is how you can select any of the graphs. This is for utilization:
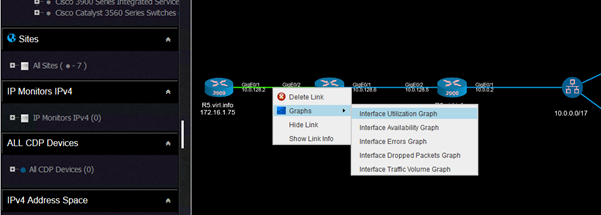
And the graph looks like this:
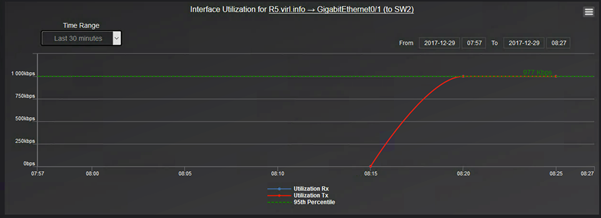
Observe that although on when we selected the link that appear to be between R5 and R4, it is actually between R5 and SW2.
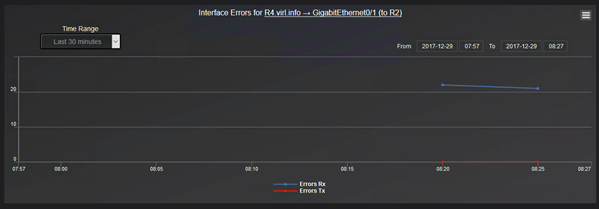
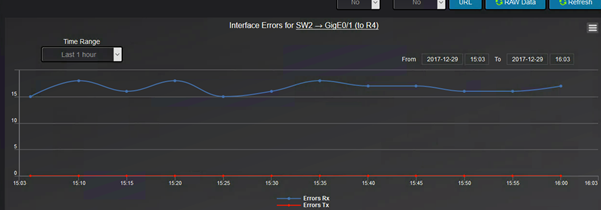
The errors graph shows how many RX and how many TX errors are on interface basis:
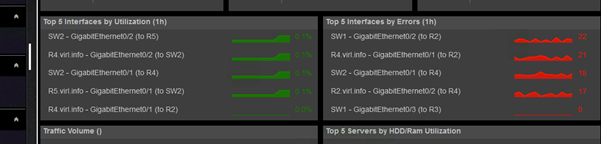
You can have a consolidated view of the top most utilized interfaces or the interfaces that have the most errors.
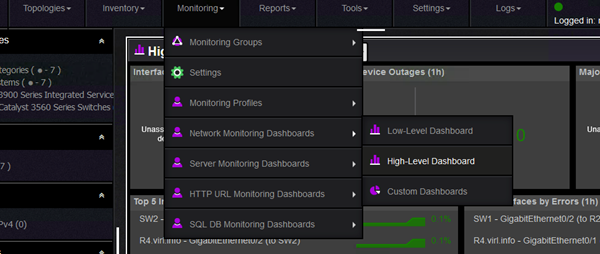
By default, there are few network monitoring dashboards (you can create your own to better accommodate your monitoring needs).
The high level dashboard gives you the top interfaces with regards to various interface statistics:
From here, you will get the the list of interfaces:
Nectus can trigger alerts based on any of these interface characteristics.
For testing purposes, the threshold level for interface utilization at which the alarm is triggered was configured at 1%.
Using ping command (between R4 and R5, therefore through SW2), the interface utilization was around 870Kbps and after changing the bandwidth of the interface to 10Mbps
(adding bandwidth knob under interface configuration), this 870Kbps turned out to be around 8.5% interface utilization which means that the alert should have been triggered.
After some time, the graph is adjusted with the new value:
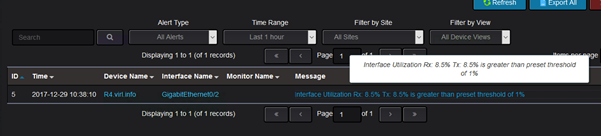
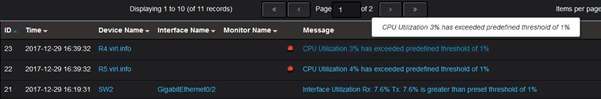
The alerts log shows these type of alerts:
And in this interface utilization, this is the alert:
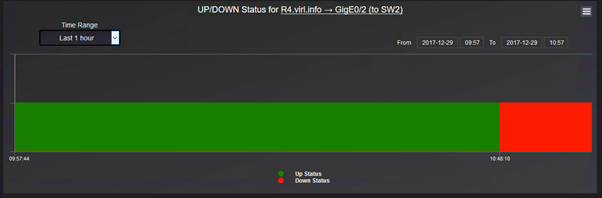
Another useful information that can be retrieved directly from Nectus using the interface graphs is the interface availability that can quickly give some hints about service interruption.
The graph is selected from the link menu:
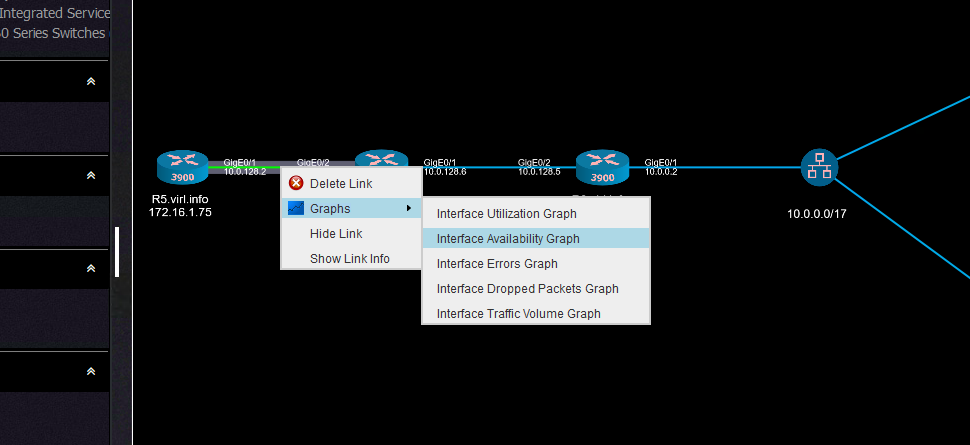
And it should show the state of the interface:
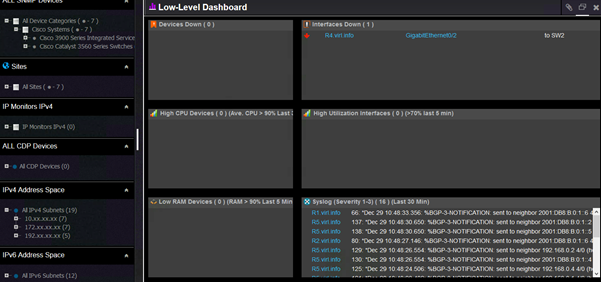
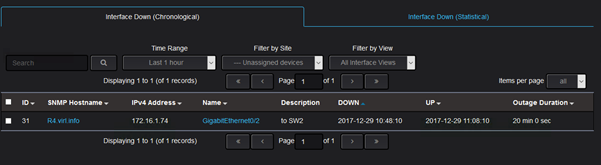
Coming back to the default network monitoring dashboards, the information that an interface that is down is captured by both default dashboards. This is the low level dashboard:
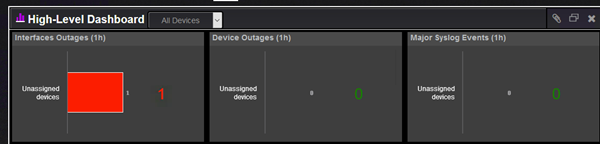
As well by the high level dashboard:
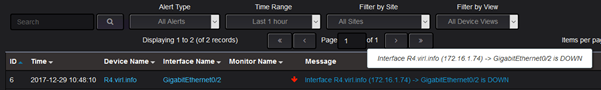
Again, there is an alert sent for such events:
There is a history kept for each outage of the interfaces showing for how long the interface was down:
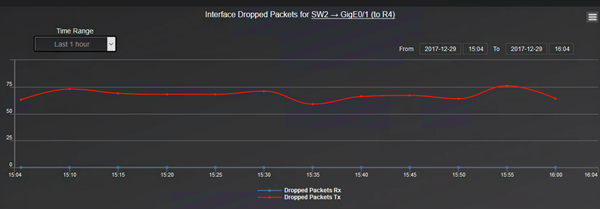
Going further graphs for interface errors and dropped packets are useful to troubleshoot network performance.
And for dropped packets:
Coming back to alerts, Nectus can monitor the CPU usage and trigger alerts as required.
The Device Info menu contains among other CPU usage graphs.
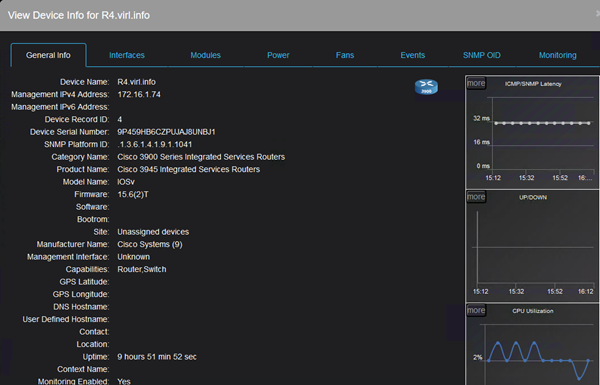
If the CPU usage goes above the threshold, not only you will see this on the graph, but it will also trigger an alert:
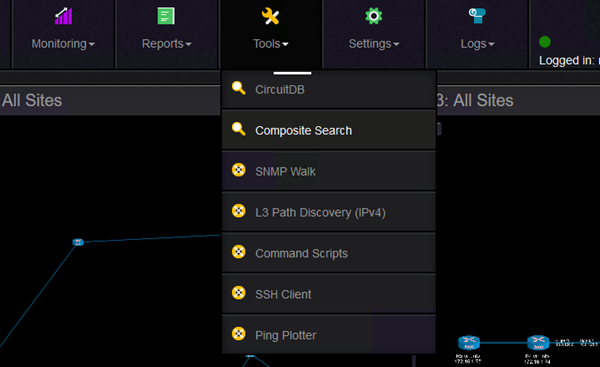
Another interesting feature that can help you quickly find all sort of information about the devices in your topology is the Composite Search feature:
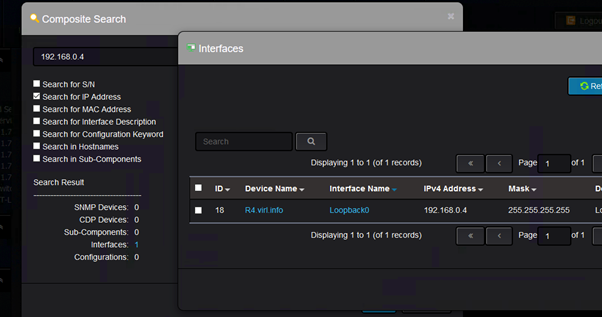
It can find various information and for instance, I would like to find where is this IP configured:
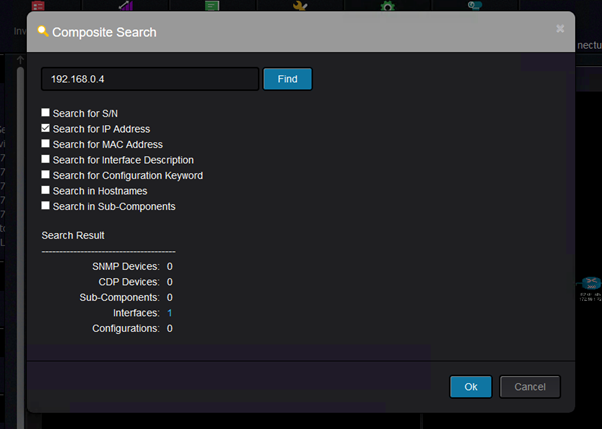
And the result is this:
Lastly, one feature that can improve VIRL usability is that Nectus can show on the topology that a link is down
(after the link was shutdown from CLI or went down for other reasons like err-disable).
Suppose you do this on CLI:
R4(config)#int gi0/2
R4(config-if)#shut
R4(config-if)#
*Dec 29 17:35:29.750: %DUAL-5-NBRCHANGE: EIGRP-IPv6 1: Neighbor FE80::F816:3EFF:FE84:2418 (GigabitEthernet0/2) is down: interface down
*Dec 29 17:35:29.752: %DUAL-5-NBRCHANGE: EIGRP-IPv4 1: Neighbor 10.0.128.2 (GigabitEthernet0/2) is down: interface down
*Dec 29 17:35:31.725: %LINK-5-CHANGED: Interface GigabitEthernet0/2, changed state to administratively down
*Dec 29 17:35:32.725: %LINEPROTO-5-UPDOWN: Line protocol on Interface GigabitEthernet0/2, changed state to down
R4(config-if)#
Then the link will blink on the topology, while VIRL will not show anything with regards to the fact that the interface between the VMs is down:
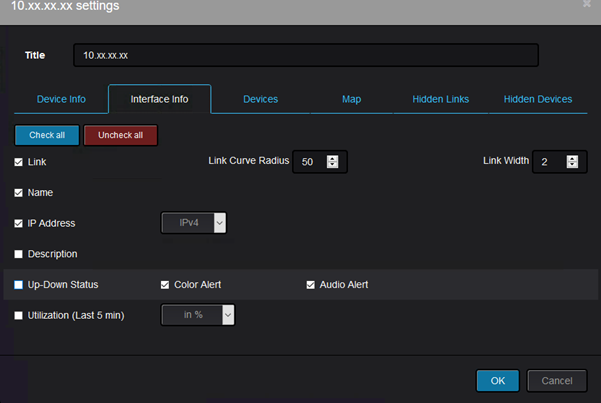
The up/down status can be enabled from the device settings like this:
Throughout this post, various features of Nectus have shown how Nectus5 can bring value to topologies running in Cisco VIRL.
Of course the same features can be used to know your real/production network better, but it is good to know that you can use Nectus5
to monitor your proof of concept network deployed in VIRL.
On every Nectus installation that we conducted I noticed that on average each company has around 10% of network devices that are configured with well-known snmp v2 community strings: public/private.
This is as bad as using “cisco/cisco” as your SSH credentials. That is major security loophole as even read-only string “public” gives possible attacker complete view of the devices’ routing table, interface descriptions, interface IPs, device S/N, list of CDP neighbors with their IPs.
It is fairly easy to discover these devices by adding secondary SNMP profile to your favorite NMS and checking if there is a sudden spike in number of discovered devices.
Problem is so wide-spread that we added discovery of these devices to be a part of standard Nectus network discovery routine.
SNMP v3 does not have this issue as it has way more parameters that has to be configured, plus it gives access to strong encryption, but for some reason adoption rates for SNMP v3 is low comparing to SNMP v2.