Linux Monitoring Agent Installation
Nectus Linux Monitoring Agent is required to be installed on target machine to enable Nectus to monitor Linux system parameters such as CPU and RAM utilization, Storage and Network Utilization.
Agent collects all the required monitoring metrics and reports to the main Nectus Server every 5 minutes.
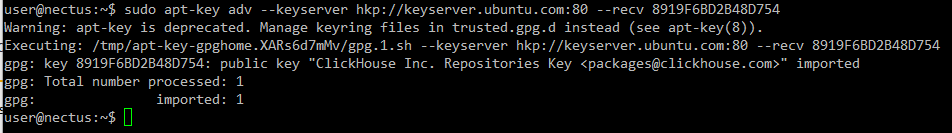
Step 1: Download Monitoring Agent Package
Download binary package appropriate to your target machine Linux flavor and version from the download page.
Step 2a: Installation for Debian-based systems (including Ubuntu)
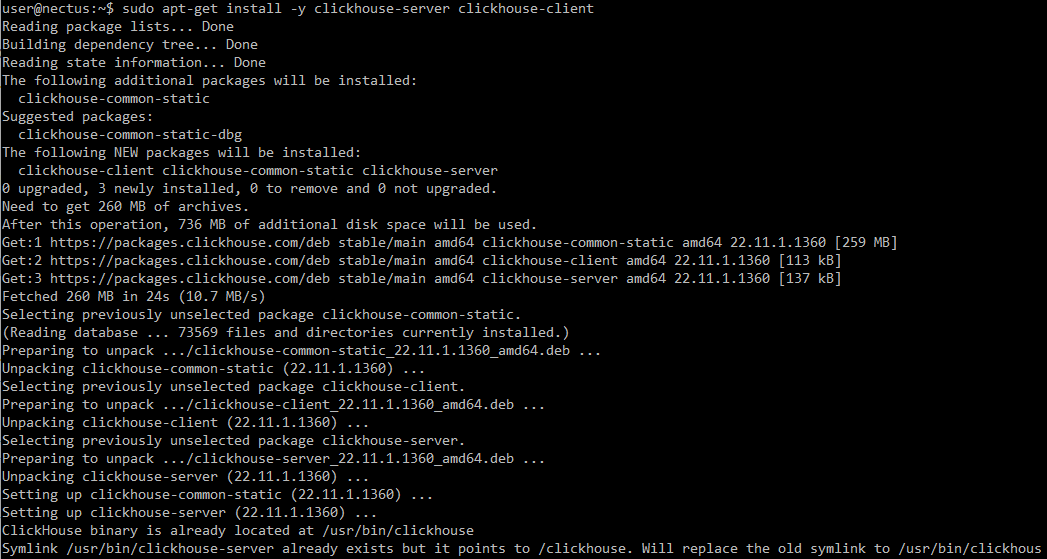
After downloading the package run the following installation command:
$ sudo apt-get install -y <package-name>
This will install Nectus monitoring agent on your target machine. If everything is OK you’ll see an output like this:
$ sudo apt install -y ./nectus-agent_1.4-3_amd64.deb
Reading package lists… Done
Building dependency tree… Done
Reading state information… Done
Note, selecting ‘nectus-agent’ instead of ‘./nectus-agent_1.4-3_amd64.deb’
The following NEW packages will be installed:
nectus-agent
0 upgraded, 1 newly installed, 0 to remove and 81 not upgraded.
Need to get 0 B/843 kB of archives.
After this operation, 2,654 kB of additional disk space will be used.
Get:1 /home/oleg/nectus-agent_1.4-3_amd64.deb nectus-agent amd64 1.4-3 [843 kB]
Selecting previously unselected package nectus-agent.
(Reading database … 278414 files and directories currently installed.)
Preparing to unpack …/nectus-agent_1.4-3_amd64.deb …
Unpacking nectus-agent (1.4-3) …
Setting up nectus-agent (1.4-3) …
Created symlink /etc/systemd/system/multi-user.target.wants/nectus-agent.service → /lib/systemd/system/nectus-agent.service.
Step 2b: Installation for RedHat, CentOS and Amazon Linux
After downloading the package run the following installation command:
$ sudo yum install -y <package-name>.rpm
You’ll see an output like this:
$ sudo yum install -y nectus-agent-1.4-3.el9.x86_64.rpm
Last metadata expiration check: 0:00:12 ago on Wed 27 Sep 2023 10:40:52 +07.
Dependencies resolved.
==================================================================================================================
Package Architecture Version Repository Size
==================================================================================================================
Installing:
nectus-agent x86_64 1.4-3.el9 @commandline 1.0 M
Transaction Summary
==================================================================================================================
Install 1 Package
Total size: 1.0 M
Installed size: 4.3 M
Downloading Packages:
Running transaction check
Transaction check succeeded.
Running transaction test
Transaction test succeeded.
Running transaction
Preparing : 1/1
Running scriptlet: nectus-agent-1.4-3.el9.x86_64 1/1
Installing : nectus-agent-1.4-3.el9.x86_64 1/1
Running scriptlet: nectus-agent-1.4-3.el9.x86_64 1/1
Verifying : nectus-agent-1.4-3.el9.x86_64 1/1
Installed:
nectus-agent-1.4-3.el9.x86_64
Complete!
Step 3: Configuration
After installation is complete you need to set up the agent’s basic configuration.
Nectus agent configuration file is located at: /etc/nectus/nectus-agent.conf.
Default configuration file content is listed in Appendix 1. Most of the values are set to defaults and don’t require a change except following two parameters:
- SERVER_PRESHARED_KEY
- AGENT_PORT
SERVER_PRESHARED_KEY is used to encrypt messages between the Agent and Nectus Server. Initially it’s set to value <YourSecretKey>.
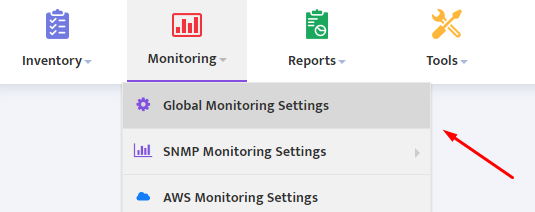
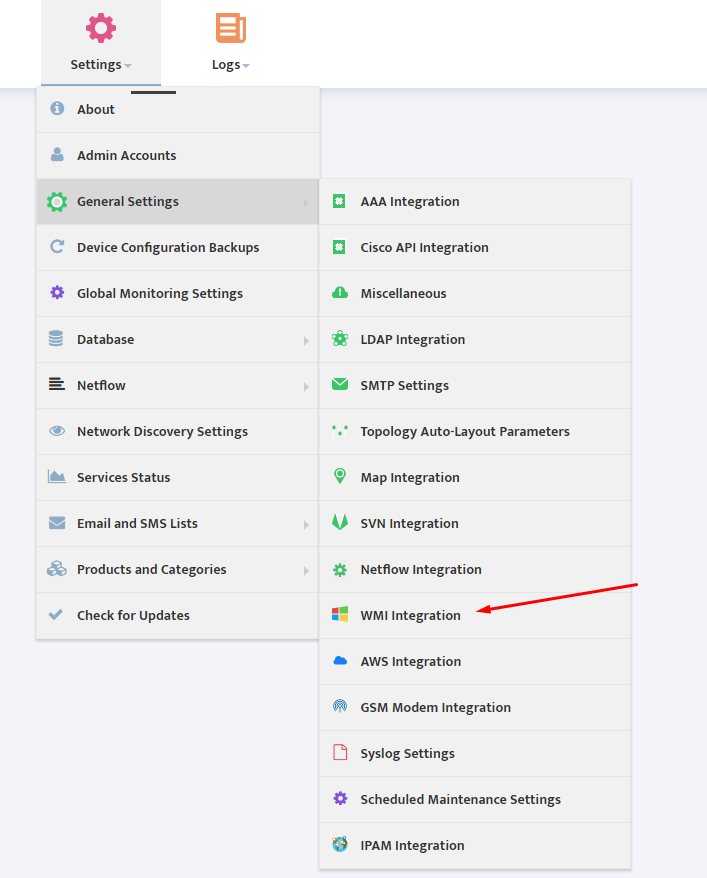
Edit this parameter to match the key configured in Nectus GUI (Settings->General Settings ->Linux Monitoring Integration).
SERVER_PRESHARED_KEY is a global parameters that is used for all Linux Servers.
AGENT_PORT parameter determines the TCP port used by Agent to listen for incoming connections from the Nectus server. By default the TCP port is set to 5400.
AGENT_PORT is Server specific parameter that can be different on each Linux Server.
Step 4: Generate SSL Certificate (optional)
The Linux Monitoring Agent listens on pre-configured TCP port for incoming HTTPS connection and needs an SSL certificate to operate.
Default location for storing certificate files is /etc/nectus but it’s configurable (parameter SSL_CERTIFICATE_DIR in the configuration file).
You can either use any existing certificate or generate a new self-signed one.
To generate new self-signed certificate run commands:
$ cd /etc/nectus
$ openssl dhparam -out dh.pem 2048
$ openssl req -newkey rsa:2048 -nodes -keyout key.pem -x509 -days 10000 -out certificate.pem
The directory pointed by SSL_CERTIFICATE_DIR parameter should finally contain files dh.pem, key.pem and certificate.pem.
Step 5: Open TCP port at the Firewall
If there is firewall between Nectus Server and Linux Monitoring Agent you need to permit connections on TCP port 5400 (Unless it is changed to a different port)
Make sure your Linux internal firewall also permits inbound connections on this port.
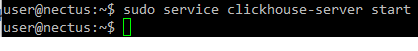
Step 6: Start Agent
Restart the agent in order for configuration changes to take effect:
$ service nectus-agent restart
Check it’s status to ensure proper operation:
$ service nectus-agent status
If case of successful start you’ll see some output like this:
$ service nectus-agent status
● nectus-agent.service – Nectus Agent
Loaded: loaded (/lib/systemd/system/nectus-agent.service; disabled; vendor preset: enabled)
Active: active (running) since Mon 2019-04-29 17:55:39 UTC; 4s ago
Process: 10247 ExecStart=/usr/bin/nectus-agent $CONFFILE (code=exited, status=0/SUCCESS)
Main PID: 10255 (nectus-agent)
Tasks: 2
Memory: 1.2M
CPU: 14ms
CGroup: /system.slice/nectus-agent.service
└─10255 /usr/bin/nectus-agent /etc/nectus/nectus-agent.conf
Apr 29 17:55:39 ubuntu-16 systemd[1]: Starting Nectus Agent…
Apr 29 17:55:39 ubuntu-16 systemd[1]: nectus-agent.service: PID file /run/nectus/nectus-agent.pid not readable
Apr 29 17:55:39 ubuntu-16 systemd[1]: Started Nectus Agent.
User account
For security reasons it’s not allowed to run Monitoring Agent as root user. If it’s trying to start as ‘root’ then the agent will drop its privileges to the user account set in configuration file
(usually /etc/nectus/nectus-agent.conf) as USER_INSTEAD_OF_ROOT.
Default USER_INSTEAD_OF_ROOT is ‘nectus’.
The agent automatically creates this user account during installation (if this user does not exist already) and provides minimal set of permissions required to run the agent code.
Troubleshooting
Nectus agent runs as a daemon process. You can use the following commands to start, stop restart and check status of the agent:
$ service nectus-agent start
$ service nectus-agent stop
$ service nectus-agent restart
$ service nectus-agent status
If there are any problems with starting the agent first check the agent’s status:
$ service nectus-agent status
Then check the log file (usually /var/log/nectus/nectus-agent.log). If it does not help then you can try to run the agent manually. Usage of the module:
nectus-agent <config-file> [-D]
config-file full path to configuration file
-D debug mode (agent starts not as a daemon but as a usual process)
Locate the executable nectus-agent in /usr/bin and try to run the agent not as a daemon:
$ /usr/bin/nectus-agent /etc/nectus/nectus-agent.conf -D
Check the output and log files at /var/log/nectus.
Upgrade
Upgrade to a new version of the agent is the same as a new installation: download the appropriate package and run either:
> sudo apt-get install -y <package-name>.deb
for Debian/Ubuntu systems or
> sudo yum install -y <package-name>.rpm
for RedHat/CentOS/Amazon Linux.
Uninstallation
To uninstall Nectus agent run the following command:
> sudo apt-get remove nectus-agent
for Debian/Ubuntu systems or
> sudo yum remove nectus-agent
for RedHat/CentOS/Amazon Linux.