Basic Nectus Monitoring

Multiple Alert Email Aggregation in Nectus

,

Multiple Alert Email Aggregation in Nectus

Very often during site level power or network outages or during network maintenance multiple devices become offline at the same time causing multiple individual DOWN Email alerts to be sent at the same time.

Depending in the size of the site it can be well over hundreds or even thousands alert emails to be sent out to corresponding e-mail recipients configured for given site.

Starting from version 1.2.52 Nectus offers an option to aggregate multiple DOWN or UP email alerts into a single multi-device alert notification containing a list of all devices that became DOWN or UP within last monitoring interval.

To enable Alert Aggregation, go to Monitoring -> Global Monitoring Settings: “Alert” Tab

And Select “Aggregate multiple UP/DOWN Alerts” Option.


Monitoring Cisco Power Supplies with SNMP

,

Monitoring Cisco Power Supplies with SNMP

Cisco Power Supply

Cisco Power Supply

Step 1. Determine which SNMP OID to use

Very first step before you can start monitoring power supply status is to determine which SNMP OID is supported by specific router or switch type you want to monitor.

The main challenge here is that there is no consensus among manufacturers on specific SNMP OID and even within Cisco products OID can be different on different product lines.

Let’s take Cisco Catalyst 3750 series switches as an example.

For all Cisco 3700 series switches SNMP OID that contain power supply status is .1.3.6.1.4.1.9.9.13.1.5.1.3 (ciscoEnvMonSupplyState) from CISCO-ENVMON-MIB

Cisco TAC is usually a good resource to confirm which OID can be used for different Cisco product lines.


Step 2. Obtain Power Supply Index Values

Next step is to perform SNMP GET BULK or SNMP Walk query for selected OID (.1.3.6.1.4.1.9.9.13.1.5.1.3) against one of the switches that you planning to monitor to determine how many power supplies this specific switch model has and what are the index values for each power supply.

Sample GET Bulk Response from Cisco Catalyst 3750:

‘1.3.6.1.4.1.9.9.13.1.5.1.3.[1034]’ => “1”

‘1.3.6.1.4.1.9.9.13.1.5.1.3.[2034]’ => “1”

In this SNMP GET-BULK response we see that switch has two power supplies with indexes: 1034 and 2034.


Step 3. Obtain list of Status Values for SNMP OID

Last step before we can start monitoring power supply is to consult MIB for possible values that this specific OID can report for power supply status.

For SNMP OID 1.3.6.1.4.1.9.9.13.1.5.1.3 there are 6 possible status codes:

Normal (1), Warning (2), Critical (3), Shutdown (4), Not Present (5), Not Functioning (6)


Step 4. Create Custom SNMP Tracker for Each Power Supply

Now we are ready to create custom SNMP trackers for each of the power supplies.

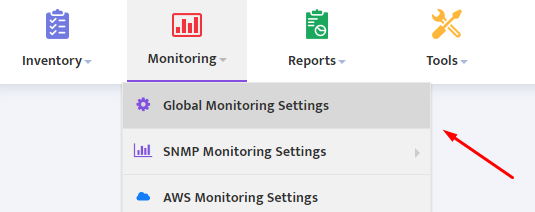
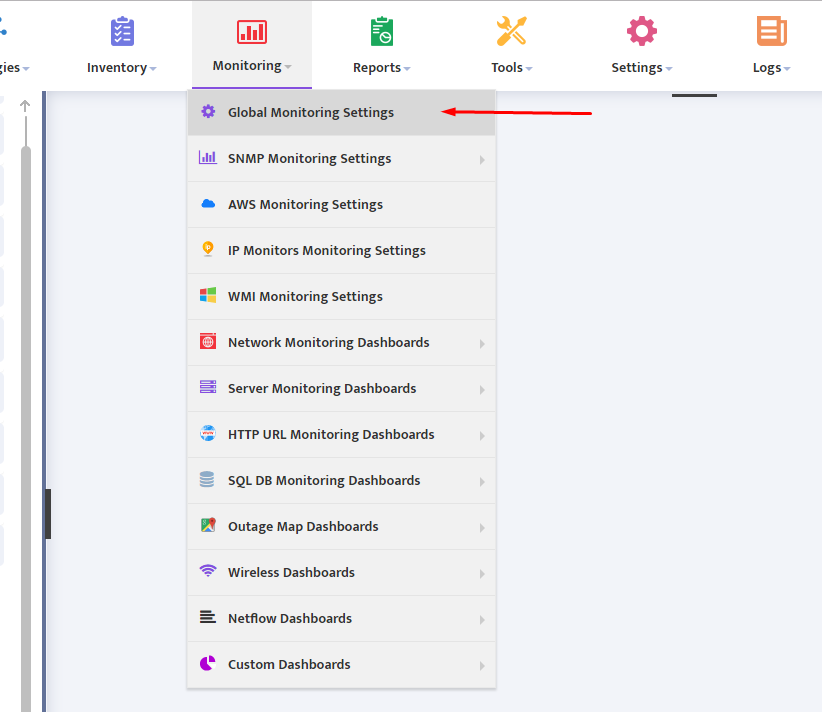
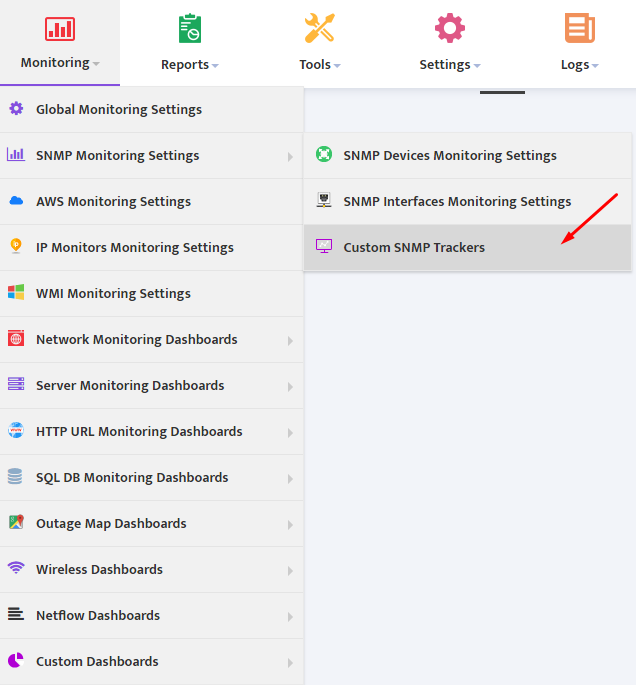
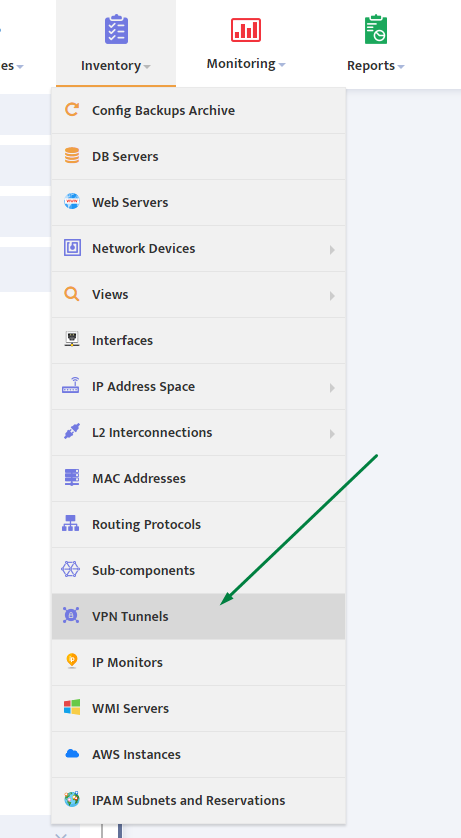
In Nectus GUI go to Monitoring → SNMP Monitoring Settings → Custom SNMP Trackers

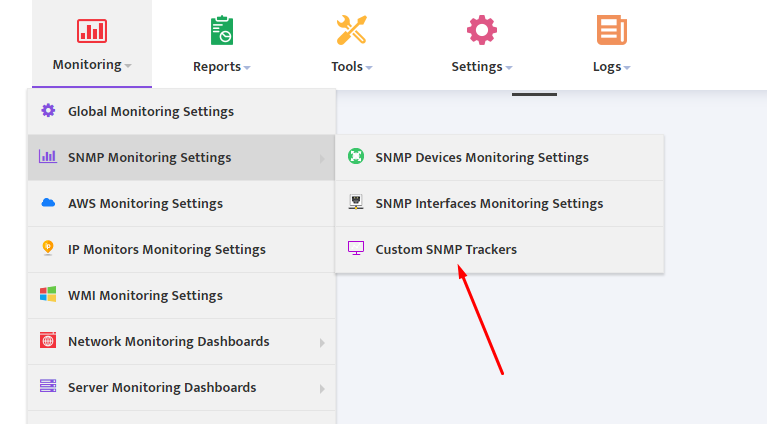
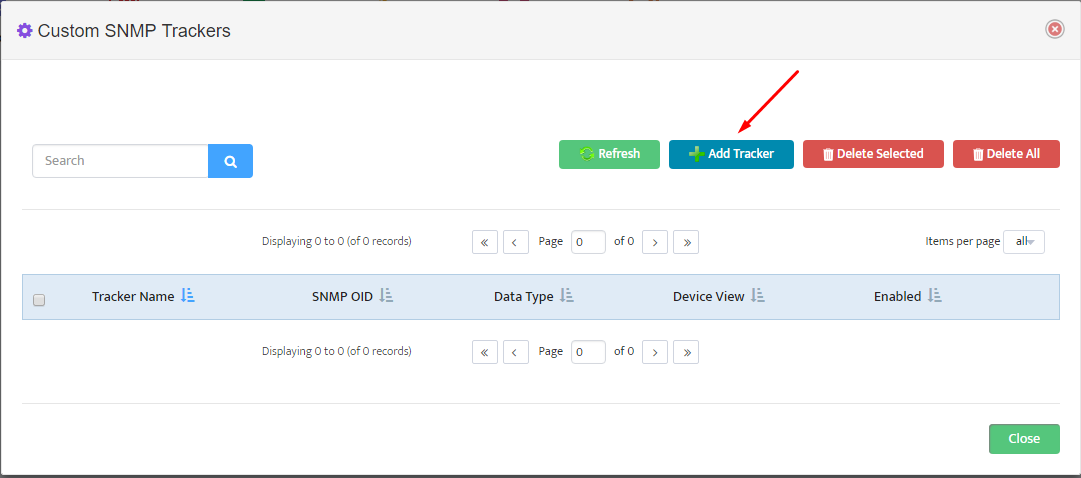
Press “Create” button to bring up Custom SNMP Tracer creation interface.

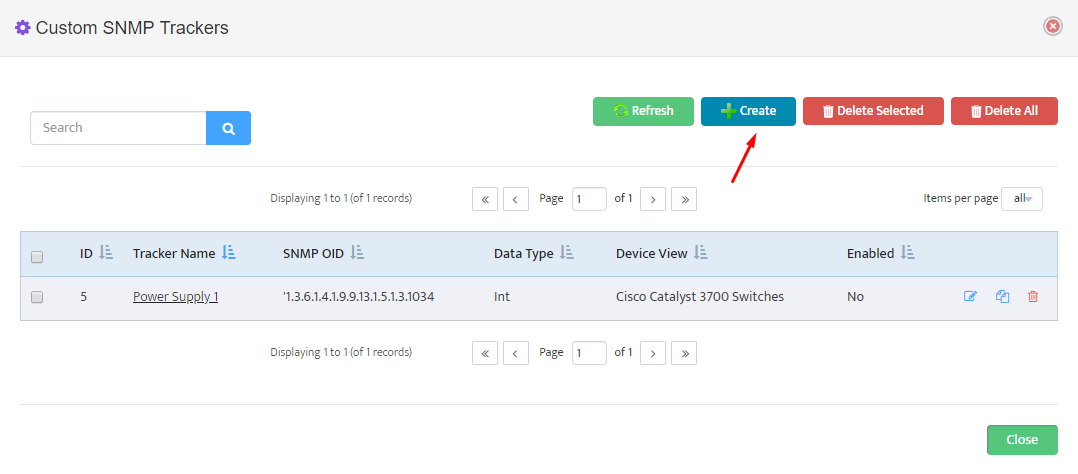
We will have to create two separate trackers, one for each power supply.

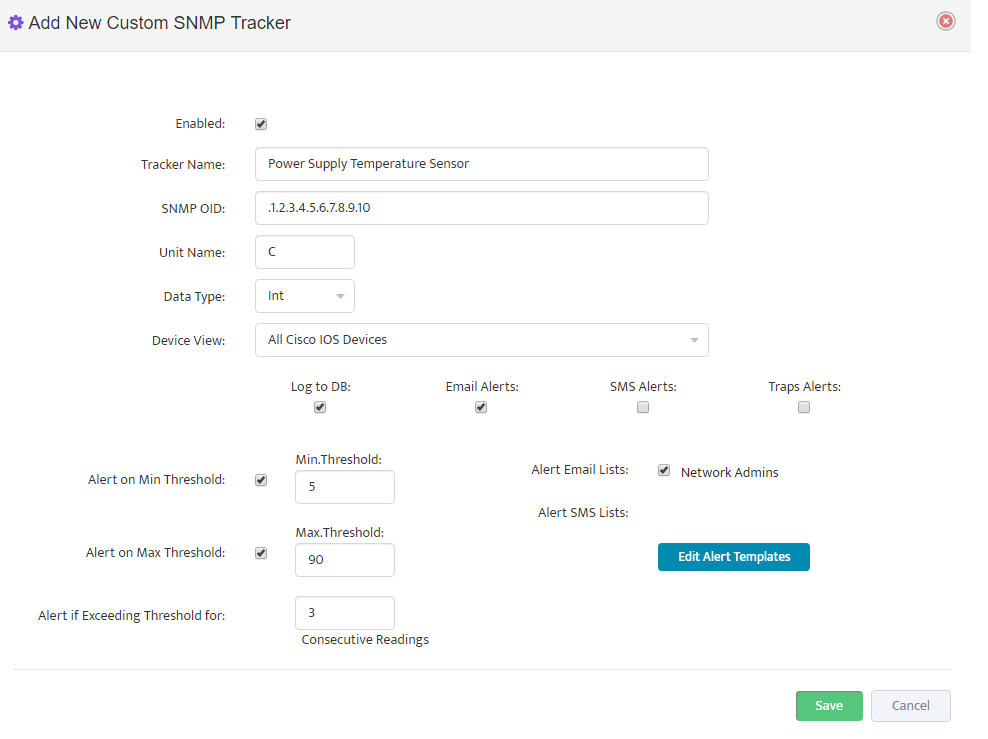
Complete tracker “General” settings Tab according to this

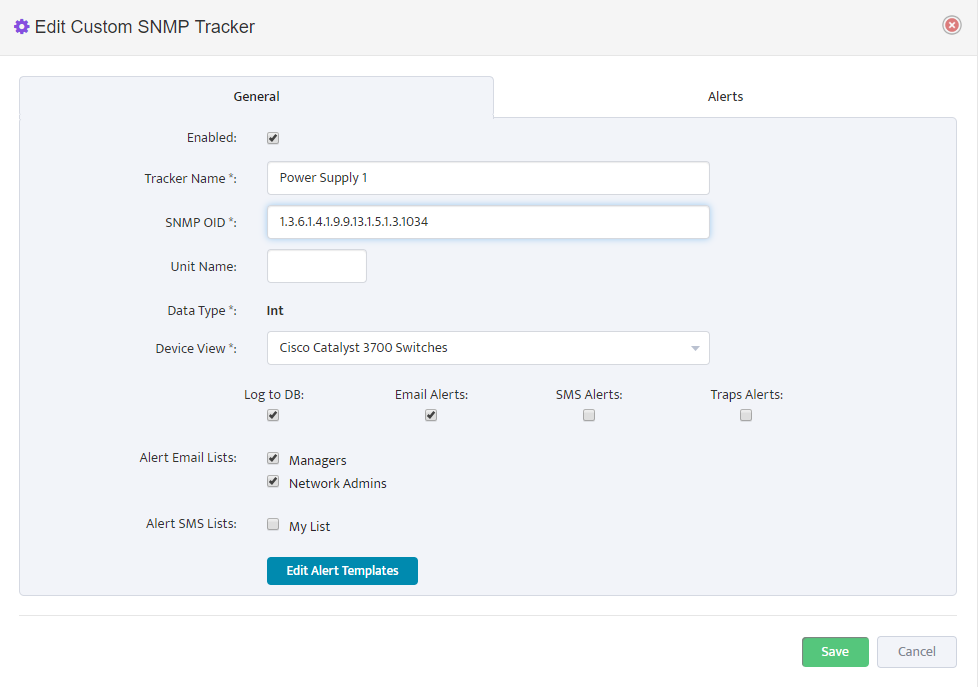
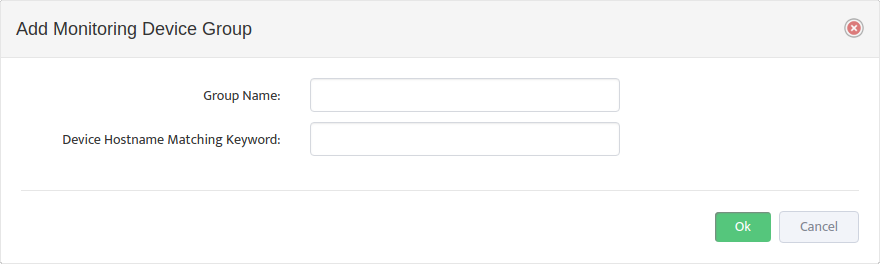
Note that for this tracker we created a device view called “Cisco Catalyst 3700 Switches” that contain all Cisco Catalyst 3700 Series switches that we want to monitor with this tracker.

If you want to enable Power supply monitoring for more switches later, you just need to add new switches to this Device View.

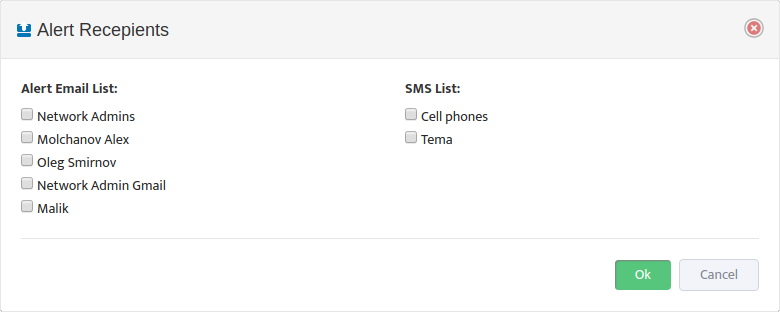
Select which email lists will be used as email Alert recipients.

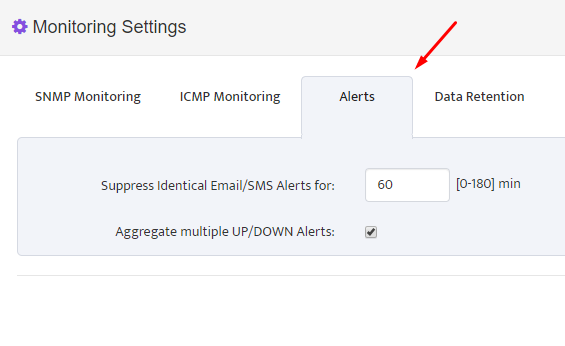
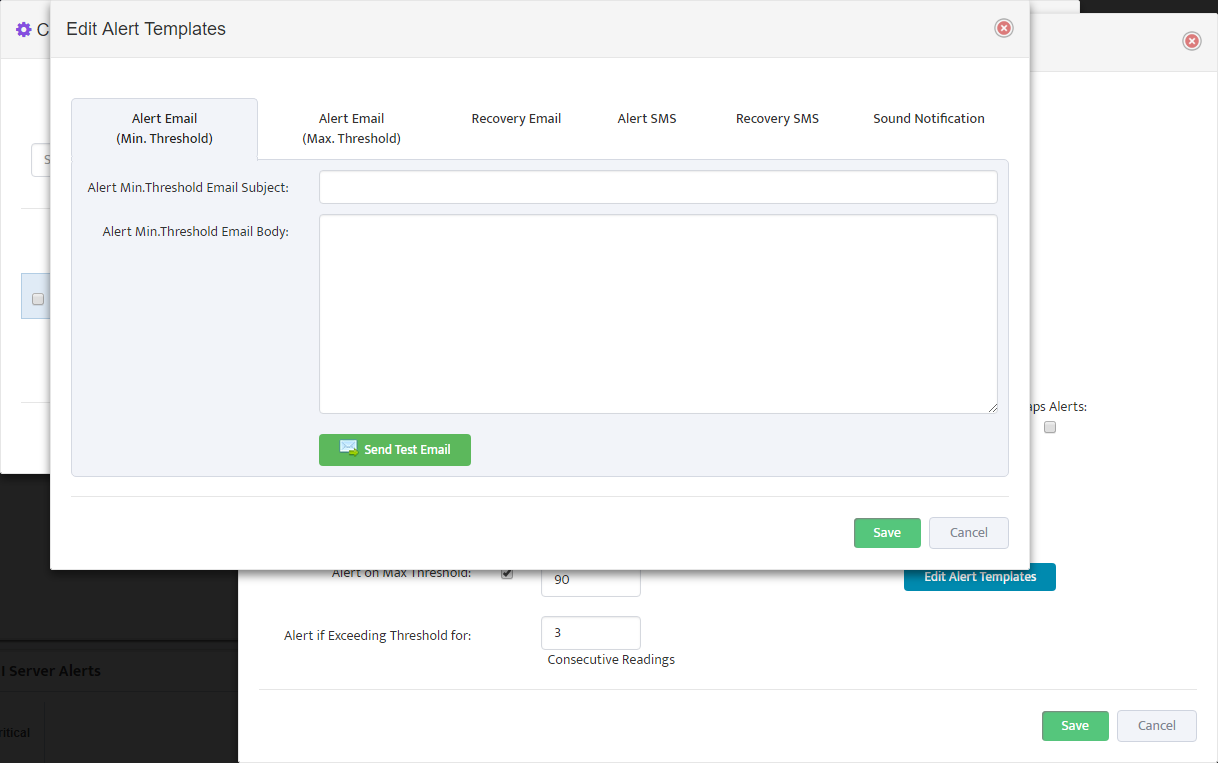
In “Alerts” Tab we need to specify which status values will be considered Normal and which values should trigger Alerts. You can specify multiple values separated by comma.

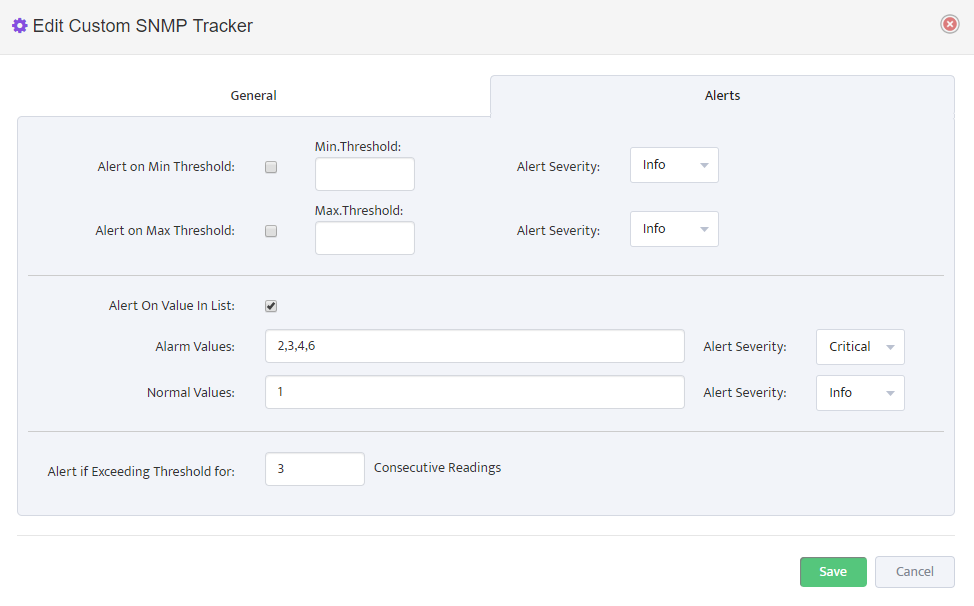
Define an Alert Severity level for Alarm Values as Informational, Warning or Critical.

Define number of consecutive readings for which power supply status has to report an Alarm condition before formal Alert is created. Nectus performs one SNMP poll per 5 min.

So if you define value for consecutive readings as 3 it should result in Alert created after 15 minutes of True Alarm conditions.

Press “Save” to complete Custom SNMP tracker creation for Power Supply 1.

Repeat the same process for Power Supply 2.

Now you have created custom trackers that will be monitoring both power supplies on all Cisco Catalyst 3700 Switches in your network.


Suppressing excessive E-mail alerts during site level network outages

,

When whole site power outage or network maintenance is in progress it is default behavior for Nectus to send individual DOWN alerts for each device in that site possibly resulting in hundreds of DOWN e-mail alerts followed by the same amount of UP e-mail alerts sent out to all configured alert recipients.

In version 1.2.53 Nectus introduced a feature that allows user to reduce number of alert e-mails during site level network outages to only specifically designated devices called “Gateways”

For each site user can designate some of the devices as “Gateways” and following alert rules will be applied:

  1. If all the Gateways in given site are DOWN, Nectus will not send DOWN alerts for regular devices located in the same site.
  2. If at least one Gateway in given site is still UP then Nectus will send individual DOWN alerts for all of the devices detected as DOWN.
  3. If all the Gateways in given site recovered from DOWN to UP, Nectus will not send UP alerts for regular devices located in the same site.
  4. If at least one Gateway in given site is still DOWN then Nectus will send individual UP alerts for all of the devices detected as UP.

To configure Site Gateways right click on Site and select Properties

Press “Site Gateways” Button

Select devices that you want to be gateways for given site and press Save button


Using Custom SNMP Trackers in Nectus

,

Using Custom SNMP Trackers in Nectus

Nectus offers extensive SNMP based network monitoring capabilities that allow users to track any metrics accessible via SNMP.

In addition to standard metrics, such as CPU, RAM or TCAM utilization, Nectus offers a new feature called “Custom SNMP Tracker” that allows you to monitor virtually any metrics accessible via SNMP.

This article will guide you through the basic steps required for setting up custom SNMP trackers in Nectus.

In the Main Menu, go to Monitoring → SNMP Monitoring Settings → Custom SNMP Trackers.

This opens a “Custom SNMP Trackers” window. To create a new custom SNMP Tracker, click the Add Tracker button.

In the “Add New Custom SNMP Tracker” interface box that appears, specify the following parameters:

  1. Tracker name (Example: “Power Supply Temperature Sensor”)
  2. SNMP OID to be used with “SNMP GET” request for Data
  3. Unit Name (Example: C for Temperature)
  4. Data Type (Integer or Floating)
  5. The Device View that contains list of devices to be used for collecting data from
  6. Select “Log to DB” if you would like to save metrics values to a database every 5 minutes
  7. Select “Email Alerts” if you would like to be alerted when metrics exceeds pre-defined thresholds
  8. Min and Max Threshold Values
  9. Select the number of “Consecutive Readings” exceeding threshold that would trigger an alert
  10. Select one of the existing email lists/groups to receive the alerts (Example: “Network Admins”).
  11. Click Edit Alert Templates to fully customize the alert email for the metric

Customize the E-mail template for Alert and for Recovery event when Metric value returns to normal range.

You have now created your first custom SNMP tracker. To create additional trackers, use “Clone” feature to create and edit a copy of an existing tracker available from the “Custom SNMP Trackers” page.


Monitoring Cisco IPSec VPN Tunnels with Nectus

,

Monitoring Cisco IPSec VPN Tunnels with Nectus

One of the key features introduced in Nectus 1.2.51 is ability to automatically discover and monitor Cisco IPSec VPN Tunnels terminated on ASA Firewalls and regular IOS routers.

  1. Tunnel Discovery

As part of regular scheduled network discovery Nectus attempts to detect existing VPN tunnels on all routers and firewalls by polling standard SNMP MIB: CISCO-IPSEC-FLOW-MONITOR-MIB

reserved for VPN Tunnels.

All discovered VPN tunnels can be seen in Main menu: Inventory → VPN Tunnels


All discovered tunnels displayed as a table with Terminating Device, Group, Local and Remote IP Address visible in individual columns.

You can assign a human friendly name to each tunnel by pressing Tunnel Edit button on the right.


  1. Creating Groups and Assigning Tunnels to Groups

Each Tunnel must be assigned to an individual group with newly discovered Tunnels being automatically assigned to a group with “Default” parameter set to On.

User can create multiple different groups and group tunnels in any way that is appropriate.

User can change Tunnel-to-Group assignment by using context menu or by using “Edit VPN Tunnel” button.


  1. Enabling Tunnel Monitoring

Once all Tunnels are discovered and added to a correct group you can enable monitoring on group level by setting “Enable Monitoring” check-button to “ON”


After “Enable Monitoring” flag is set to ON, Nectus starts checking Tunnel’s status every 5 min and creating records in Alert log along with sending Alert emails in case if Tunnel is down.


Real Time status for all tunnels can be seen in left side panel “VPN Tunnel”

By using right-click on Tunnel’s name you can access rich context menu where you can move tunnels to a different group, delete Tunnel, change Tunnel’s name or

View Tunnel’s Phase 1 and Phase 2 Information.


“View Tunnel Info” provides low level Phase 1


And Phase 2 Information along with encryption domain parameters and traffic counters


SNMP Device Status Color Codes

,

SNMP Device Status Color Codes

Nectus uses different colors to encode SNMP Device Status in Dashboards, Trees and Status Panels. There are three main color codes: Green, Red and Orange.

Green Color represent SNMP Device status when it is reachable by ICMP Probe and don’t have any critical interfaces Down.

Red Color represent SNMP Device status when it is not responding to ICMP Probe.

Orange Color represent SNMP Device that is reachable via ICMP but has at least one critical Interface down.

You can designate any Interface as critical by following these steps:

  1. Create Interface View that will contain all the Critical Interfaces
  2. Select this Interface View in Global Monitoring Settings

Critical Interfaces are marked by special “Star” icon in Interface List View

You can quickly add/remove Interface to Critical List by using Interface Context menu Option


List of system variables that can be used in Alert emails for SNMP Devices and Interfaces

,

List of system variables that can be used in Alert emails for SNMP Devices and Interfaces  (Version 2.48,  January 2019).

More system variables will be added in next releases.


Device Hostname:                %dev_hostname%
Device IPv4 Address:          %dev_ipv4_address%
Device IPv6 Address:          %dev_ipv6_address%
Device CPU Utilization:      %dev_cpu_utilization%
Device RAM Utilization:     %dev_ram_utilization%

Interface Name:                     %interface_name%
Interface Description:          %interface_description%
Interface Rx Utilization:      %interface_rx_utilization%
Interface Tx Utilization:       %interface_tx_utilization%

Device Site:       %dev_site_name%
Alert Time:        %time%

Outage Duration:      %outage_duration%

Enabling Monitoring for SNMP Interfaces

,

Enabling Monitoring for SNMP Interfaces

In this chapter, you’ll learn how to enable monitoring and create monitoring groups for SNMP Interfaces.

The specific topics we will cover in this chapter are:

  1. Automatic Discovery and Grouping of SNMP Interfaces
  2. Creating and Activating Monitoring Groups
  3. Creating and Customizing Monitoring Profiles
  4. Customizing Alerts
  5. Placing Interfaces in Monitoring Groups

1. Automatic Discovery and Grouping of SNMP Interfaces

During the Discovery phase all network Interfaces are automatically added to the group called “No Monitoring Group.” This group has all monitoring functionality disabled and serves as a parking space for all unmonitored Interfaces.

To enable monitoring for a particular Interface you must move that interface from the “No Monitoring Group” to any group that has the monitoring checkbox set to “ON” and has a Monitoring Profile assigned.

2. Creating and Activating Monitoring Groups

To create and activate SNMP Interface Monitoring Groups go to the Nectus Home Screen and select Monitoring -> SNMP Monitoring Groups -> Interface Monitoring Groups.

This opens the “Interface Monitoring Groups” dialog box.

Nectus provides you with two predefined Monitoring Groups:

  • No Monitoring Group – Interfaces in this group are not being monitored.
  • Default Monitoring Group – Interfaces in this group are monitored by Nectus.

Click the Add Group button to open the “Add Monitoring Interface Group” dialog box and create an additional Monitoring Group.

To monitor a group, check its Enable Monitoring box in the “Interface Monitoring Groups” dialog box.

Next select the Monitoring Profile you want to use for the Group. See the next section for more information on Monitoring Profiles.

Then click the Edit Alert Recipients icon to open the “Alert Recipients” dialog box and select lists that specify who will receive alerts from this particular Monitoring Group and Profile.

3. Creating and Customizing Monitoring Profiles

Each Monitoring Group must have a Monitoring Profile that determines which parameters are monitored. You can customize each Profile, and create individual Profiles for each Monitoring Group.

To create a new Profile, go to the Nectus Home Screen and select Monitoring -> SNMP Monitoring Profiles -> Profiles – SNMP Interface Monitoring. This opens the “Interface Monitoring Profiles” dialog box. Click the Add Profile button to create a new Profile.

To edit a Profile click the Edit icon to the right of the Monitoring Profile for the Group. This opens the “Edit Device Monitoring Profile” dialog box.

Some of the parameters here allow you to set Threshold values or other customizations.

Set the Enabled checkbox next to each Parameter you want to monitor. Check any of the Log to DB, Email Alerts, SMS Alerts, or Traps Alerts boxes to send those types of alerts.

4. Customizing Alerts

To customize the alerts, click the Edit Alert Templates button to open the “Edit Alert Handler” dialog box.

If you select Email Alerts or SMS Alerts, Nectus will generate Alert messages when the Monitored Parameter exceeds threshold and Recovery messages when the Parameter returns to normal.

Selecting the tab for one of these messages allows you to customize the appearance of that message.

5. Placing Interfaces in Monitoring Groups

Once you have created the Monitoring Groups you want to use you need to place Interfaces in them. To do so, click the Monitoring Group Name to open the “Edit Monitoring Interface Group” dialog box.

Select the Group you want to add Interfaces to on the left, and the Group you want to take them from on the right. Use the arrows to move Interfaces between the two Interface Groups.

Note that if you move an Interface that is currently being monitoring into the No Monitoring Group, Nectus will immediately stop monitoring that Interface. This can be useful for situations where you know an Interface will be down for some time (extended maintenance, for example) and you don’t want the system to send alerts.

Enabling Monitoring for SNMP devices

Enabling Monitoring for SNMP Devices

In this chapter, you’ll learn how to enable monitoring and create monitoring groups for SNMP Devices.

The specific topics we will cover in this chapter are:

  1. Automatic Discovery and Grouping of SNMP Devices
  2. Creating and Activating Monitoring Groups
  3. Creating and Customizing Monitoring Profiles
  4. Customizing Alerts
  5. Placing Devices in Monitoring Groups

1. Automatic Discovery and Grouping of SNMP Devices

Nectus automatically discovers all live SNMP Devices. These devices are listed in the SNMP Devices Panel on the Home Screen. While Devices are detected automatically, they are not automatically monitored. New SNMP Devices are automatically added to the default “No Monitoring” Group.

To Enable monitoring for a Device you need to move it from “No Monitoring” group to any

of the group where monitoring is enabled.

2. Creating and Activating Monitoring Groups

To create and activate SNMP Device Monitoring Groups go to the Nectus Home Screen and select Monitoring -> SNMP Monitoring Groups -> Device Monitoring Groups.

This opens the “Device Monitoring Groups” dialog.

Nectus provides you with two predefined Monitoring Groups:

  • No Monitoring Group – Devices in this group are not monitored, and appear with a grey icon in the SNMP Devices Panel.
  • Default Monitoring Group – Devices in this group are monitored by Nectus. Their icons are either green or red, reflecting the state of the Device.

Click the Add Group button to open the Add Monitoring Device Group dialog and create an additional Monitoring Group.

To monitor a group, check its Enable Monitoring box in the Device Monitoring Groups dialog box.

Next select the Monitoring Profile you want to use for the Group. See the next section for more information on Monitoring Profiles.

Next click the Edit Alert Recipients icon to open the Alert Recipients dialog box and select lists that specify who will receive alerts from this particular Monitoring Group and Profile.

3. Creating and Customizing Monitoring Profiles

Each Monitoring Group must have a Device Monitoring Profile that determines which parameters are monitored. You can customize this Profile, and create additional Profiles for each Monitoring Group.

To edit the default Profile or create a new one, click the Edit icon to the left of the Monitoring Profile for the Group. This opens the Edit Device Monitoring Profile dialog box.

Each of the four tabs in this dialog contains parameters you can monitor. Many of the parameters allow you to set Threshold values or other customizations.

Set the Enabled checkbox next to each Parameter you want to monitor. Check any of the Log to DB, Email Alerts, SMS Alerts, or Traps Alerts boxes to send those types of alerts.

4. Customizing Alerts

To customize the alerts, click the Edit Alert Templates button to open the Edit Alert Handler dialog box.

If you select Email Alerts or SMS Alerts, Nectus will generate Alert messages when the Parameter goes out of bounds and Recovery messages when the Parameter returns to normal.

Selecting the tab for one of these messages allows you to customize the appearance of that message.

5. Placing Devices in Monitoring Groups

Once you have created the Monitoring Groups you want to use you need to place Devices in them. To do so, click the Monitoring Group Name to open the Edit Monitoring Device Group dialog box.

Select the Group you want to add Devices to on the left, and the Group you want to take them from on the right. Use the arrows to move Devices between the two Device Groups.

Note that if you move a Device that is currently being monitoring into the No Monitoring Group, Nectus will immediately stop monitoring that Device. This can be useful for situations where you know a device will be down for some time (extended maintenance, for example) and you don’t want the system to send alerts.

Working with SNMP Traps in Nectus NMS

, ,

One of the key features of Nectus is ability receive SNMP traps.  This allows the operator to quickly detect physical (links failures, flaps) or logical (adjacencies failures, flaps) changes in the network followed by restoration procedures or root cause analysis.
Let’s see how does it work on example of this Layer 2 diagram:

The SNMP traps are located in top menu “Logs” -> “SNMP traps and Syslog”.

More exactly here:

Once the devices starts sending SNMP traps, they appears withing 2-3 minutes in Nectus:

At the time of the writing, the new SNMP traps decoding is added manually by the Nectus support team, but in the future the operator will have the ability to add the traps decoding with no external assistance.
All these traps were sent by R1 and R2 when GigabitEthernet0/1 on R1 was shut down. Because OSPF was running between R1 and R2, disabling the interface lead to OSPF adjacency between the two routers to go down.
As you can see, some OIDs are represented their original format, whereas some OIDs are represented in a more human readable format.
The details of a trap might look like this:

With the above trap details, you can tell that this is “link down” trap.
However, with other traps, you might need additional knowledge to figure what they represent.
Let’s take another example of detailed trap:

This trap was sent by R1 and it is a neighbor state change(.1.3.6.1.2.1.14.16.2.2):

And it can be read like this: Router-ID 192.168.0.2(.1.3.6.1.2.1.14.1.1) declared neighbor 192.168.0.3(.1.3.6.1.2.1.14.10.1.3) with IP address on the interface 10.0.0.14(.1.3.6.1.2.1.14.10.1.1) as Down(.1.3.6.1.2.1.14.10.1.6 with value of 1).
Obviously this is not very intuitive and Nectus should do all the the decoding so that the operator will not go through all the effort to find what each OID means.

In the future releases user will have an option  to add the decoding for new or unknown SNMP traps via GUI.


Network Discovery timers vs Network Monitoring timers

, ,

One of the first steps that we normally perform during POC is timer tuning for ICMP and SNMP for Discovery and Monitoring services.

Normally Discovery should have different timer values than Monitoring because Discovery operates in a “pessimistic” model when IP address

that is being probed by Discovery engine is likely not to be alive or  not to respond to SNMP therefore timeoute values and retry counts has to be very aggressive

for example 100 ms Timeoute with 2 Retries  for ICMP is normally sufficient. SNMP timer for Discovery have typical values of 1000ms and 1 retry.

Aggressive Discovery timers also reduces amount of traffic being generated and make discovery jobs run faster.


Monitoring Service timers are in opposite spectrum,  as Monitoring service operate in “optimistic” mode where it expects for all devices that are enabled for monitoring

to respond and timers has to be tuned to maximum wait time with ICMP timers as high as 300ms and SNMP timers as high as 5000 ms to support bigger/busier devices like Nexus 7018.