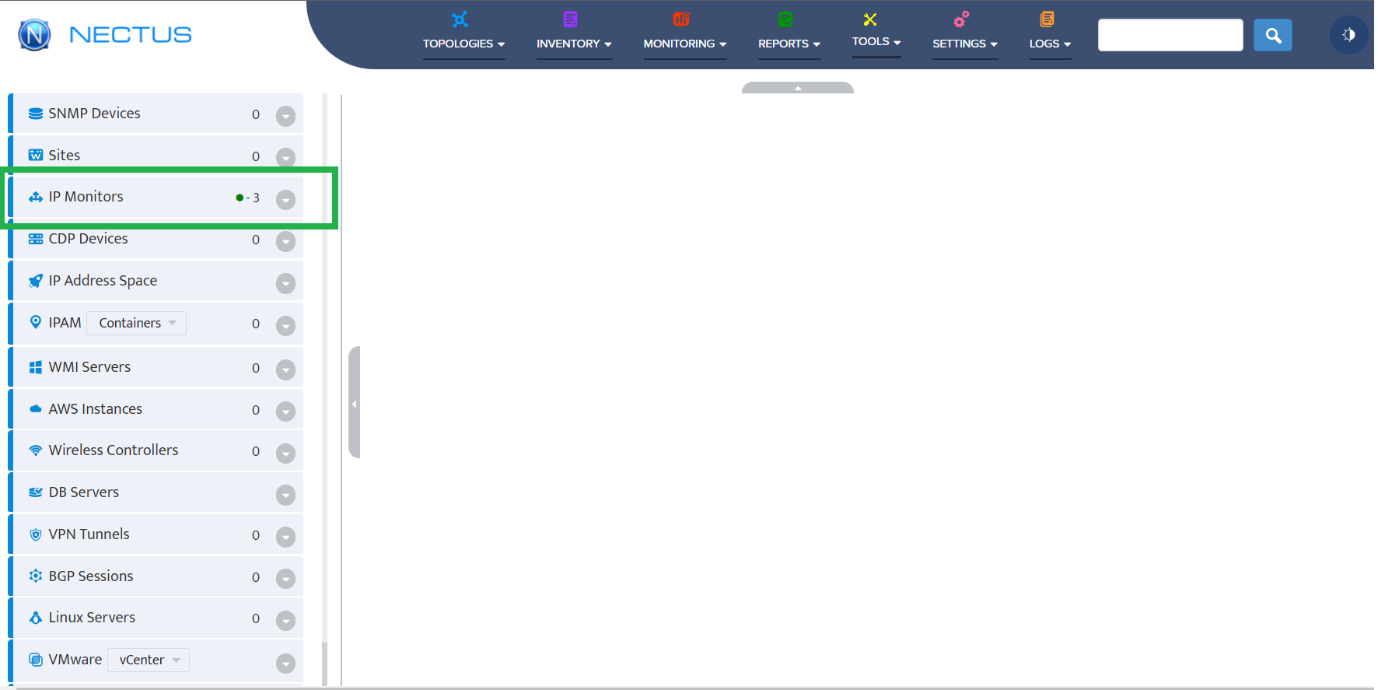
Step 1: Login to Nectus portal. Then, click on IP Monitors.
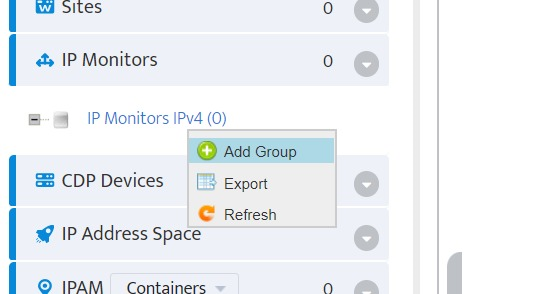
Step 2: Right Click on IP Monitors and select Add Group to create a new monitoring group.
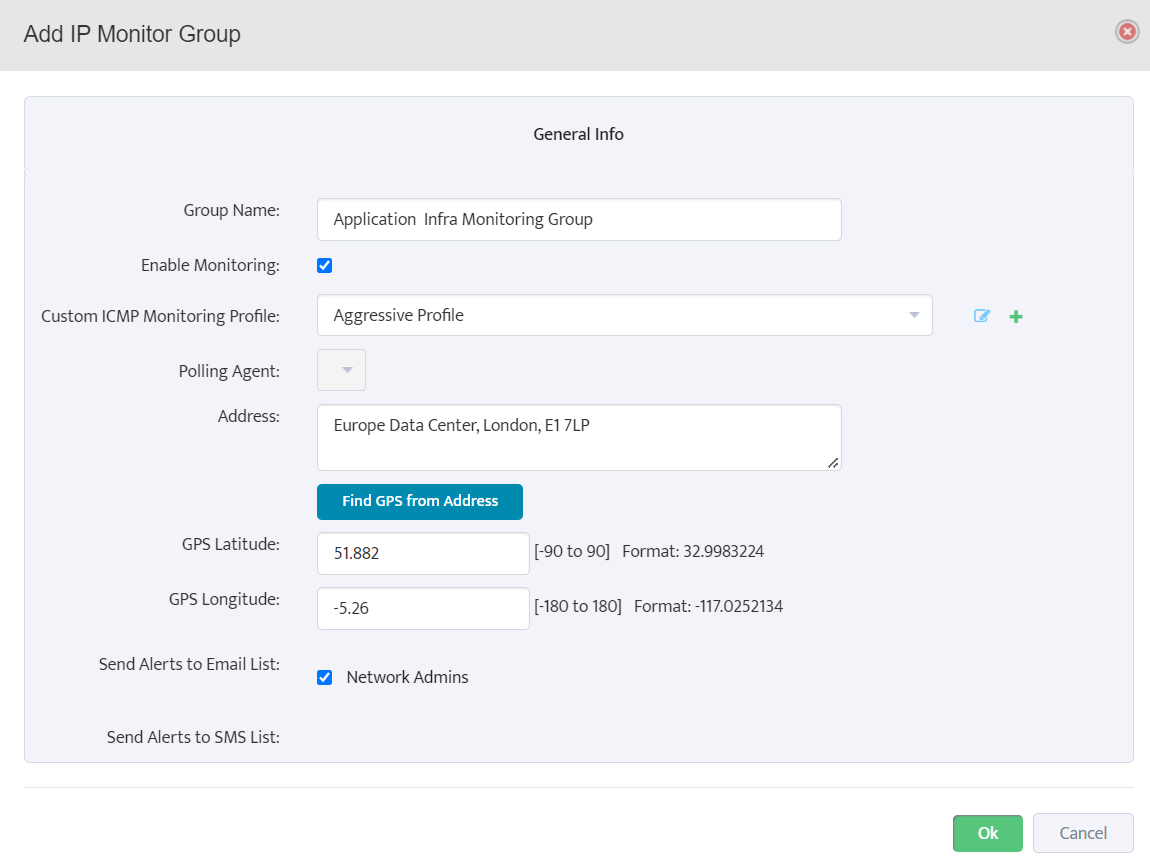
Step 3: Provide a unique name to the group and check the “Enable monitoring” option.
If monitoring requires custom ICMP monitoring timers then select optional Custom ICMP Monitoring Profile.
Choose the appropriate Polling Agent (Default is Main Polling Agent) and provide optional physical address.
Click on Ok to create a new IP monitor group.
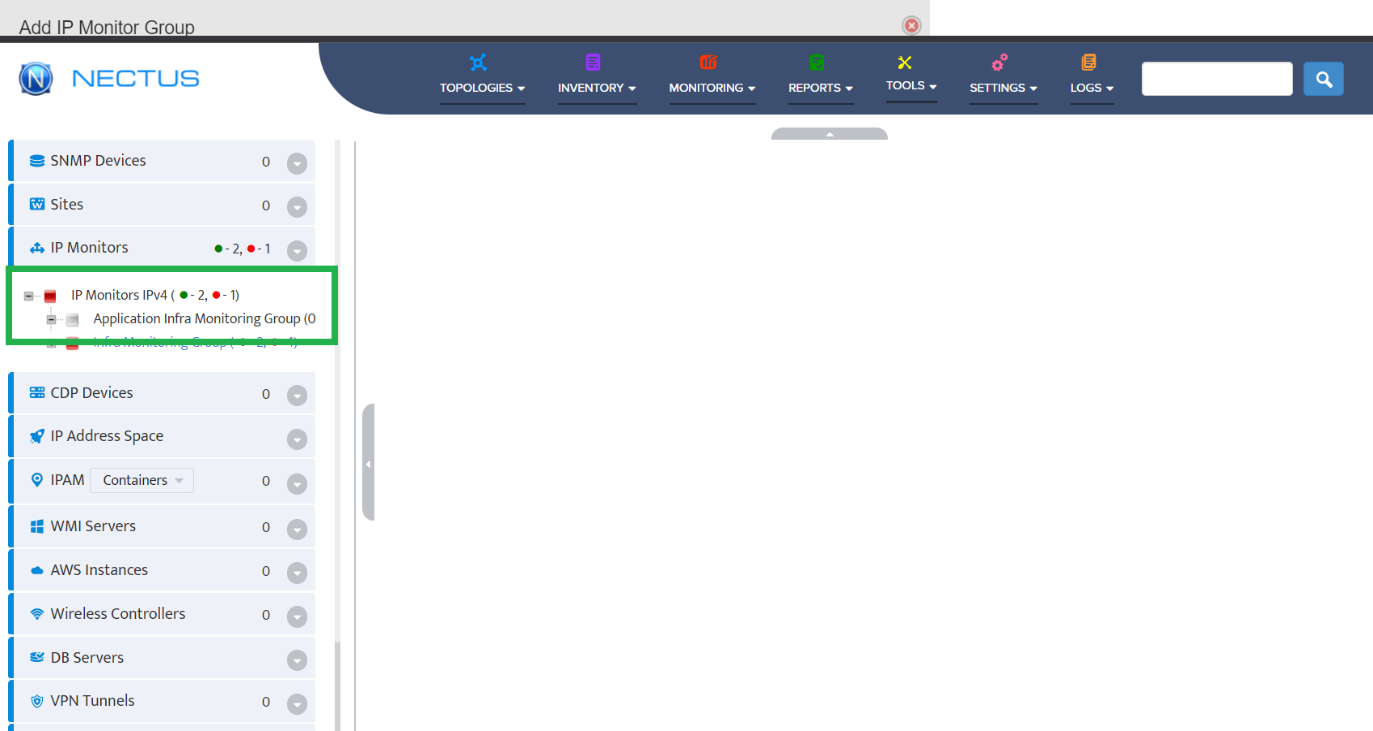
Step 4: Now, the new group gets added under IP Monitors. The square icon indicates the status and since no device is added in the group, it’s shown in grey color.
Step 5: Right click on the IP Monitor Group to add a new IP Monitor into the group.
Step 6: Under the General Info Tab, provide a valid IP, name and optional physical address.
Then, click on Ok button to Add IP Monitor.
Step 7: To test the reachabilty of IP Monitor, we can use Ping this IPv4 Monitor option. It performs a live ICMP ping test to the IP Monitor.
Step 8: It also provides the options to repeat the test and continue ping tests.
Step 9: To get the current device monitoring information, go to View IPv4 Monitor Info.
Step 10: The General Info provides the basic details about the device.
Alerts tab contains all the monitoring alerts. All alerts can be exported in *.csv format for further drill down. Click on eye icon in each row to get more information about the alert.
Step 11: Right click on the device and Graphs to get a plot based on UP/DOWN state, latencies etc.
Step 12: We can share the polled data from Nectus in several ways.
Step 13: We can share the access to graph using Generate Direct Access URL.
Step 14: Further, we can also export all data points in a *.csv form using Export All option.
Step 15: We can select multiple devices using CTRL + Left Click. Right click on any one to get the available options.

Step 16: Select the Graphs option to obtain the consolidated view of the plots for the selected devices.
Step 17: To edit the added devices, right click on the device and choose properties.
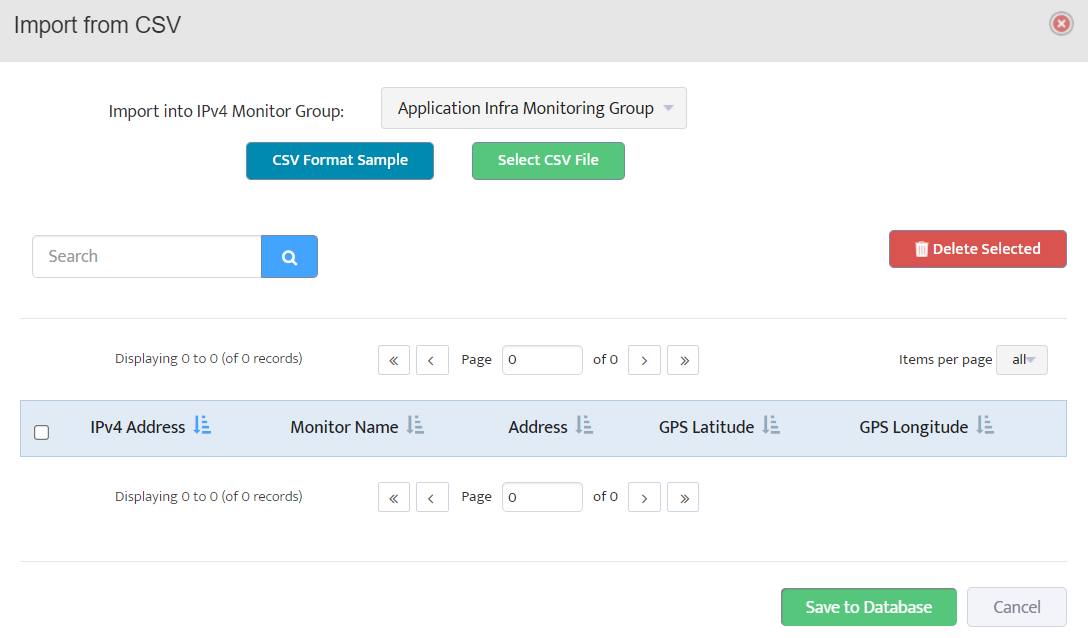
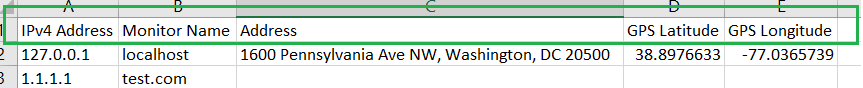
Step 18: Bulk import through a *.csv file can be performed and sample file can be downloaded from Import from CSV modal for quick reference.
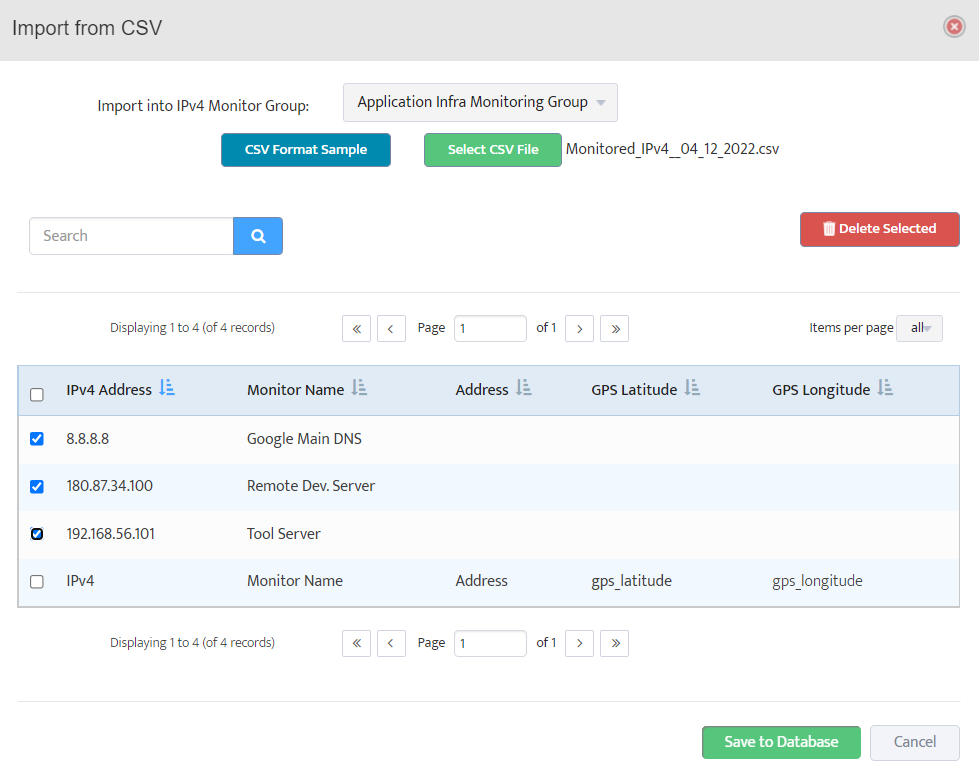
Step 19: Post the data import completion, skim through the device information, and select them to save into the database for the monitoring.
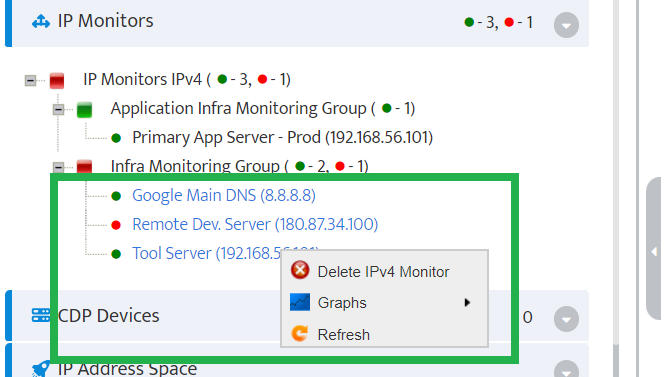
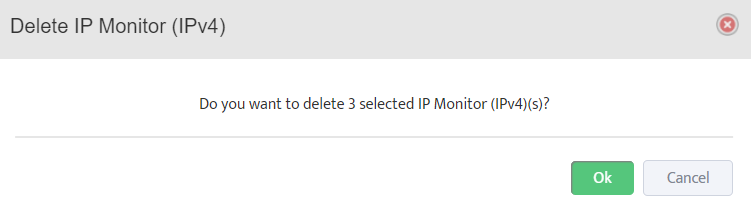
Step 20: Additionally, we can select Delete IPv4 Monitor to delete the devices from monitoring.
Congrats! We have successfully explored the lifecycle management of devices for ICMP monitoring using IP Monitor.
How to Control Logging in Nectus via .ini Files
Nectus Installation, Technical NotesHow to Control Logging in Nectus via .ini Files
If there is a need to reduce amount of disk space Nectus Logs take you can adjust logging verbosity or disable logging completely for each Nectus Service.
Logging settings for each service is controlled by .INI files located in C:\Program Files\Nectus\
Any changes to .INI files do require restart of the corresponding Nectus Service.
To adjust logging settings follow these steps
Step 1: Stop the required Nectus services on the server.
Step 2: Go to “C:\Program Files\Nectus” on the Nectus server.
Step 3: Update the logging configuration in corresponding .ini files located in “C:\Program Files\Nectus” as per the requirement and save them.
Step 4: Start all the Nectus services on the server.
Step 5: To check the current size of log folders, navigate to “C:\Program Files\Nectus\Logs.”
How to Monitor Number of Active TCP Sessions on PaloAlto Firewalls
Network Monitoring, Technical NotesHow to Monitor Number of Active TCP Sessions on PaloAlto Firewalls
Quick Start
Step 1: Login to Nectus and go to Monitoring -> Network Monitoring Settings -> Custom SNMP Trackers.
Step 2: Click on the Create button to create a new SNMP Custom Tracker that will be collecting number of active TCP sessions every 5min.
Palo Alto SNMP OID that returns number of active TCP sessions: 1.3.6.1.4.1.25461.2.1.2.3.4.0
Step 3: Enable the tracker, provide the tracker name, SNMP OID, unit name and data type.
Alerting option can be enable with predefined threshold value.
Step 4: If not created in advance, create the SNMP Device View by clicking the + (plus) button.
Provide the view name and select the Palo Alto Firewalls from available device list for monitoring.
Click “Ok” to finish tracker creation.
Step 5: For reporting, Go to the Reports -> “Top” reports -> Top Custom SNMP Trackers
Step 6: Select the appropriate report and tracker name to get the max. and min. values.
Click on the Graph button to get the tracker trend in visual form.
Done.
How to Monitor Number of Active UDP Sessions on PaloAlto Firewalls
Network Monitoring, Technical NotesHow to Monitor Number of Active UDP Sessions on PaloAlto Firewalls
Quick Start
Step 1: Login to Nectus and go to Monitoring -> Network Monitoring Settings -> Custom SNMP Trackers.
Step 2: Click on the Create button to create a new SNMP Custom Tracker that will be collecting number of active UDP sessions every 5min.
Palo Alto SNMP OID that returns number of active UDP sessions: 1.3.6.1.4.1.25461.2.1.2.3.5.0
Step 3: Enable the tracker, provide the tracker name, SNMP OID, unit name and data type.
Alerting option can be enable with predefined threshold value.
Step 4: If not created in advance, create the SNMP Device View by clicking the + (plus) button.
Provide the view name and select the Palo Alto Firewalls from available device list for monitoring.
Click “Ok” to finish tracker creation.
Step 5: For reporting, Go to the Reports -> “Top” reports -> Top Custom SNMP Trackers
Step 6: Select the appropriate report and tracker name to get the max. and min. values.
Click on the Graph button to get the tracker trend in visual form.
Done.
How to Monitor Number of Active ICMP Sessions on PaloAlto Firewalls
Network Monitoring, Technical NotesHow to Monitor Number of Active ICMP Sessions on PaloAlto Firewalls
Quick Start
Step 1: Login to Nectus and go to Monitoring -> Network Monitoring Settings -> Custom SNMP Trackers.
Step 2: Click on the Create button to create a new SNMP Custom Tracker that will be collecting number of active ICMP sessions every 5min.
Palo Alto SNMP OID that returns number of active ICMP sessions: 1.3.6.1.4.1.25461.2.1.2.3.6.0
Step 3: Enable the tracker, provide the tracker name, SNMP OID, unit name and data type.
Alerting option can be enable with predefined threshold value.
Step 4: If not created in advance, create the SNMP Device View by clicking the + (plus) button. Provide the view name and select the Palo Alto Firewalls from available device list for monitoring.
Click “Ok” to finish tracker creation.
Step 5: For reporting, Go to the Reports -> “Top” reports -> Top Custom SNMP Trackers
Step 6: Select the appropriate report and tracker name to get the max. and min. values. Click on the Graph button to get the tracker trend in visual form.
Done.
How to Monitor Number of Palo Alto VPN (Global Protect) Users
Network Monitoring, Technical NotesHow to Monitor Number of Palo Alto VPN (Global Protect) Users
Step 1: Login to Nectus and go to Monitoring -> Network Monitoring Settings -> Custom SNMP Trackers.
Step 2: Click on the Create button to create a new SNMP Custom Tracker that will be collecting number of connected VPN users every 5min.
Palo Alto SNMP OID that returns number of connected users: 1.3.6.1.4.1.25461.2.1.2.5.1.3.0
Step 3: Enable the tracker, provide the tracker name, SNMP OID, unit name and data type.
Alerting option can be enabled with predefined threshold values.
Step 4: If not created in advance, create the SNMP Device View by clicking the + (plus) button.
Provide the view name and select the Palo Alto Firewalls from available device list for monitoring.
Click “Ok” to finish tracker creation.
Step 5: For reporting, Go to the Reports -> “Top” reports -> Top Custom SNMP Trackers
Step 6: Select the appropriate report and tracker name to get the max. and min. values.
Click on the Graph button to get the tracker trend in visual form.
Done.
Nectus DB Migration by manually copying DB files to a new server.
Nectus Installation, Technical NotesNectus DB Migration by manually copying DB to a new server.
Step 1: Prepare new server by performing clean Nectus installation with the same Nectus version as on old server
Step 2: Stop all Nectus services on the new server
Step 3: Delete all the content from “C:\Program Files\Nectus\Database” folder on new server.
Step 4: Copy complete “C:\Program Files\Nectus\Database” folder from the old Nectus server to the “C:\Program Files\Nectus\Database” folder on the new server
Step 5: Copy file “C:\Program Files\Nectus\Web\Apache24\htdocs\protected\config\database.ini” from old server to the same location on new server.
(Overwrite existing file).
Step 6: In all *.ini files located in “C:\Program Files\Nectus” folder on new server update
DatabasePassword=wL1Kdnl6h$ line with a new password for username “vconsole” which can be found in
“C:\Program Files\Nectus\Web\Apache24\htdocs\protected\config\database.ini” file.
Step 7: Open the Registry Editor and in “HKEY_LOCAL_MACHINE -> SOFTWARE -> Virtual Console LLC -> Nectus”
update passwords for the three database accounts. (New passwords can be found in database.ini file)
Step 8: Start all Nectus Services
Migration Complete.
Performing Nectus DB migration to a new server with “DB Migration” tool
Nectus Installation, Technical NotesPerforming Nectus DB migration to a new server with “DB Migration” tool
DB Migration tool is only available to users with Super Admin rights.
Prepare new server with clean Nectus installation with the same Nectus version as on old server.
Step 1: Login to the old Nectus server and go to Settings -> Database -> DB Migration.
Step 2: In the DB Migration window specify IP address of the new server and password for “vconsole” DB account from the new server.
Note: Password for “vconsole” account can be found in the
“C:\Program Files\Nectus\Web\Apache24\htdocs\protected\config\database.ini” file on the new server.
Step 3: Click on the Test Connection. It will perform the credentials and Nectus version checks.
Step 4: Start migration by clicking on “Start DB migration”.
Depending on the database size migration may take several hours.
How to Generate Alerts Based on SNMP Traps
SNMP Hints, Technical NotesGenerating Alerts Based on SNMP Traps
Step 1: Login to the Nectus portal, go to the Logs -> SNMP Traps.
Step 2: You will see two Tabs “SNMP Traps” and “SNMP Trap OID Alerts”.
“SNMP Traps” Tab contain list of all the SNMP Traps received by Nectus server from all the network devices.
“SNMP Trap OID Alerts” Tab contains list of pre-configured (default) alert rules for different SNMP traps.
You can search if specific SNMP Trap OID already have an alert rule defined and enable it.
If alert rule already exists, you just need to activate it by clicking on “Enable” button inside the rule.
Step 3: If there is no rule exists, click on “Create” button to create a new alert rule.
Complete all the required alert rule parameters.
Step 4: Click on “Edit Template” to review and adjust the Alert template format
Done.
How to Monitor Windows Services with Nectus
Windows Server (WMI) MonitoringHow to Monitor Windows Services with Nectus
Quick Start Guide
Step 1: Login to the Nectus portal, Add the WMI Account for accessing the Windows Servers.
Go to Settings -> General Settings -> WMI Integration.
Click on the Add button in the WMI Integration Modal.
Step 2: Provide Windows Domain/Server information with user credentials and click on the Test button.
Step 3: Now, let’s create a WMI group and add the Windows Server into that group.
Go to WMI Servers and right click to Add a Group.
Step 4: Give a valid name for the WMI Group and enable the monitoring.
Assign a Monitoring Profile to the group.
Step 5: Click Edit profile and go to the “Services” Tab and check the necessary alerting checking boxes.
Step 7: Add the Service information by clicking the Options button.
Here, we added the “Print Spooler” Service to monitor and enable the checkbox to start the Service, if it had stopped.
Add the Service name in the text box by pressing “+” button.
Save settings to monitoring profile.
Step 8: Now, we had successfully applied the Monitoring Profile. Click on “Ok” button.
Step 9: Now, add the Windows Server to the group we created.
Right click on the created group and select the Add New WMI Server option.
Step 10: Provide the IP address, select the appropriate WMI Monitoring Profile Group and WMI Account for access.
Click on the “Test” button to test the server access.
Step 6b: Now we’ll see the newly added server in the below screenshot.
How to use Custom Tags in Nectus
Network Devices Configuration Backup, Technical NotesHow to use Custom Tags in Nectus
Step 1: Login to the Nectus portal with a valid credentials. Go to Settings -> General Settings -> Tags.
Step 2: After clicking the Tags option, it will open a Tags modal with five tabs – SNMP Devices, Interfaces, WMI Servers, IP Monitors, Sites.
In this article, we’ll choose the IP Monitors and create 3 tags.
Step 3: After clicking the Create button, we’ll get the Add IP Monitor Custom Tag Modal. Provide name and pick the input type from available three options: Type-In, Single Select, Multi Select.
Step 3a: Type-in option allows the user to type the value of the tag as per their need in text form.
Step 3b: Single Select option allows the user select only one tag value at the time of assignment.
Step 3c: Multi Select option allows the user select one or more value at the time of assignment.
Step 4: Here, for the demo purposes, we had created 3 tags as shown below.
Step 5: Now, let’s define values for custom tags in the existing IP Monitor. Right-click on selected IP and go to the Properties.
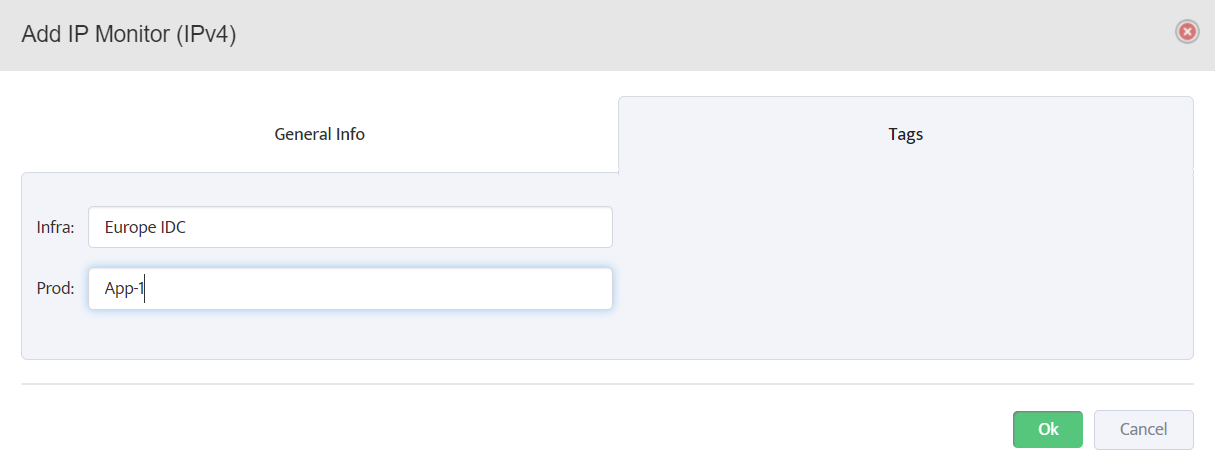
Step 6: Select the Tags tab from the Edit IP Monitor modal and fill the Tags Values accordingly.
How to monitor the status of Windows Processes
Technical Notes, Windows Server (WMI) MonitoringHow to monitor the status of Windows Processes.
Quick Start Guide
Step 1: Login to the Nectus portal, Add the WMI Account for accessing the Windows Machine. Go to Settings -> General Settings -> WMI Integration.
Click on the Add button in the WMI Integration Modal.
Step 2: Provide Windows Domain/Server information with user credentials and click on the Test button.
Step 2a: With the valid credentials and connectivity, we should get the success message as displayed in the test modal.
Step 3: Now, let’s create a WMI group and add the Windows Server into that group.
Go to WMI Servers and right click to Add a Group.
Step 4: Give a valid name, enable the monitoring to select the appropriate Monitoring and ICMP profiles.
Step 4a: We can also create a new monitoring profile by clicking the “+” icon.
Check the required boxes based on your monitoring requirements.
For any processes alerting, Go to Processes Tab, then select alert option to check the process state.
Step 4b: Add the process information by clicking the options button.
Consecutive Reading options helps monitor whether process is running or not running for defined range [1-256] consecutive times.
It helps to reduce the false alerts.
Add the process name in the text box by pressing “+” button.
Step 5: Now, add the WMI Server information which has to be monitored.
Right click on the created group and select the Add New WMI Server option.
Step 6: Provide a valid name, IP address, select the appropriate WMI Monitoring Profile Group and WMI Account for access.
Click on the Test button to test the server access.
Step 7: Now we had enabled the monitoring for the Windows processes on Nectus.
Whenever the condition satisfies, then alerts get generated. We can view the alerts under Alerts -> Alert log.
We’ll also get the alerts in email form by enabling email alerts option with proper SMTP configuration.
Congrats, now we have successfully created a monitoring profile to monitor the process in a Windows Server.
How to use Nectus API Interface
Nectus Installation, Technical NotesHow to use Nectus API Interface
Quick Start Guide
Step 1: Log in to Nectus Portal. On the home page, select General Settings -> Miscellaneous.
Step 2: Next, we have to generate a new client ID and client secret for creating the token. Go to API Accounts and click on Create.
Step 3: Check the Enable box, enter the Client ID & Secret in the text box, and select the necessary access level (Read-Write or Read-Only) for the modules.
Here, we have given the Client ID as API_USER_1 and Client Secret as Nectus123. Click on the Ok button to create it.
Step 4: Each API Account with the Client’s information obtains a unique ID and gets listed.
We also have the Edit button to modify and the Delete button to remove the existing accounts with ID. Click on the Ok button to close the miscellaneous modal.
Step 5: Now, we have to create the API token with the help of the generated Client ID & Client Secret.
Here, we are using the POSTMAN Application for the sake of the demo. Use the below query and headers to get the access token.
API URL: https://<servername>/token/get
Request Type: GET
Headers: Authorization – client_id=API_USER_1 client_secret=Nectus123
Step 6: Click the Send button to obtain the Status Code with 200 Ok with the token details in the response body.
Step 7: Now, we can use the generated access token for all Nectus API’s.
Let’s try with some API Request.
API URL: https://<servername>/IPMonitor/restAPI/getStatusIPv4Monitor
Request Type: GET
Headers: Authorization – token=<generated-access-token>
After clicking the Send button, we obtain the list of IPv4Monitor groups with the associated IP address and status.
Congrats! We have successfully used the Nectus API interface to access the monitoring data points which will ease the third-party integration with other systems.
How to Add and Configure IP Monitors
Network Monitoring, Technical NotesStep 1: Login to Nectus portal. Then, click on IP Monitors.
Step 2: Right Click on IP Monitors and select Add Group to create a new monitoring group.
Step 3: Provide a unique name to the group and check the “Enable monitoring” option.
If monitoring requires custom ICMP monitoring timers then select optional Custom ICMP Monitoring Profile.
Choose the appropriate Polling Agent (Default is Main Polling Agent) and provide optional physical address.
Click on Ok to create a new IP monitor group.
Step 4: Now, the new group gets added under IP Monitors. The square icon indicates the status and since no device is added in the group, it’s shown in grey color.
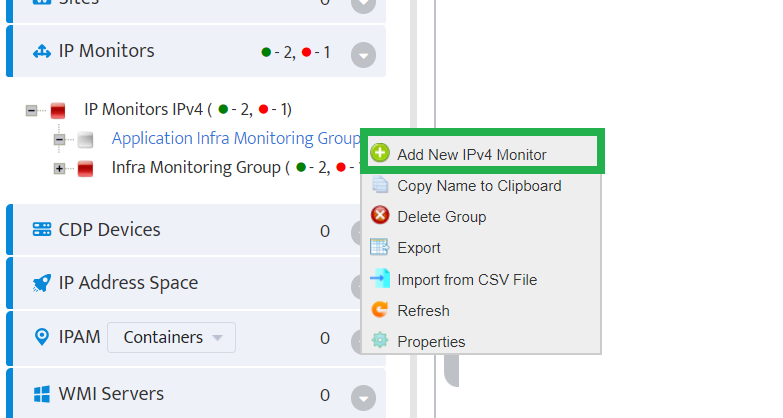
Step 5: Right click on the IP Monitor Group to add a new IP Monitor into the group.
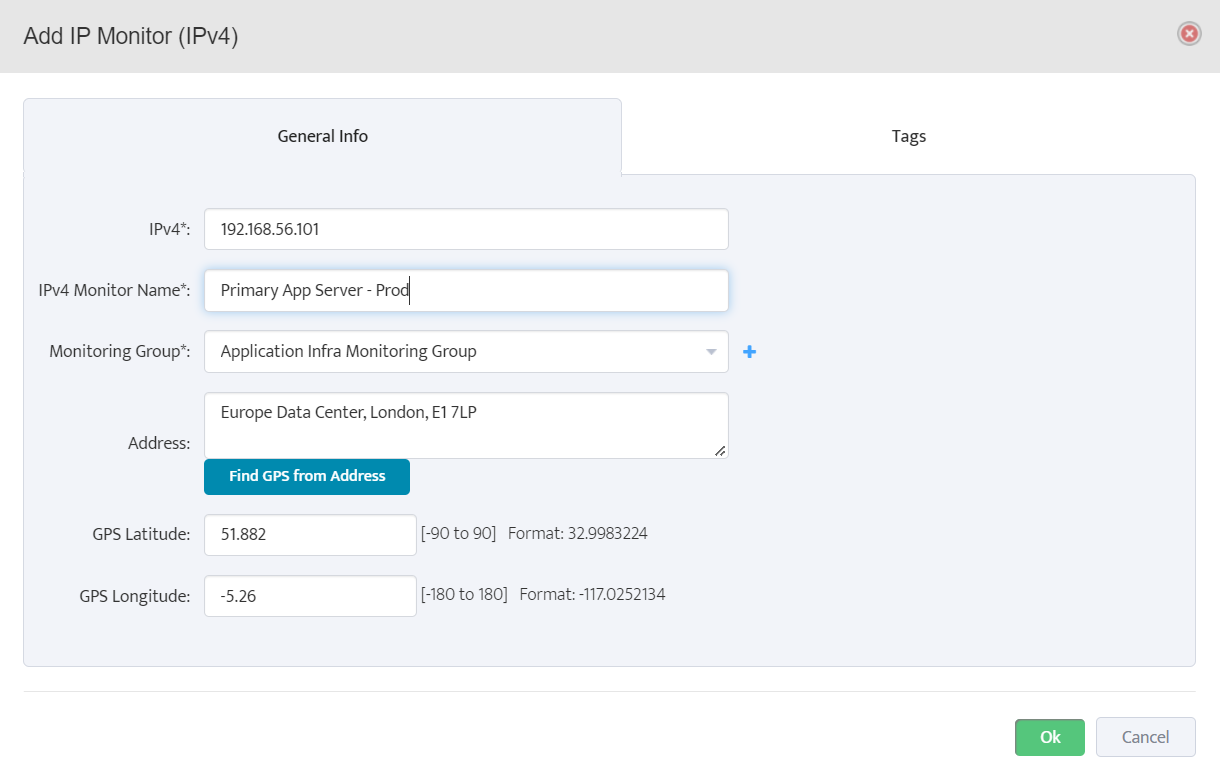
Step 6: Under the General Info Tab, provide a valid IP, name and optional physical address.
Then, click on Ok button to Add IP Monitor.
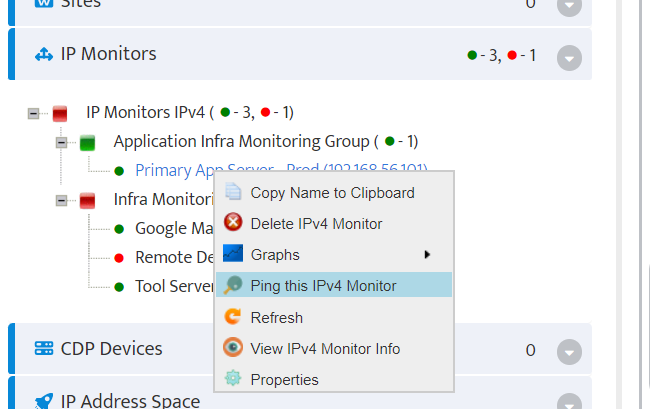
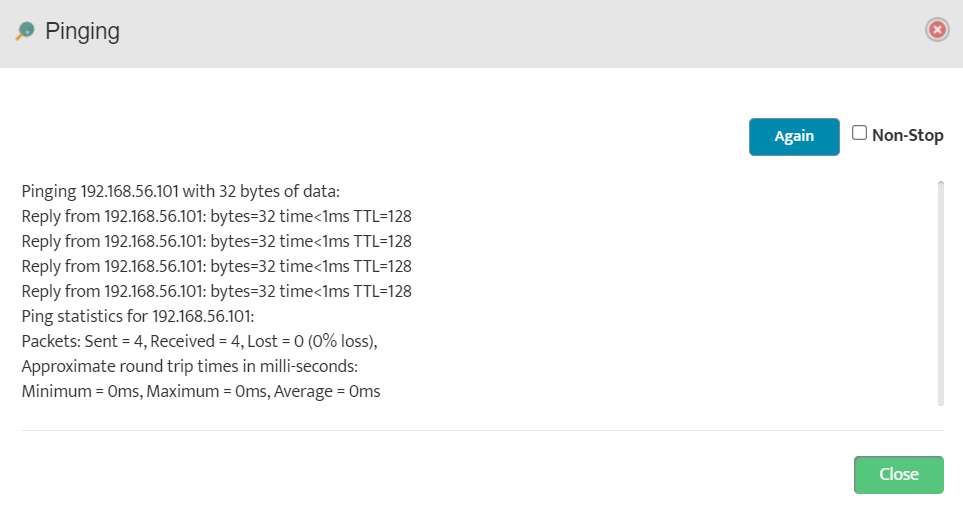
Step 7: To test the reachabilty of IP Monitor, we can use Ping this IPv4 Monitor option. It performs a live ICMP ping test to the IP Monitor.
Step 8: It also provides the options to repeat the test and continue ping tests.
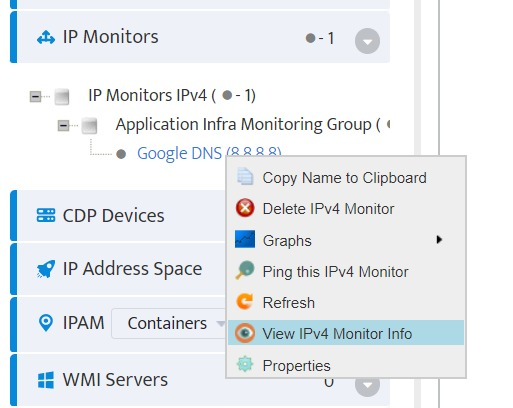
Step 9: To get the current device monitoring information, go to View IPv4 Monitor Info.
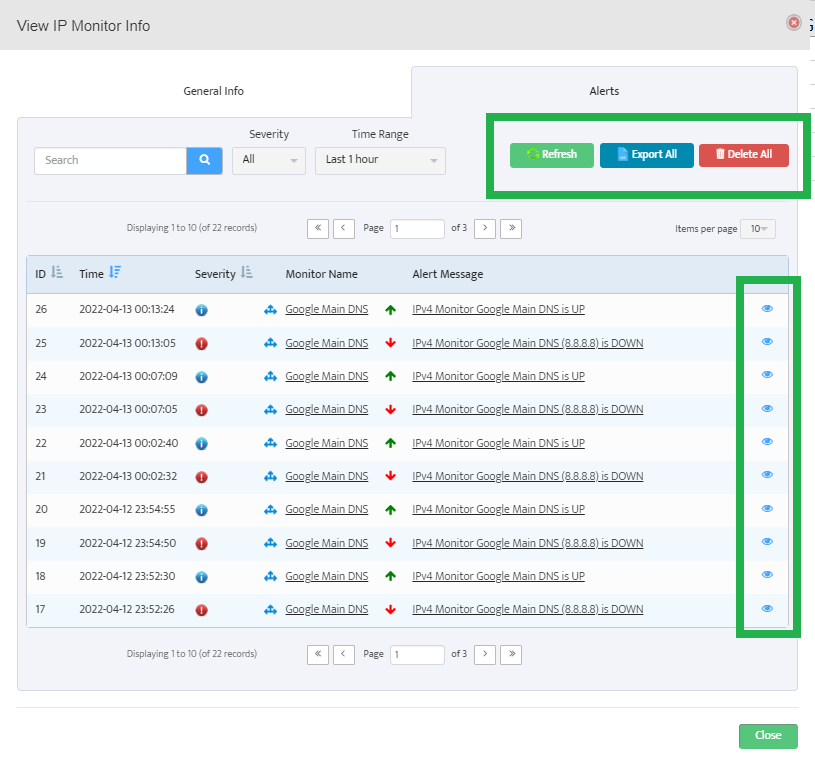
Step 10: The General Info provides the basic details about the device.
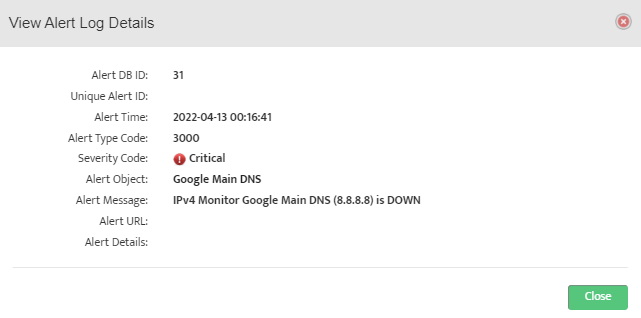
Alerts tab contains all the monitoring alerts. All alerts can be exported in *.csv format for further drill down. Click on eye icon in each row to get more information about the alert.
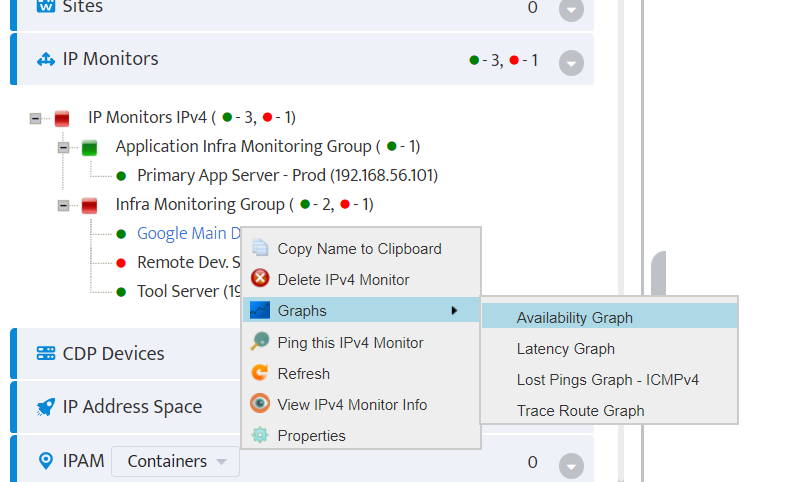
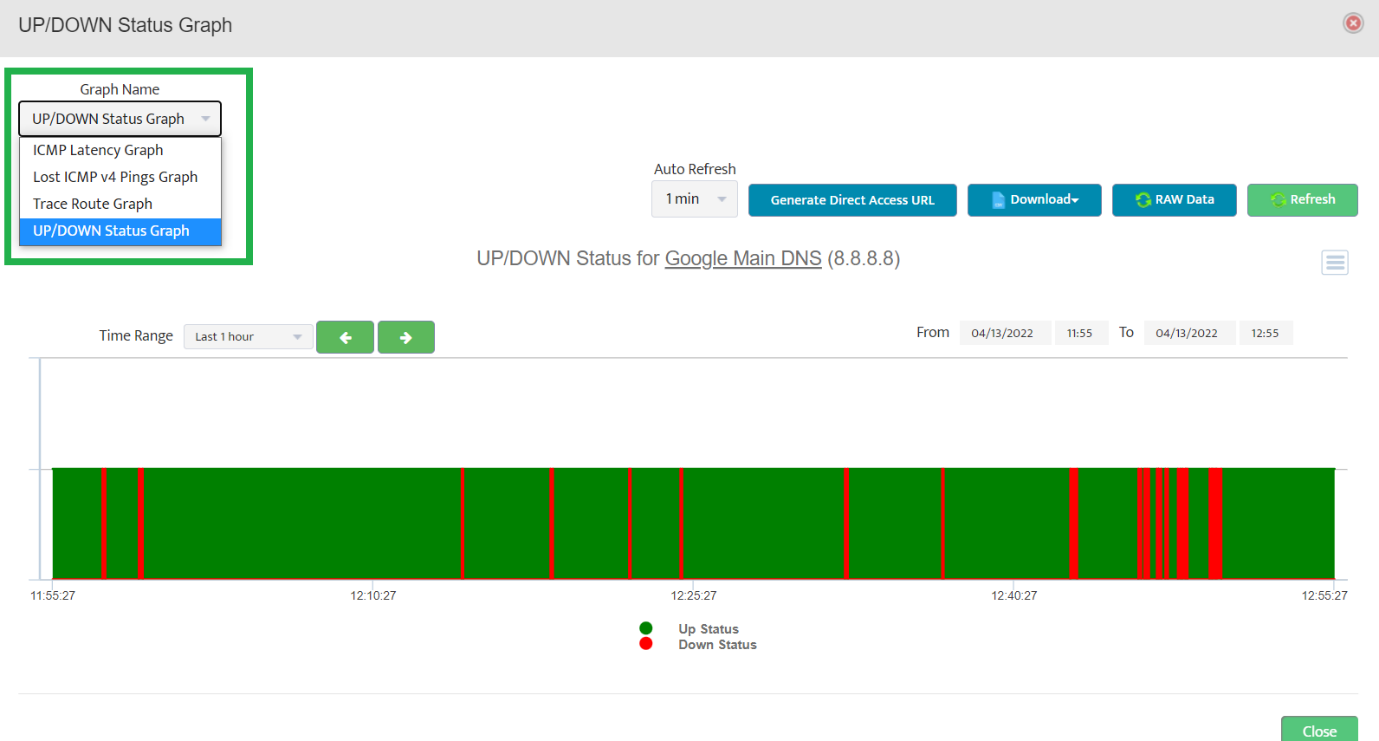
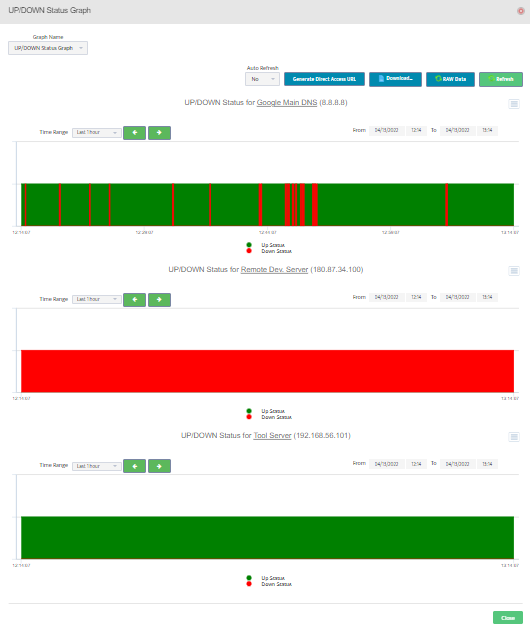
Step 11: Right click on the device and Graphs to get a plot based on UP/DOWN state, latencies etc.
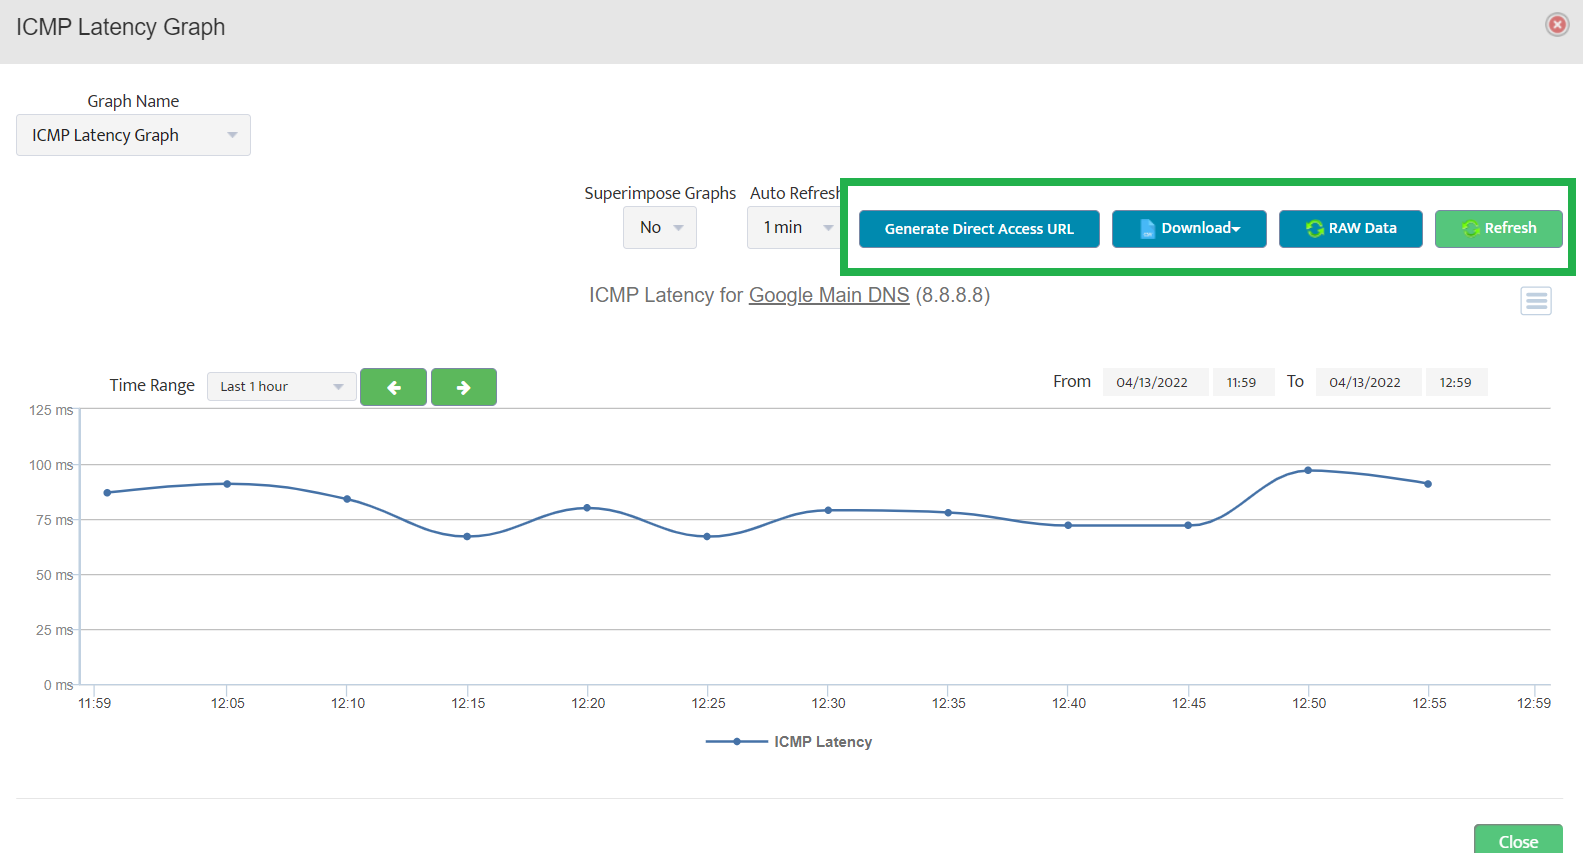
Step 12: We can share the polled data from Nectus in several ways.
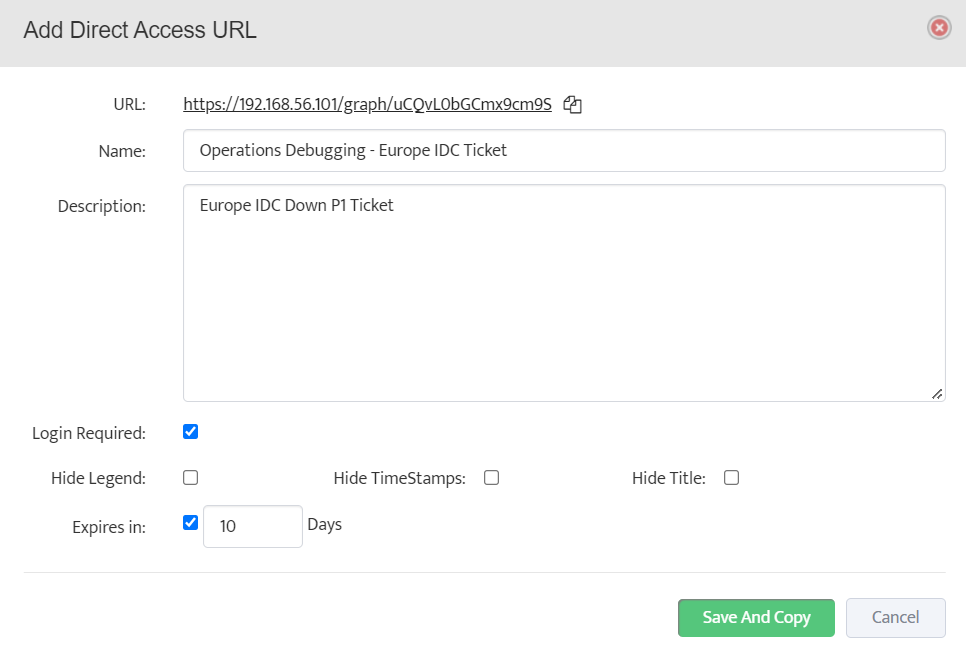
Step 13: We can share the access to graph using Generate Direct Access URL.
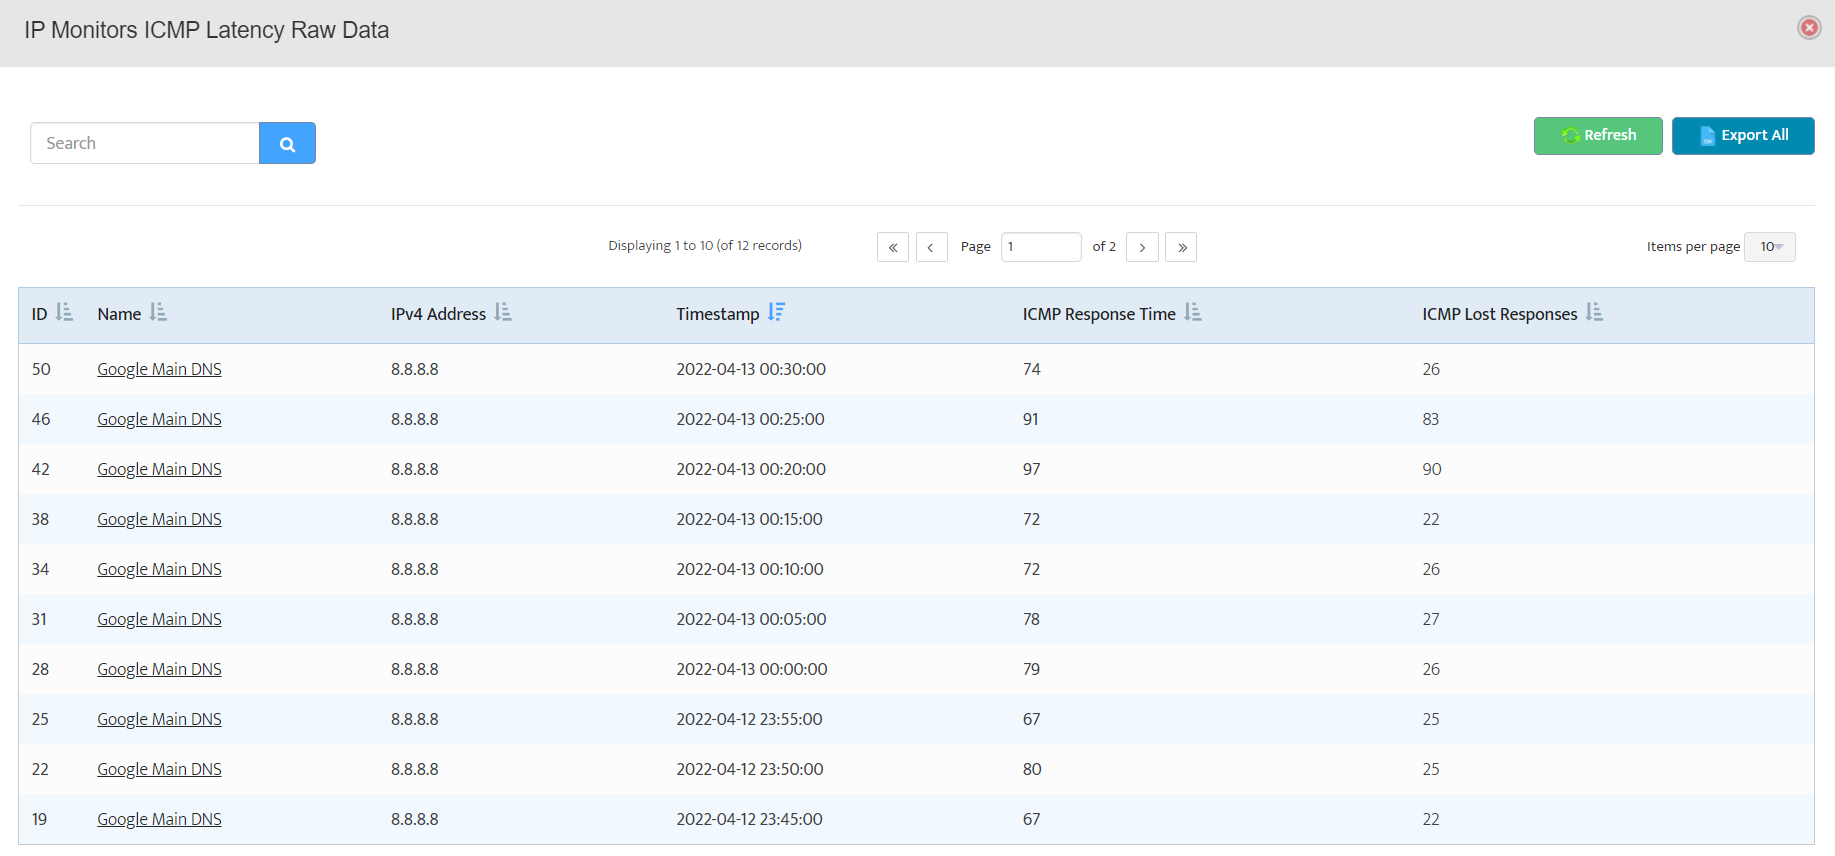
Step 14: Further, we can also export all data points in a *.csv form using Export All option.
Step 15: We can select multiple devices using CTRL + Left Click. Right click on any one to get the available options.
Step 16: Select the Graphs option to obtain the consolidated view of the plots for the selected devices.
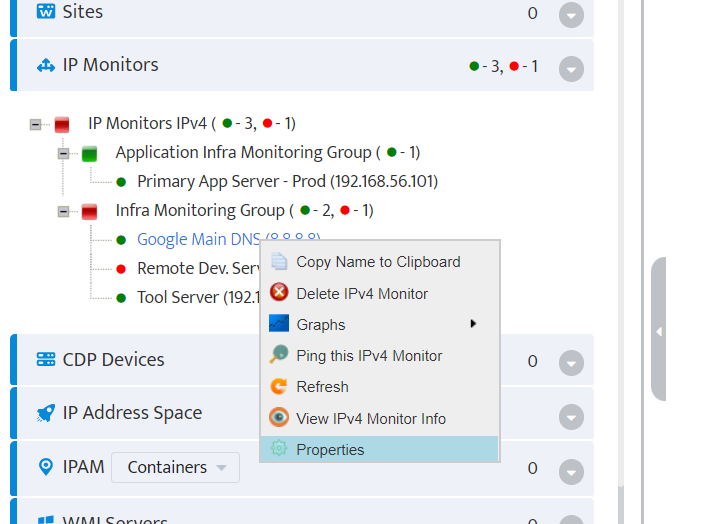
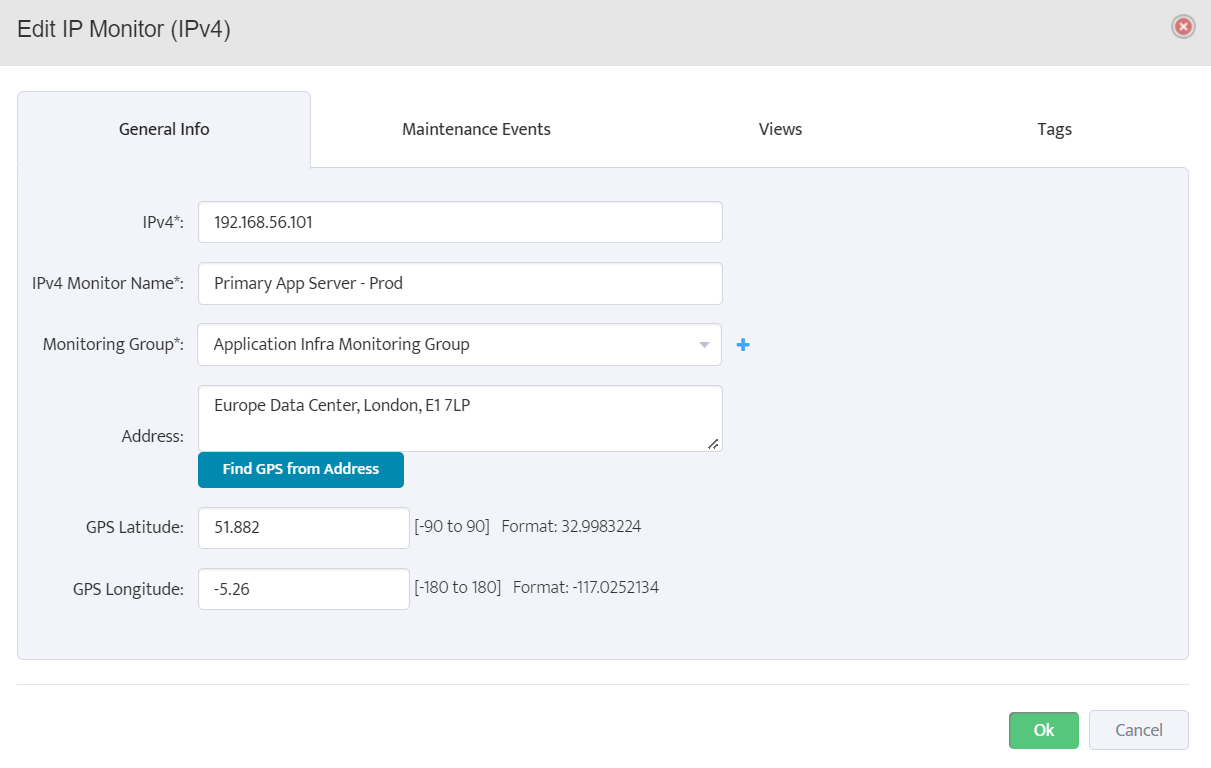
Step 17: To edit the added devices, right click on the device and choose properties.
Step 18: Bulk import through a *.csv file can be performed and sample file can be downloaded from Import from CSV modal for quick reference.
Step 19: Post the data import completion, skim through the device information, and select them to save into the database for the monitoring.
Step 20: Additionally, we can select Delete IPv4 Monitor to delete the devices from monitoring.
Congrats! We have successfully explored the lifecycle management of devices for ICMP monitoring using IP Monitor.
How to Perform Nectus Software Upgrade
Nectus Installation, Technical NotesStep 1. Download latest Nectus release from Nectus Support Portal (https://support.nectus5.com)
Step 2. Unzip Nectus distribution archive Nectus xxxxx.zip to any folder on Nectus Server.
For upgrade you should have two files:
Step 3. Right-click on “Nectus Setup” and select “Run as administrator”.
Step 4. The Nectus Installer window opens. Click Next.
Step 5. The License Agreement window opens. Click “I Agree”.
Step 6. The Upgrade window opens. Select the “Upgrade” mode.
Note: “Upgrade” mode (the default mode) preserves the database and all data in it.
!!! “Remove” mode will delete the existing database and all data will be erased!!!!
Click “Install”.
Step 7. The installation begins by saving resources.
Step 8. The old software components are uninstalled.
If desired, click on “Show details”.
Step 9. Show details lists the steps the installer is performing.
Step 10. When the old software components have been removed, the new version will be installed.
Step 11. The installation completes. Click Next.
Step 12. The “Completing Setup” window opens.
How to Control Access Rights to Network Devices in Nectus
Access Right Management, Nectus Installation, Technical NotesIn this article, we will show how to control the access rights to specific network devices visible in Nectus.
We will create a user group “Texas Admins” that have access only to specific subset of SNMP devices “Texas Network Devices” in Nectus database.
Step 1. Create a custom SNMP device view “Texas Network Devices” in Inventory -> Views -> SNMP Device Views
Step 2. The SNMP Devices Views window opens. Click on Create.
Step 3. The Add SNMP Devices View window opens. Give the view a name “Texas Network Devices”.
Select desired devices in the window on the right (Available SNMP devices).
When all are selected, click on the Left Arrow key to move the selected devices from the Available window to the Selected window.
We selected nine devices.
Step 4. Selected devices move into the Selected SNMP Devices window. Click Save.
Step 5. Looking in the SNMP Devices Views window, we see that the view “Texas Network Devices” has been created and has nine devices.
Step 6. Create Admin User group “Texas Admins” in Settings-> Admin Accounts
.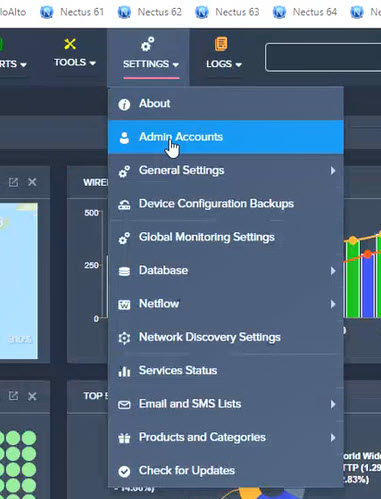
Step 7. Navigate to Settings → Admin Accounts.
Step 8. The Admin Accounts window opens. Select User Groups, and click Create.
Step 9. The Add Users Group window opens. Enter the Group Name (Texas Admins), select the Access Right (Read Only), click Views.
Step 10. Select desired View “Texas Network Devices” that members of this Admin group can see.
Step 11. Click OK.
Step 12. Create User in “Texas Admins” Group.
Step 13. In the Admin Accounts window, click on User List and click Create.
Step 14. The Add User Account window opens.
Fill in the fields (First Name, Last Name, Email/Username).
Create and confirm password. Assign to group (Texas Admins). Click OK.
Step 15. In Admin Accounts window, verify that new user (Mike Fletcher) now appears with Group Texas Admins.
Step 16. In the Admin Accounts window, click User Groups and click on Texas Admins.
Verify the assigned view for SNMP Devices Views is Texas Network Devices.
Step 17. Logout and log back in as Mike Fletcher.
In the Inventory window under SNMP Devices you should only see the 9 devices assigned to “Texas Network Devices”.
How to configure HTTP Application monitoring in Nectus
Application MonitoringHow to configure HTTP Application monitoring in Nectus
Step 1: Login to Nectus portal. In the home page, click on Applications. Under Applications, we’ll get HTTP, TCP, UDP options.
Step2: First, right click on the HTTP and select on the Add Group.
Step 3: Now, provide unique Group name and check the Enable monitoring & Alerting options.
Click on Ok to create the new application group.
Step 4: Again, right click on the created group and select the Add New Application.
Step 5: Now, provide a valid URL, name, and select the appropriate group, distributed polling agent. Additionally, GPS latitude and longitude gets autogenerated from the given address.
Step 6: Next, click on the Metrics tab, then select the required metrics which has to be monitored. In our case, we are monitoring all the key metrics of HTTP application. Further, we can also edit the global alert template by clicking the Global Alert Template icon. Lastly, click Ok button to add new HTTP application.
Step 6(a): Set the alert template using available variables. Click on the Send Test Email to get the sample email with select subject and email body patterns. Then, click Ok button to apply and close the window.
Step 7: Now, let’s create the type of method [GET, PUT, POST, PATCH, etc.] to monitor in the added HTTP Application. Right click on the HTTP Application (User Info) -> Select HTTP Method
Step 8: Provide the unique and valid name, HTTP method with Path URL. Click on Test button to check
Step 8(a): We have got the Test Success message
Step 9: Next, right click on the created method and select View HTTP Method Info to get the performance information.
Step 10: This window provides the overall performance graphs and status of the URL method.
Step 11: To get the specific metrics graphs, Right click on created method -> Graphs -> Availability Graph, Connection Time Graph, etc.
Step 12: Graphical View based on the selected metrics.
Step 13: Alternatively, we can also enable the HTTP application monitoring metrics from Monitoring -> Application Monitoring Settings -> HTTP.
Congrats! We have successfully enabled the application monitoring for HTTP apps.
Configuring SNMP OID for Memory utilization Monitoring
Network Monitoring, Technical NotesConfiguring SNMP OID for Memory Utilization Monitoring
Procedure
Step 1. Right-click on the device that required RAM utilization monitoring and select View Device Info.
Step 2. The View Device Info window opens. Click on SNMP OID.
Step 3. The SNMP OID window opens. Examine the entries for “platform specific oid memory utilization.” In this case two OID entries have been made. Depending on the manufacturer, one or two entries will be entered.
Step 4. If there are no entries, then SNMP OID need to be entered to enable the memory utilization monitoring.
Step 6. The SNMP OID (memory utilization) window appears.
The manufacturer will tell you how the device reports memory utilization. If the device reports Memory Utilization Percent directly, the OID is entered in that box and provisioning is done. If the device reports separate values for total, free or used, then the OID information for each count need to be entered. Nectus will perform the calculation to arrive at Memory Utilization.
For example, when the device reports Memory Utilization Percent directly, the OID is entered in the first box and provisioning is complete.
In this case, the device reports Memory Used and Memory Free, so the OID for Memory Used is entered in the Memory Used space and the OID for Memory Free is entered in the Memory Free space. Nectus will compute utilization as Memory Used / (Memory Used + Memory Free) * 100.
In this case, the device reports Memory Free and Memory Total, so the OID for Memory Free is entered in the Memory Free space, and the OID for Memory Total is entered in the Memory Total space. Nectus will compute utilization as Memory Free / Memory Total * 100.
In this case Nectus is reporting that Used and Free Memory OIDs are required.
We re-enter the OID information as Memory Used and Memory Free, and click OK.
Testing
Step 1. Click View Device → General to see the results of configuration.
RAM percent utilization is working.
Step 4. Change SNMP Walk to GET.
How to install additional polling agent
Nectus Installation, Technical NotesStep 1: Login to Nectus Portal in the home page. Select Settings -> Global Monitoring Settings.
Step 2: Next, select Distributed Agents to get the list of configured agents. Click on Create button to create a new poller agent.
]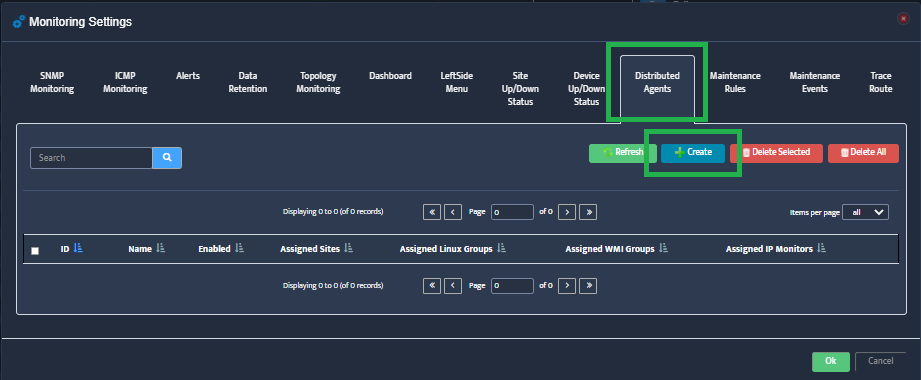
Step 3: Now, provide a valid and unique name to the agent. Here, the Distributed Agent Name is “Regional USA Polling“. Select the enabled checkbox and click on Ok to create the poller object in the main server.
Note: Once the agent installation is complete, the RED changes to GREEN.
Additionally, the status of configured agent can also be checked on home page near the search icon.
Now, let’s start the installation on the Additional Polling Agent Server.
Step 4: After the download is complete, double click on the exe file. Installer window opens up. Click on Next to proceed with the installation.
Step 5: Go through the License Agreement carefully and then click on the Agree button.
Step 6: Select Additional Polling Agent in the Installation Type window and click on the Next button.
Step 7: Select the relevant options. Click on the Next button.
Step 8: Select the destination folder. Make sure, a minimum of 2GB of disk space is available in the selected drive. Click on the Next button.
Step 9: Next, provide the same name in the Additional Agent Name as in step 3. Fill the main polling agent IP address in the textbox and click on the Next button.
Step 10: Warning: Ensure that we open 10167 and 10168 ports between the new and main agent. If not, below error message will pop up.
Step 11: Then, key in a password to integrate the agent with the main server database.
Step 12: Log in to the main server and go to C:\Program Files\Nectus\Web\Apache24\htdocs\protected\config\ path and open database.ini file.
Step 13: Copy the password of vconsole username and paste it on the additional agent installer password textbox and click on the Install button.
Step 14: Once the installation completes, click on Next to proceed further.
Step 15: Finally, click on the Finish button and close the window.
As mentioned earlier, the additional poller status automatically converts to GREEN after successful installation.
Congrats! We have successfully installed the additional polling agent and integrated it with the main server.
Nectus not impacted by Log4J (CVE-2021-44228) Vulnerability
Nectus NewsNectus doesn’t use Apache LOG4J in any of its modules and is not impacted by recent Log4J (CVE-2021-44228) vulnerability.
How to Manually Generate a Process Dump using Process Explorer
Network MonitoringProblem
There may be times where a process dump file (or files) are required to troubleshoot a specific problem. The steps in this document walk through the process of generating a dump file using Process Explorer for IBM Support analysis. While the example used covers the tm1sd.exe process, the same steps can be followed for any process on the operating system. NOTE: You may follow a very similar approach using only Windows Task Manager, however Windows Task Manager will not allow you to choose a dump file location. This step is important if your application consumes a lot of memory and you do not have enough disk space on your Windows drive (C:).
Resolving The Problem