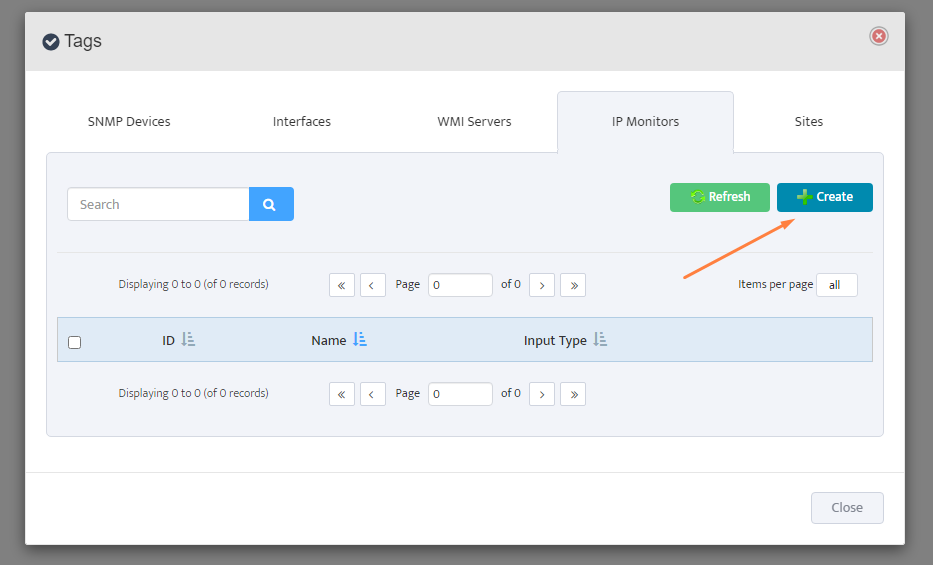
This guide explains how to generate the CSR code and install a commercial SSL certificate for Windows Apache so that you could access your Nectus GUI page securely via HTTPS.
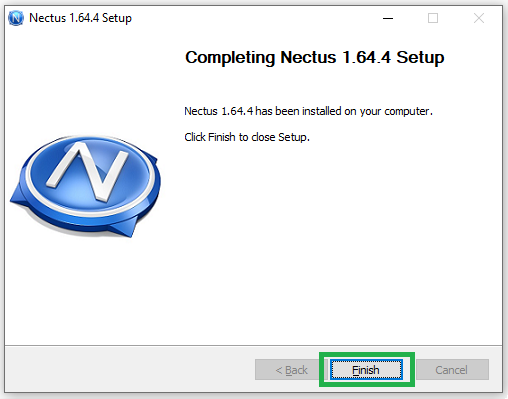
It assumes that during Nectus installation, you selected the default location which is C:\Program Files\Nectus.
If you installed Nectus in a different folder, make sure to adjust the commands and locations given in this guide accordingly.
In general, in order to have a website accessible using secure HTTPS connection, the web server must have a pair of public and private keys configured.
The public key must be signed by a trusted Certificate Authority and added to a digital SSL certificate.
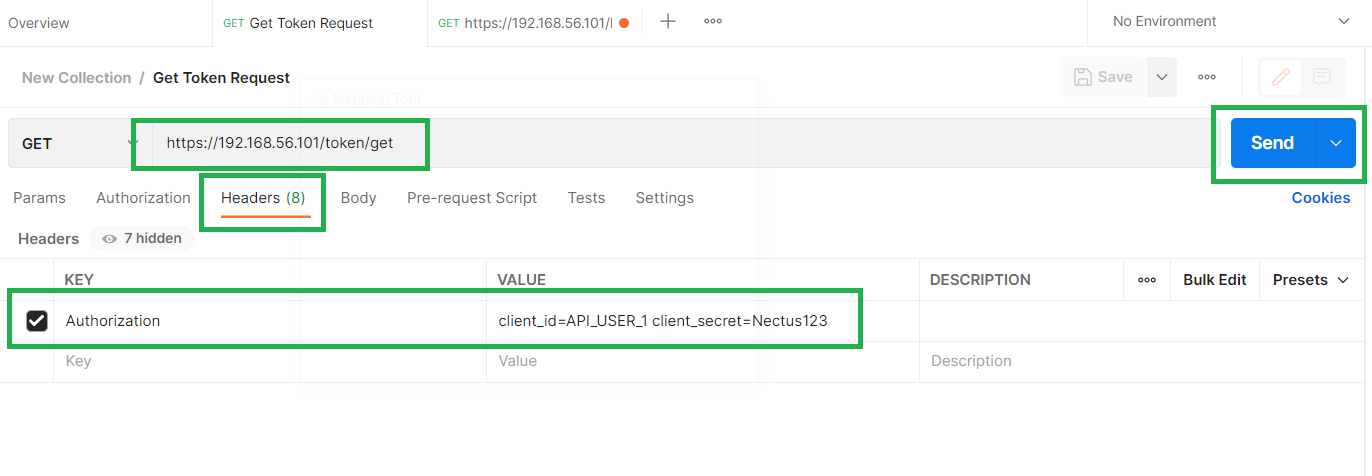
To obtain that certificate, you will need to send the certificate signing request (CSR) code to your SSL provider. Please refer to instructions below:
Generating CSR using OpenSSL
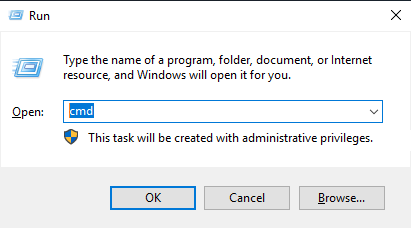
- On your Windows server, press Win+R, enter cmd and hit OK
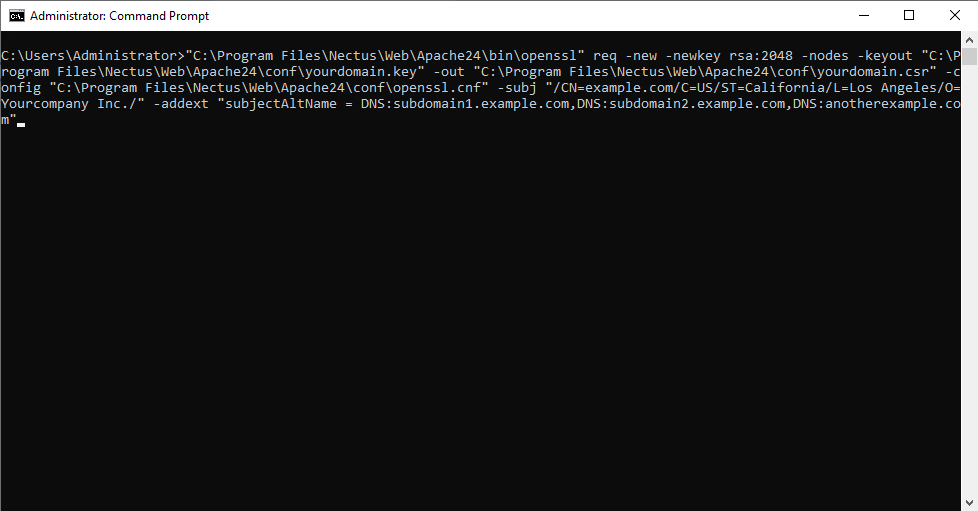
- Now you will need to run a certain OpenSSL command to generate a new CSR/Key pair for your future SSL certificate.
- The command template is below, make sure that you adjust the highlighted fields – they must be related to your system:
“C:\Program Files\Nectus\Web\Apache24\bin\openssl” req -new -newkey rsa:2048 -nodes -keyout “C:\Program Files\Nectus\Web\Apache24\conf\yourdomain.key” -out “C:\Program Files\Nectus\Web\Apache24\conf\yourdomain.csr” -config “C:\Program Files\Nectus\Web\Apache24\conf\openssl.cnf” -subj “/CN=example.com/C=US/ST=California/L=Los Angeles/O=Yourcompany Inc./” -addext “subjectAltName = DNS:subdomain1.example.com,DNS:subdomain2.example.com,DNS:anotherexample.com”
Explanations for each field:
CN= this is the field for the primary domain of your SSL
C= enter the ISO 3166-2 compliant country code here
ST= the field for the state
L= the field for the city
O= the name of your company. If you do not have a company or do not wish to indicate it, simply put NA
DNS: additional domain names (also known as SANs – Subject Alternative Names) that should be included into the certificate;
you can include multiple SANs in the CSR code, however, double-check with your SSL provider whether your SSL certificate supports SANs.
- Executing the command should produce the following output:
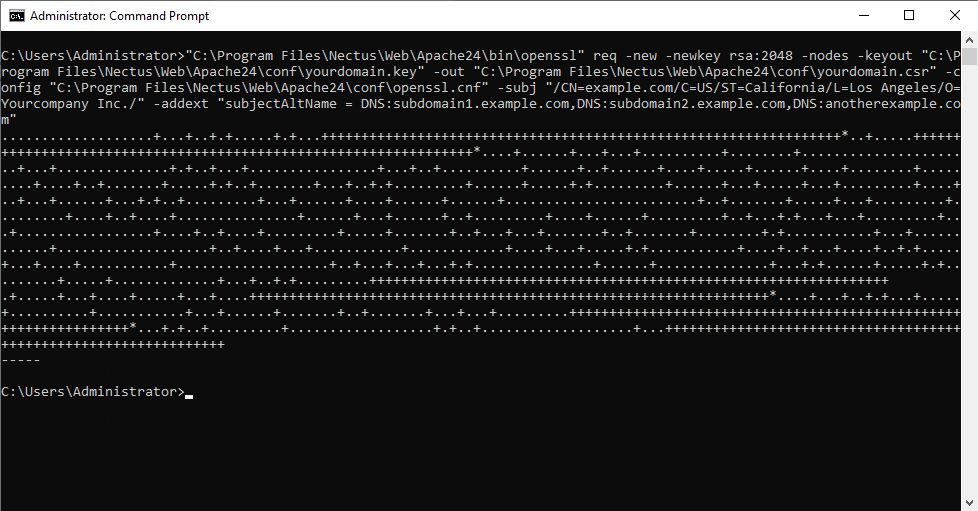
Once done, the C:\Program Files\Nectus\Web\Apache24\conf\ directory will have two new files, the file with the CSR code (.csr) and the file with the private key (.key).
We’ll leave the private key for the time being. The CSR code has to be provided to your certificate vendor — this code is the base for your commercial SSL certificate.
Please contact your SSL vendor regarding SSL certificate purchase.
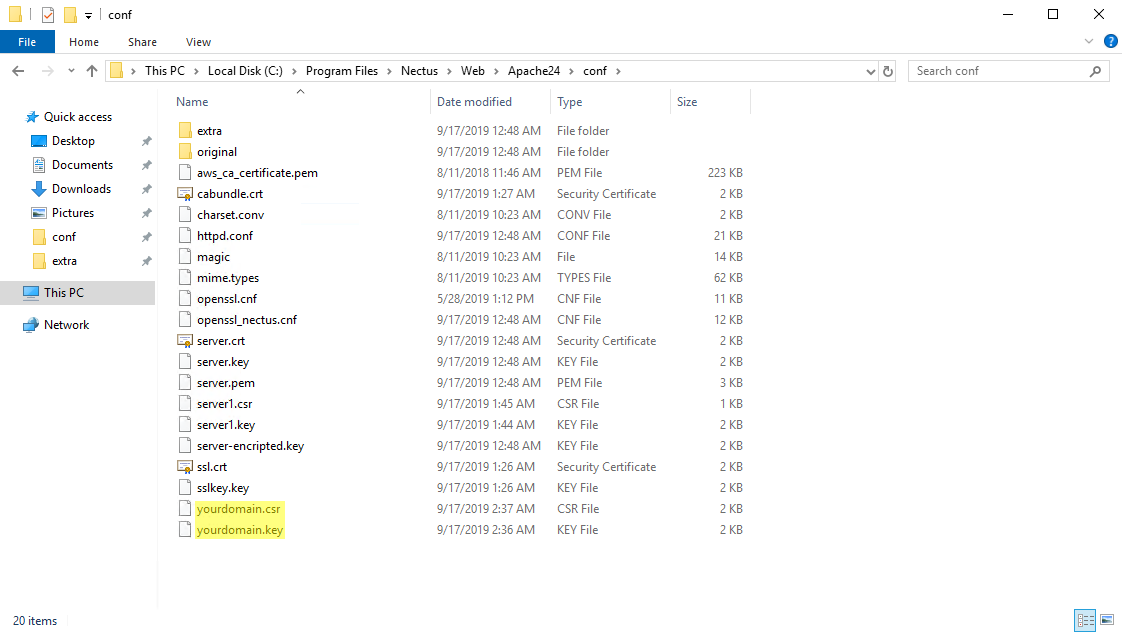
When the SSL is issued, you should receive at least two files: SSL certificate in a .crt (or .pem, .cer) file, and the CA-bundle (also can be called intermediate CA, root CA certificates)
with extensions like .ca-bundle, .crt. Please note that Apache requires only PEM-encoded certificates, so PKCS#7 or PKCS#12 encoded SSLs won’t work.
Configuring SSL for Apache
- Upload those files to the C:\Program Files\Nectus\Web\Apache24\conf\ directory.
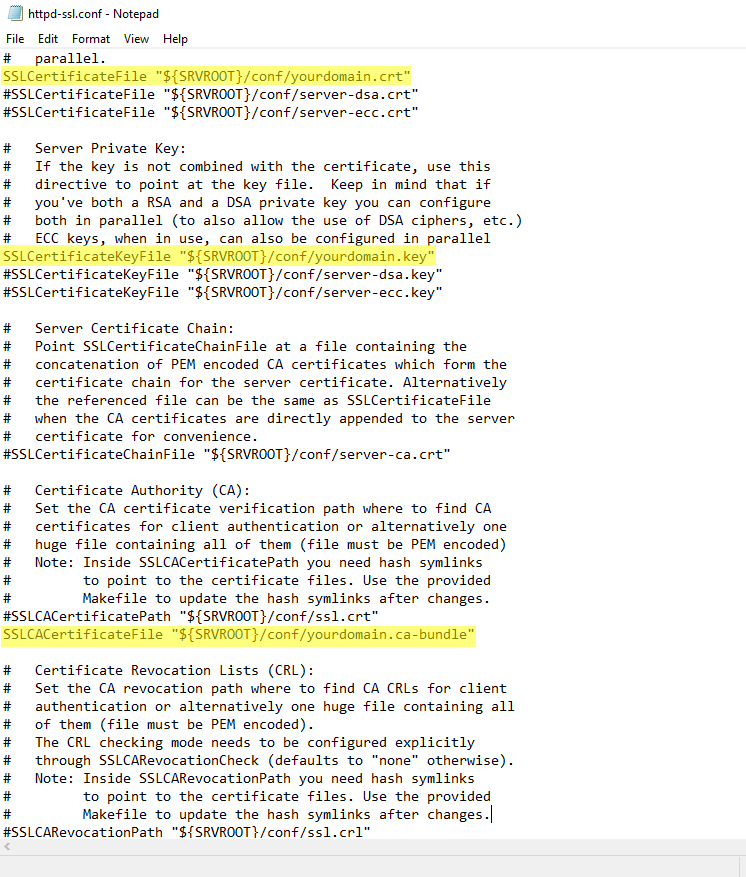
- Then, go to the C:\Program Files\Nectus\Web\Apache24\conf\extra folder, and open the httpd-ssl.conf file in Notepad.
- Find and edit the following directives and make sure that they point to the SSL certificate, Private Key, and the CA-bundle files accordingly:
SSLCertificateFile “${SRVROOT}/conf/yourdomain.crt”
SSLCertificateKeyFile “${SRVROOT}/conf/yourdomain.key”
SSLCACertificateFile “${SRVROOT}/conf/yourdomain.ca-bundle”
Note that the SSLCACertificateFile directive is commented out by default.
You need to delete the # sign at the beginning of the string to uncomment the directive.
- Save the configuration file
- Return back to the C:\Program Files\Nectus\Web\Apache24\bin folder and double-click on ApacheMonitor.exe
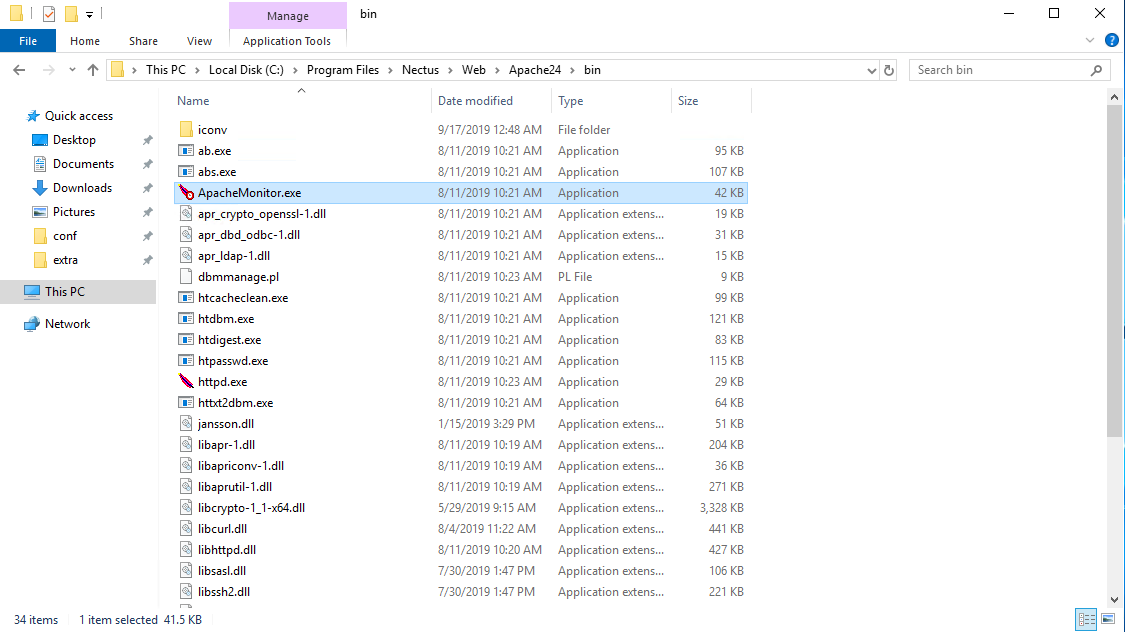
- The ApacheMonitor app will appear in the system tray at the lower right corner of your screen. Find and click it there.
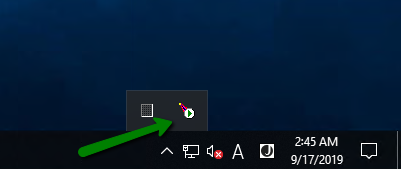
- Hit “Restart”
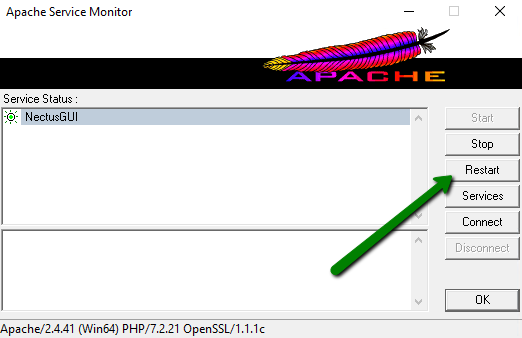
- Now you can try accessing your Nectus GUI page in the browser via HTTPS: https://yourdomain.com

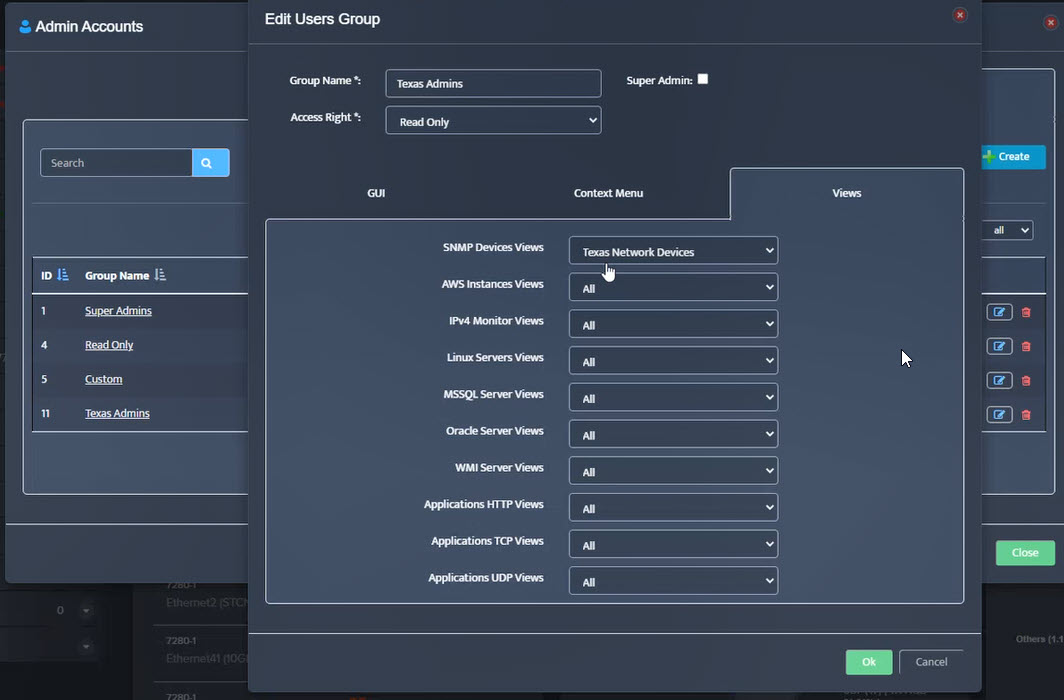
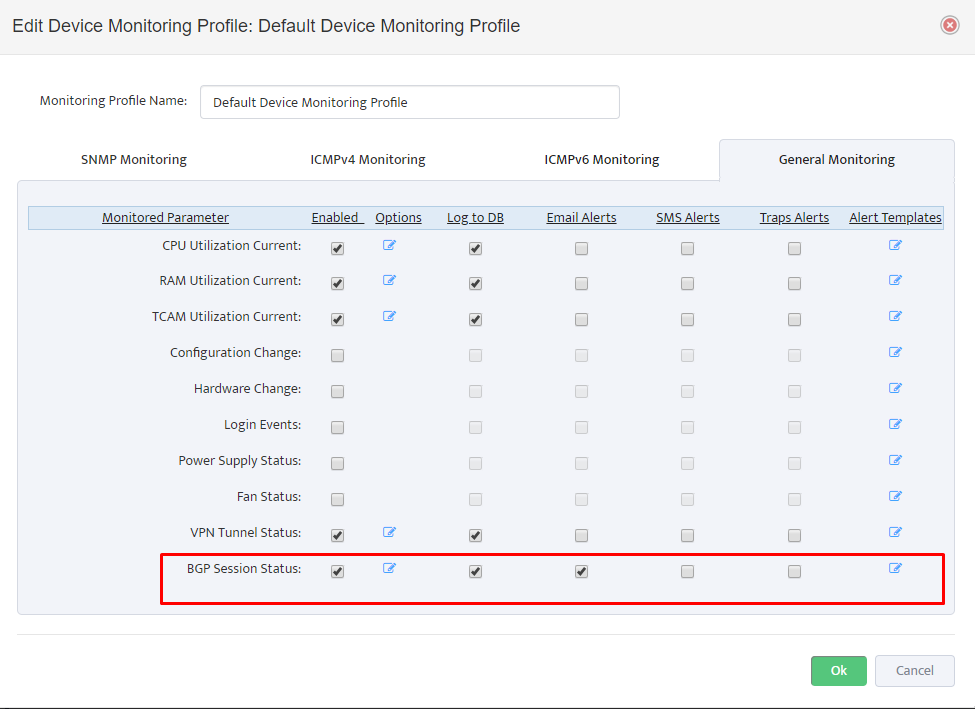
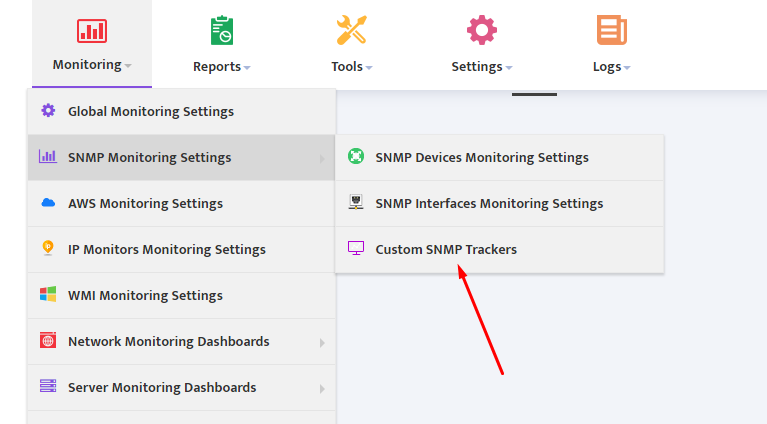
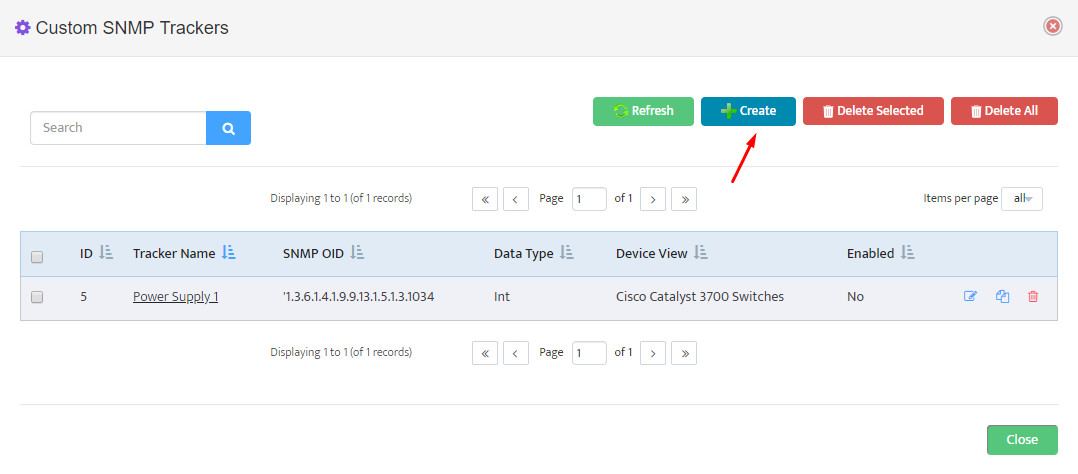
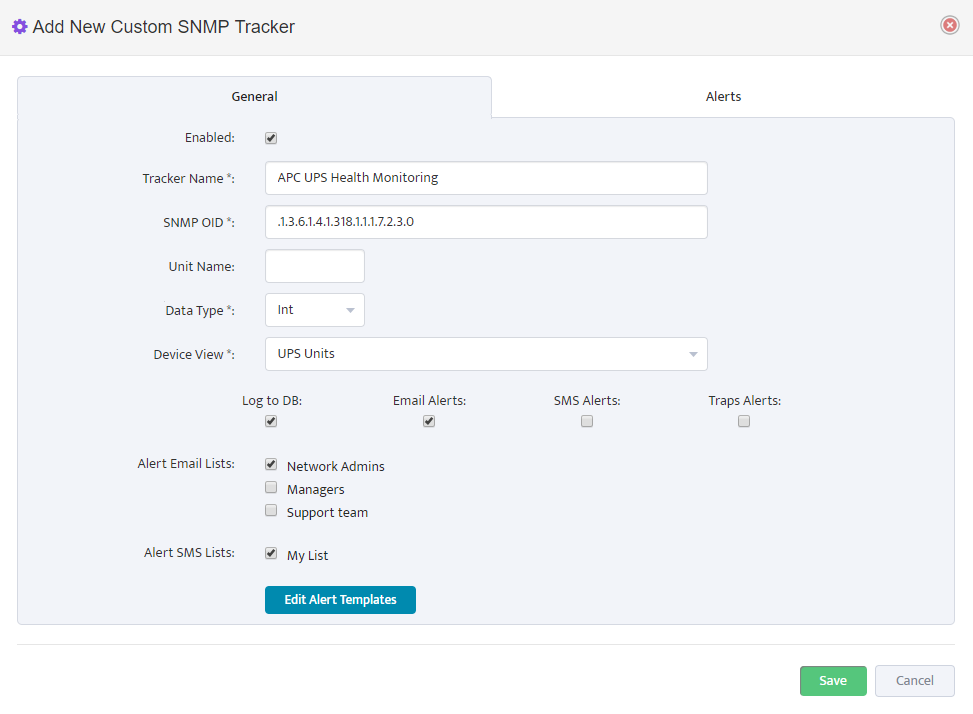
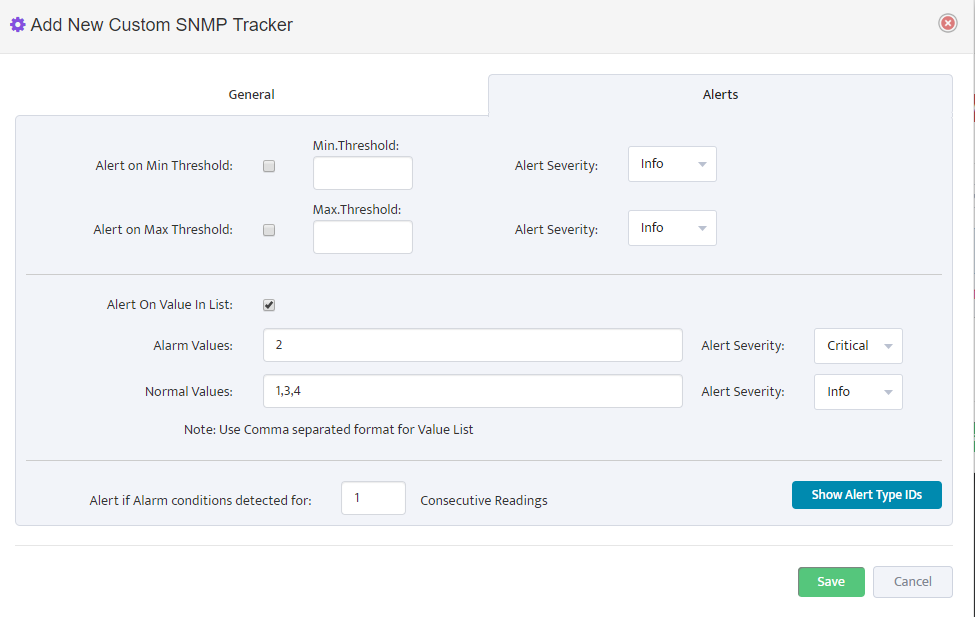
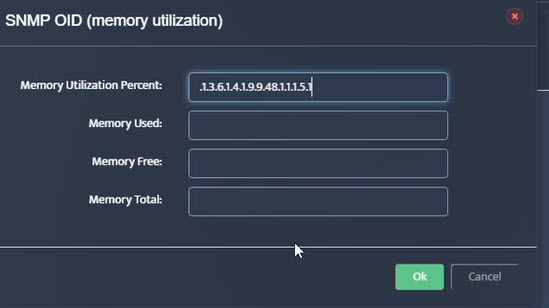
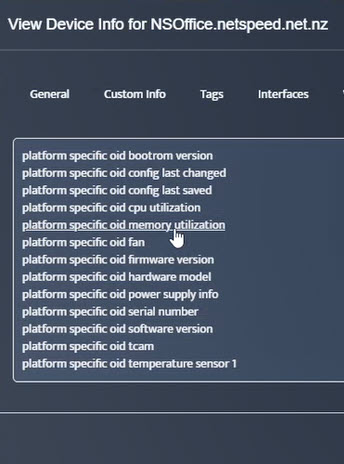 Step 5. To enter platform specific OID for memory utilization, click on the text.
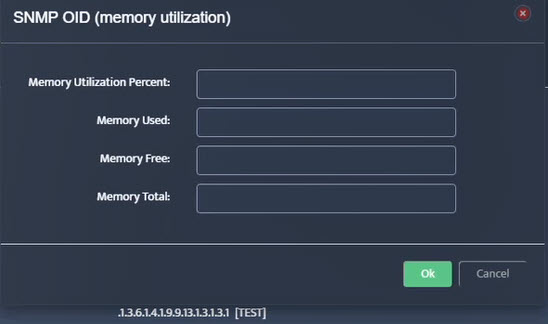

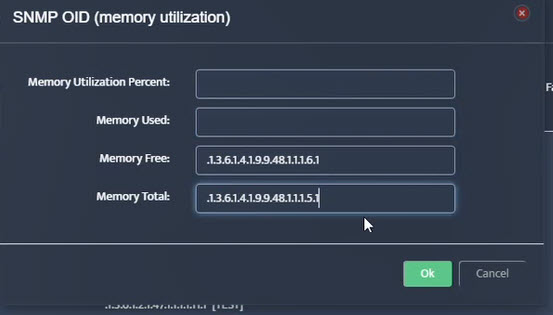
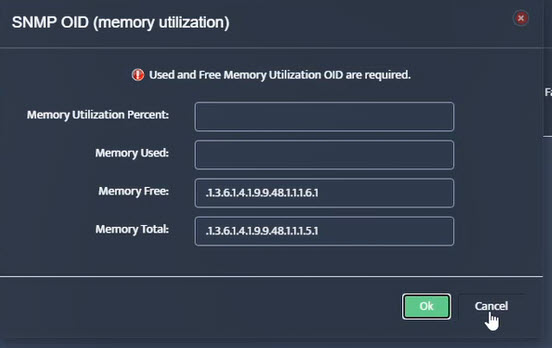 Step 7. Click on the OK button. Nectus will provision the OID information, unless an error is discovered.
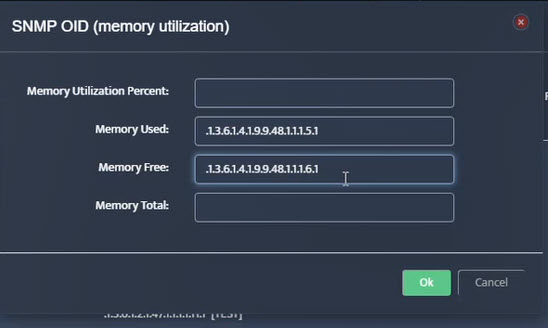

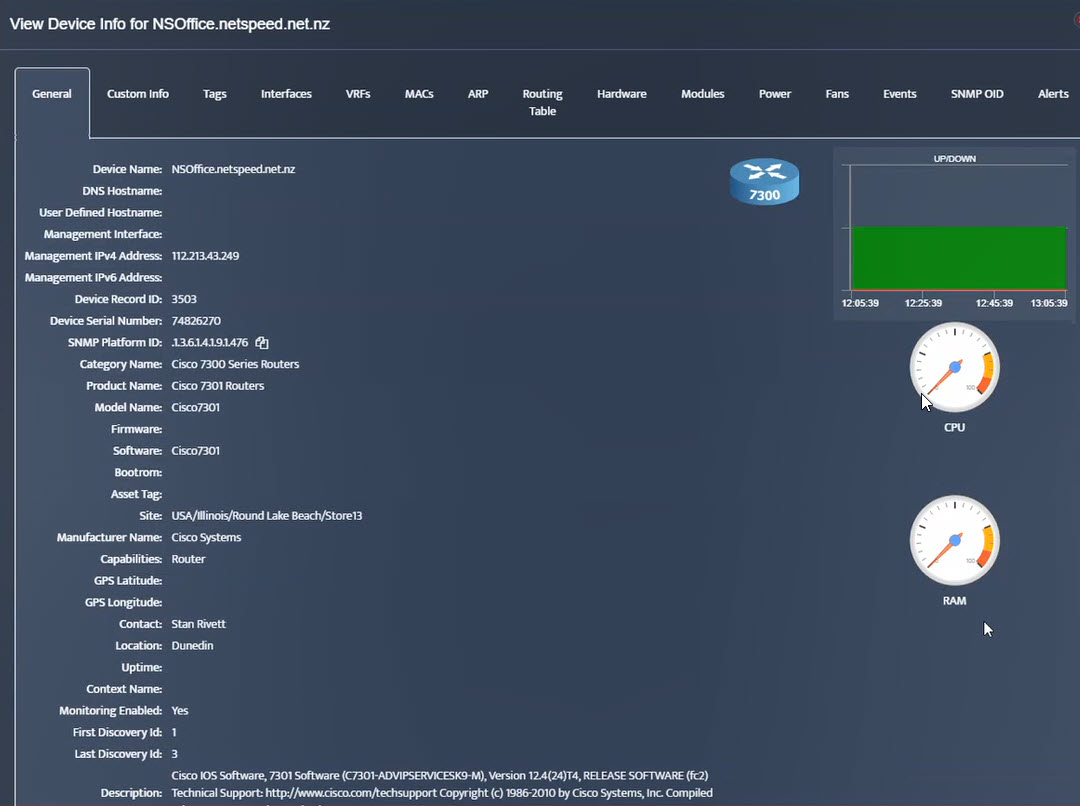
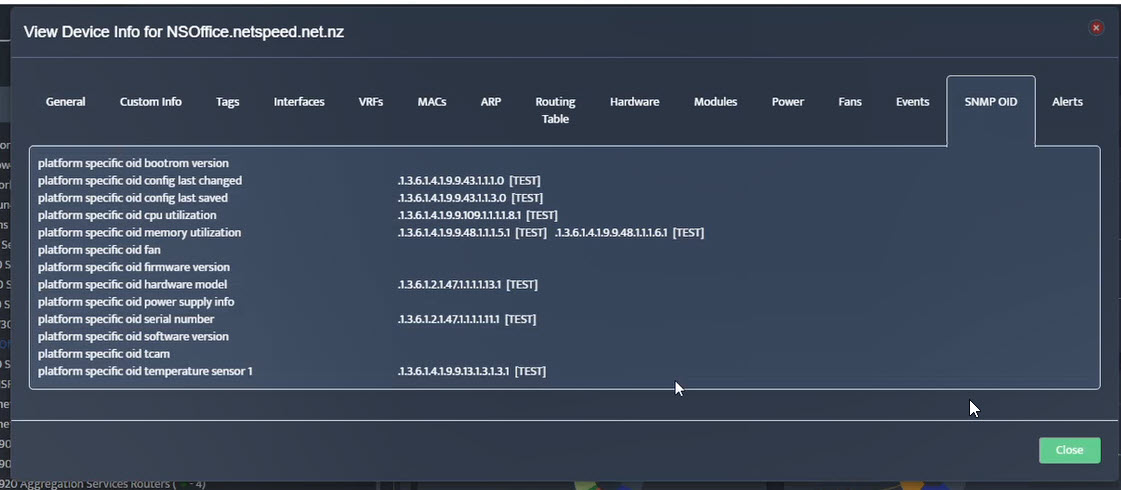
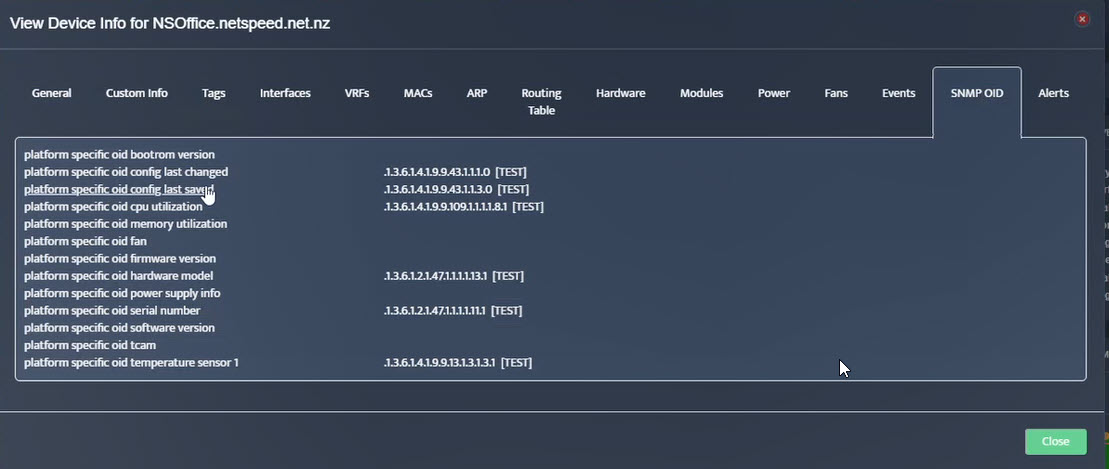
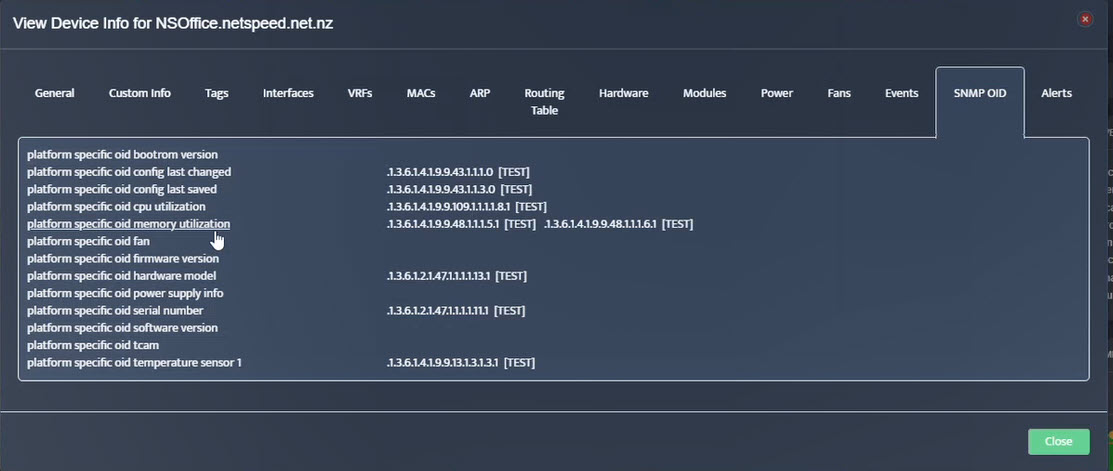 Step 8. The OID assignments are accepted and displayed on the View Device window.
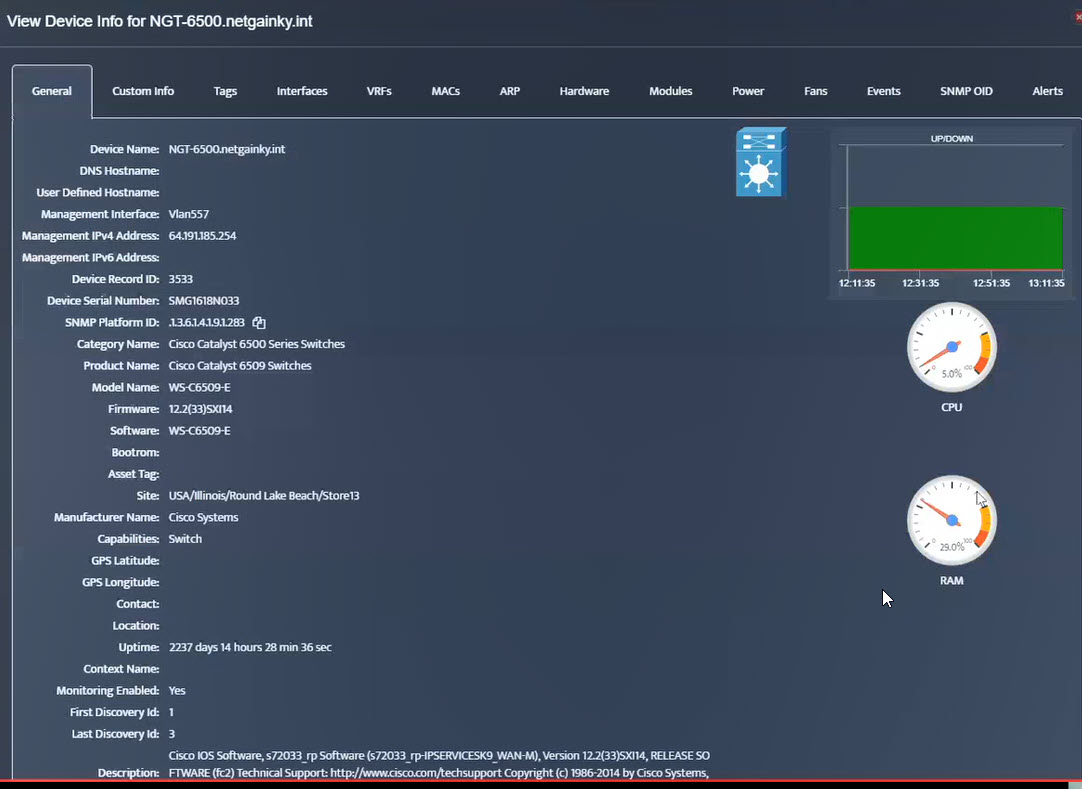
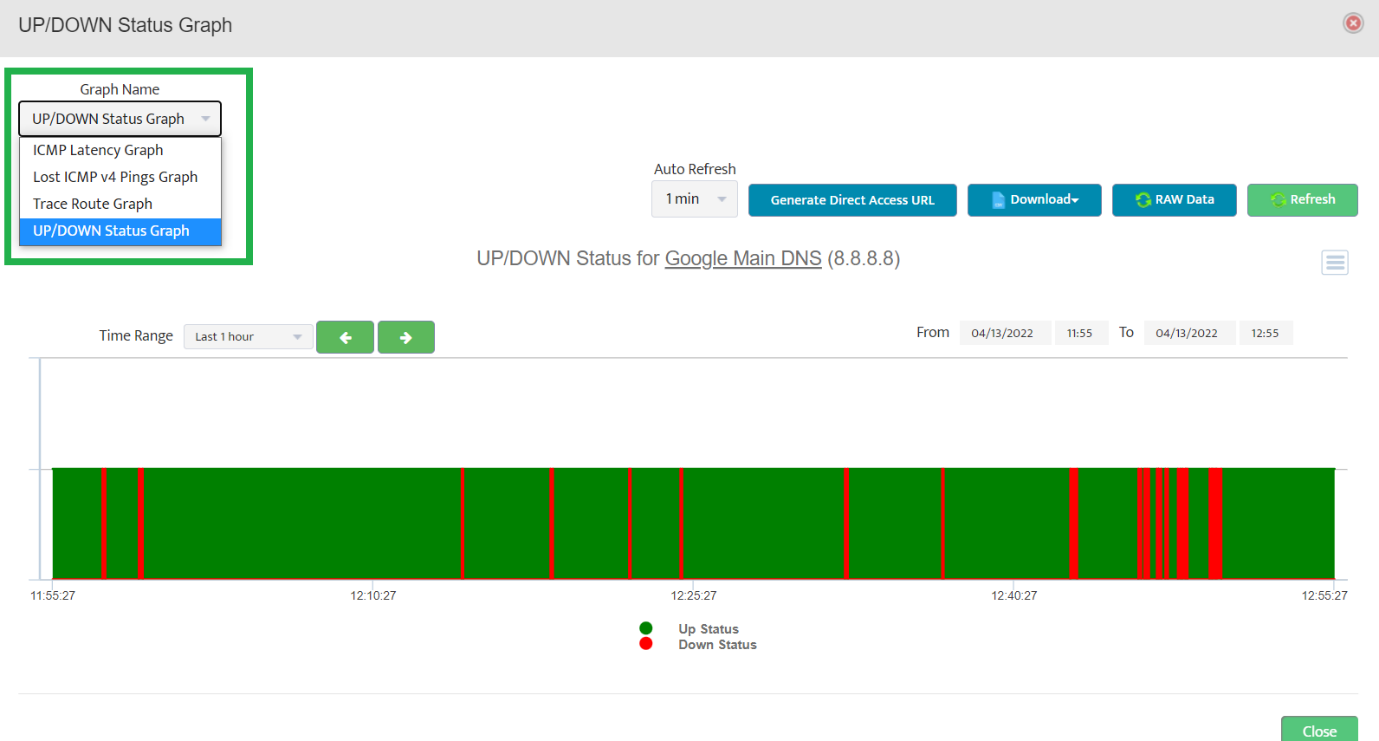
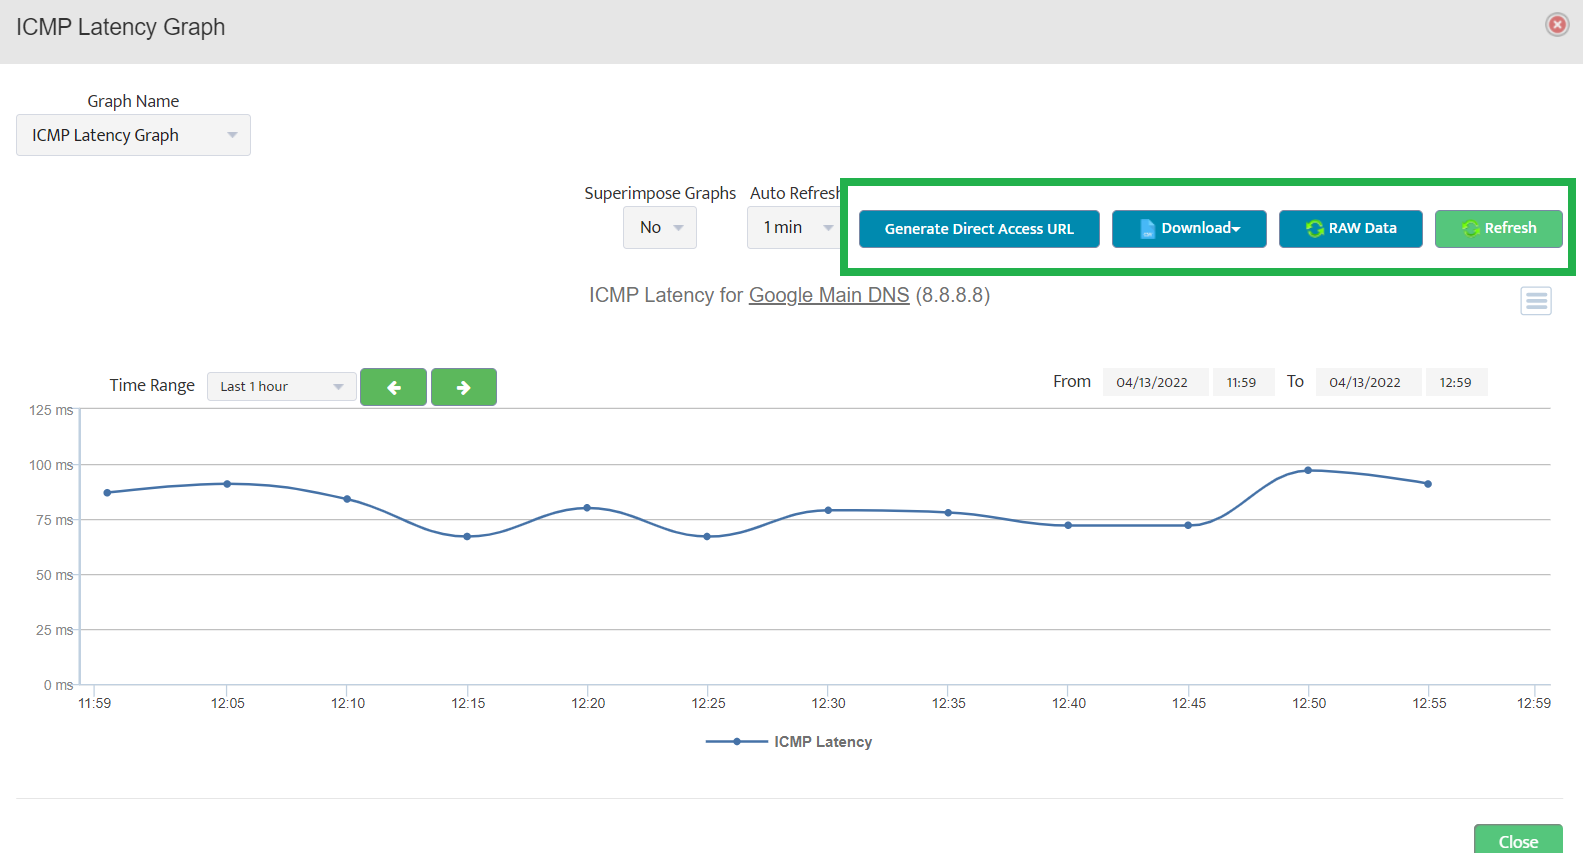
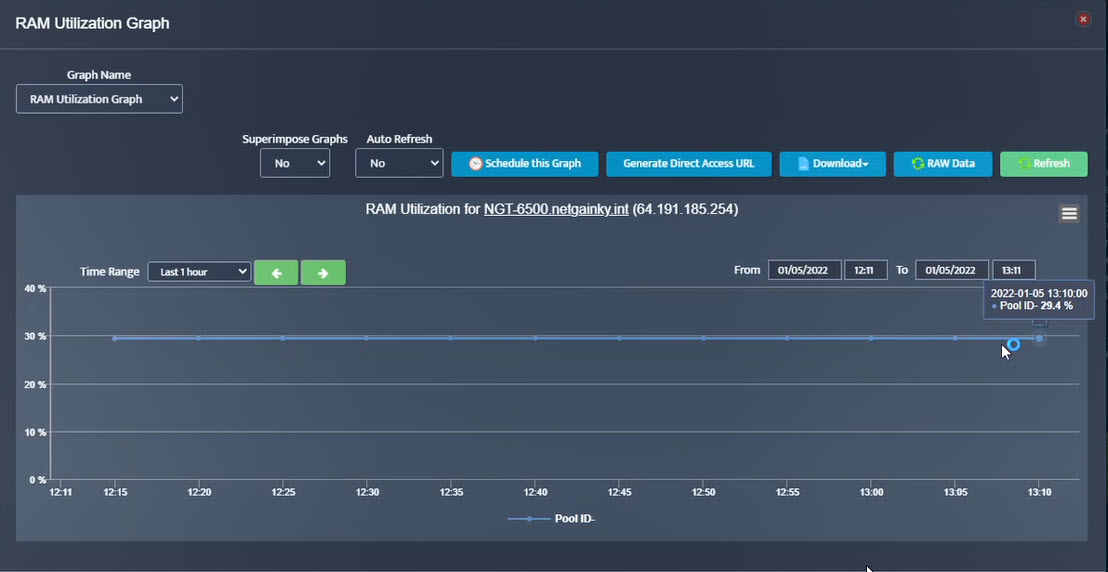 Step 2. Testing: Click on the dial to see a graph of the measurement over time.
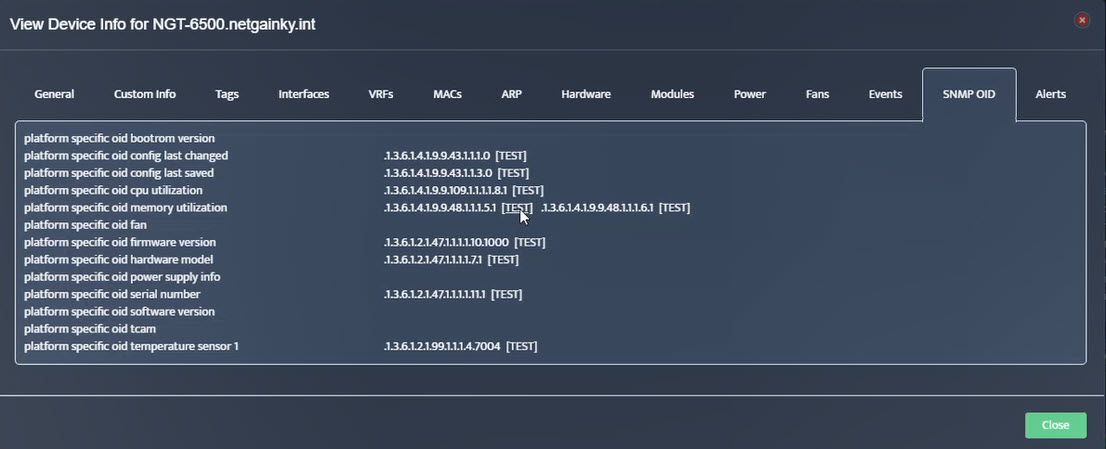 Step 3. Testing: To retrieve current value of OID select SNMP OID tab and click on “TEST” for OID of interest.
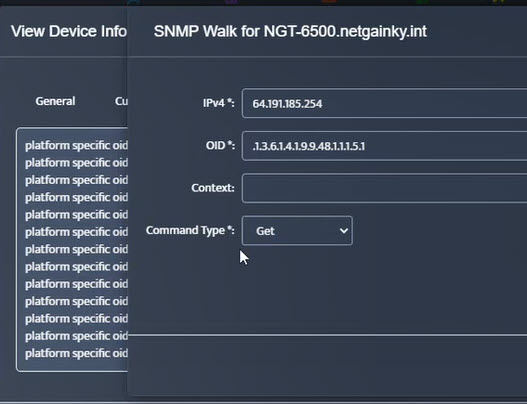
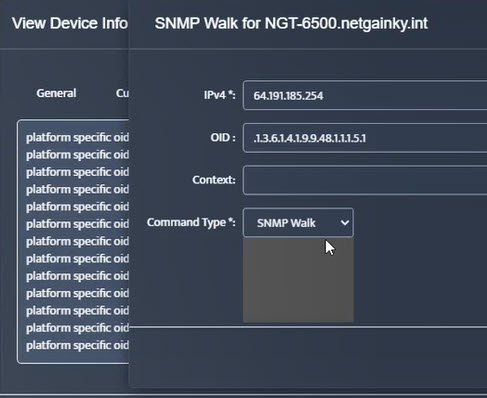
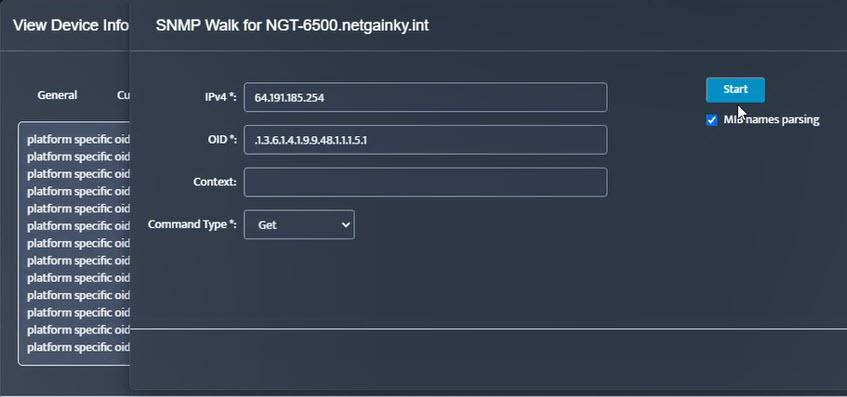 Step 5. Click Start.
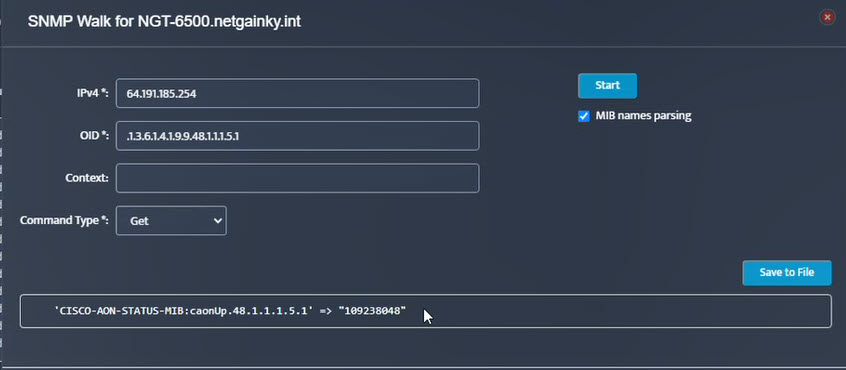 Step 6. Current value of the OID will be displayed.
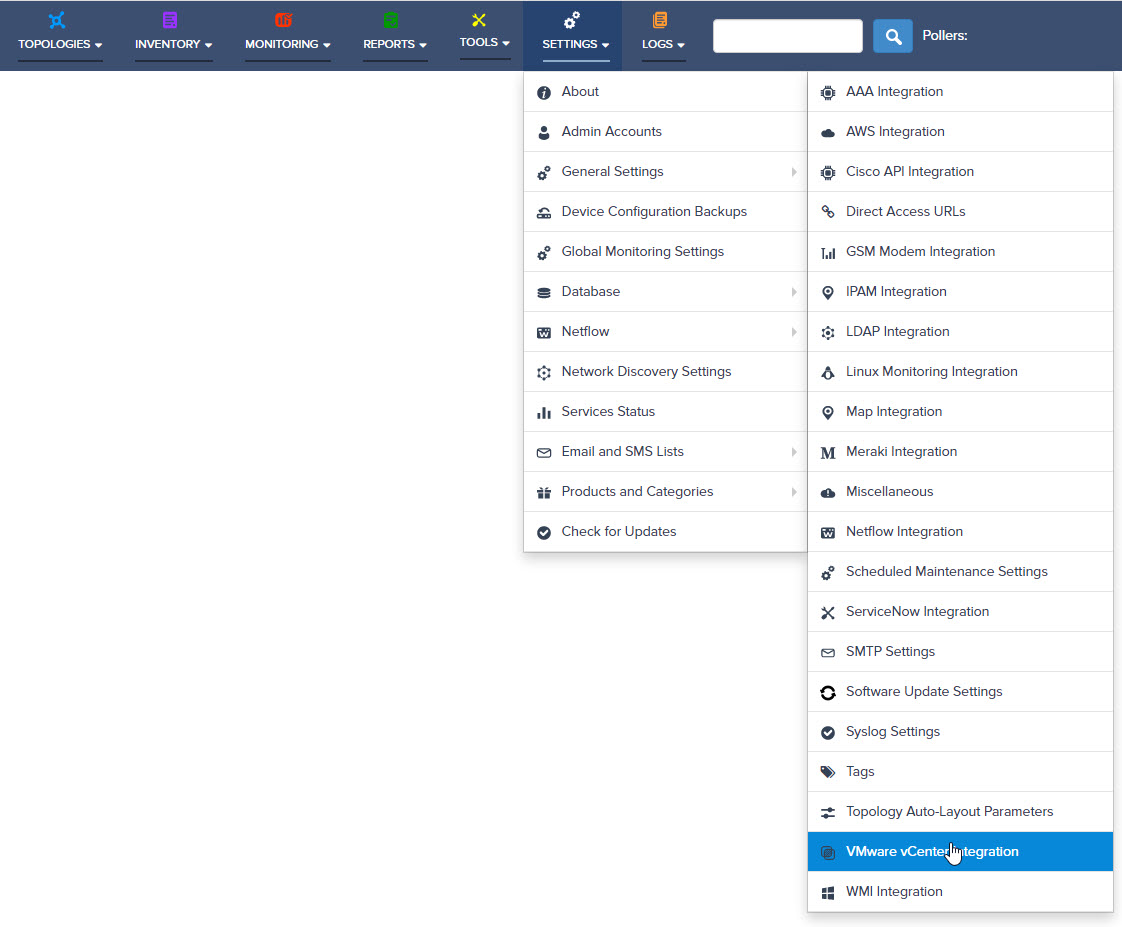
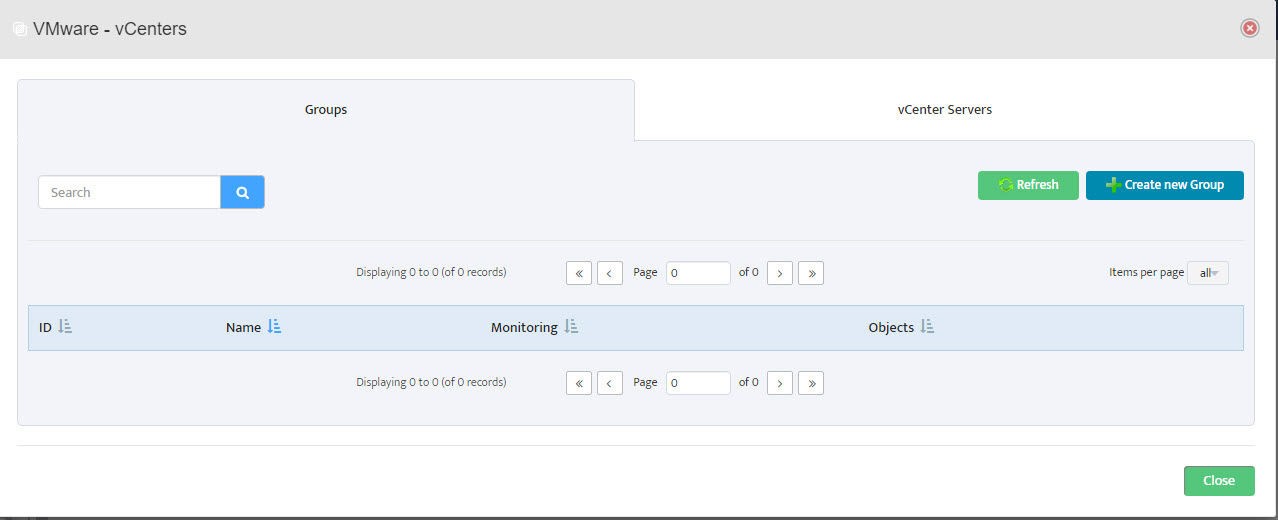 Step 2. VMware – vCenters window opens.
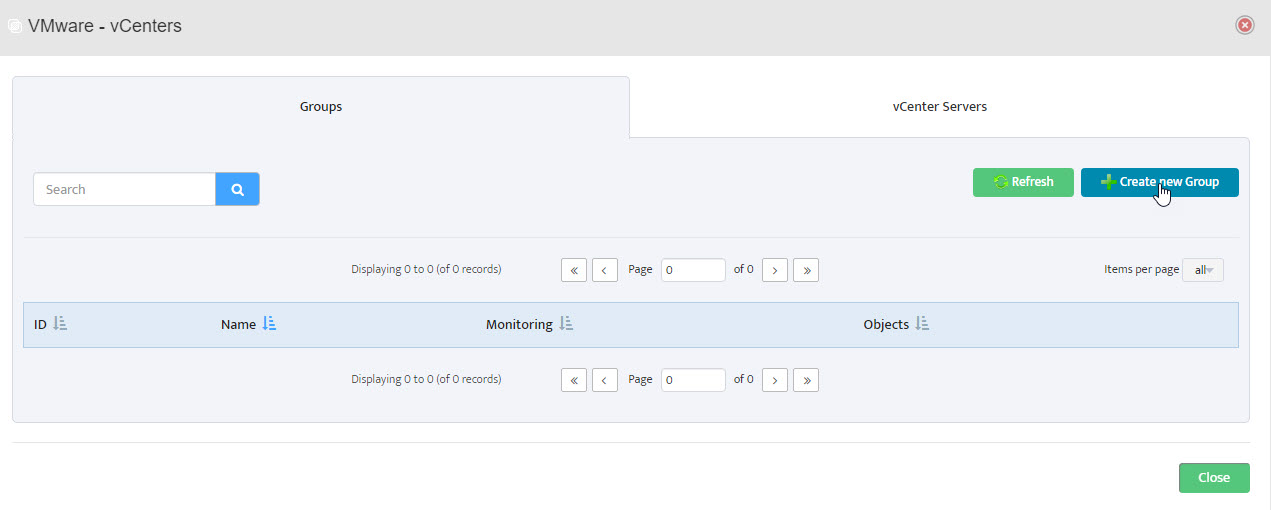 Step 3. Left-click Create New Group.
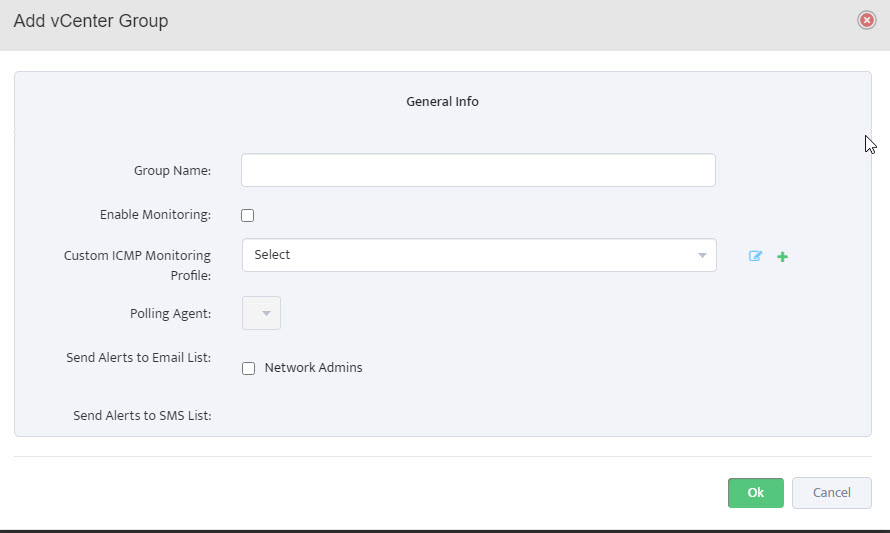
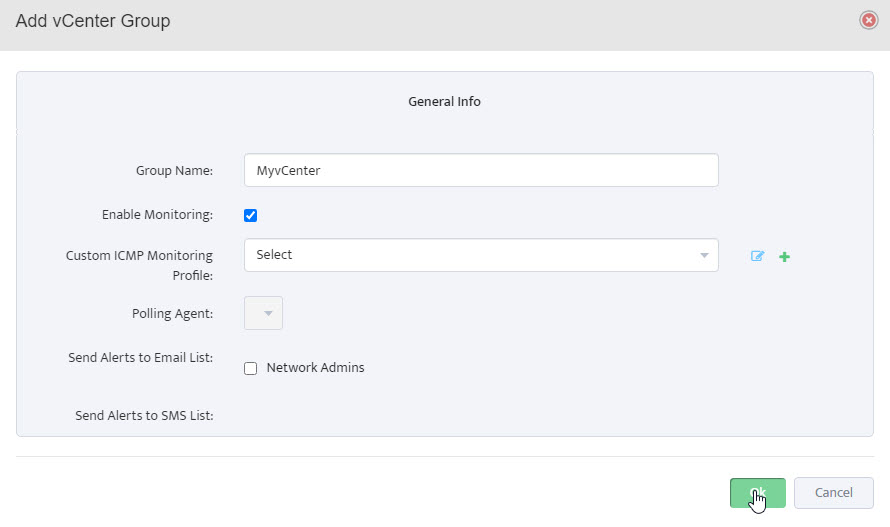
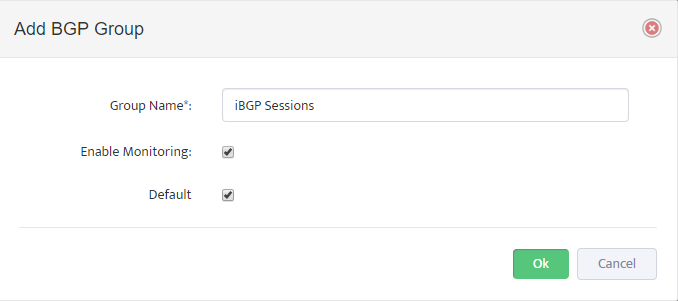
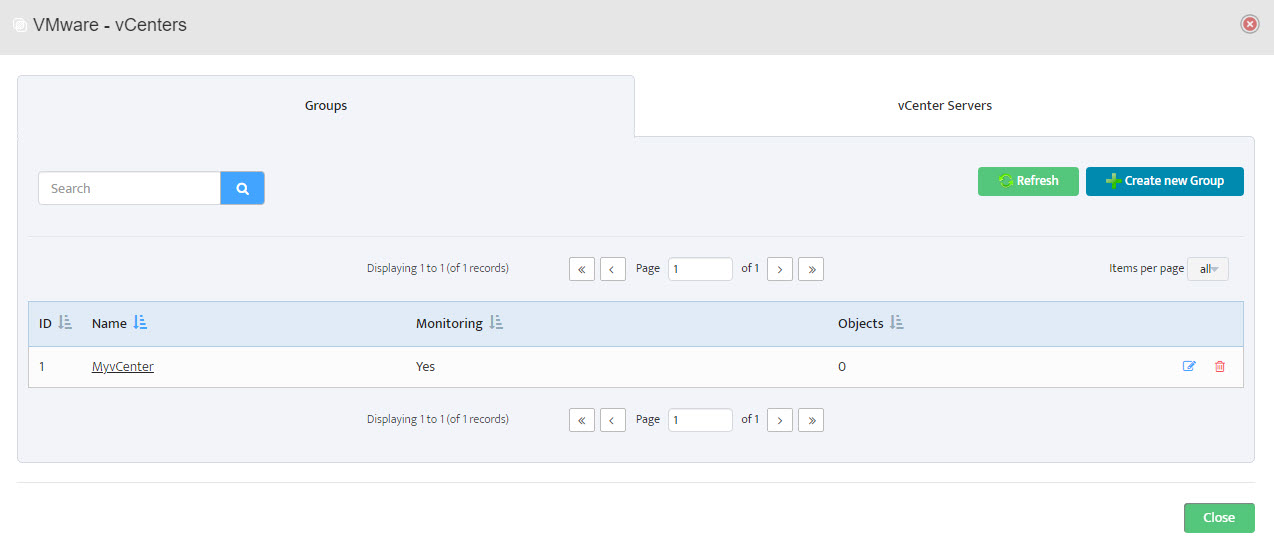 Step 6. Group Name appears in VMware – vCenters window.
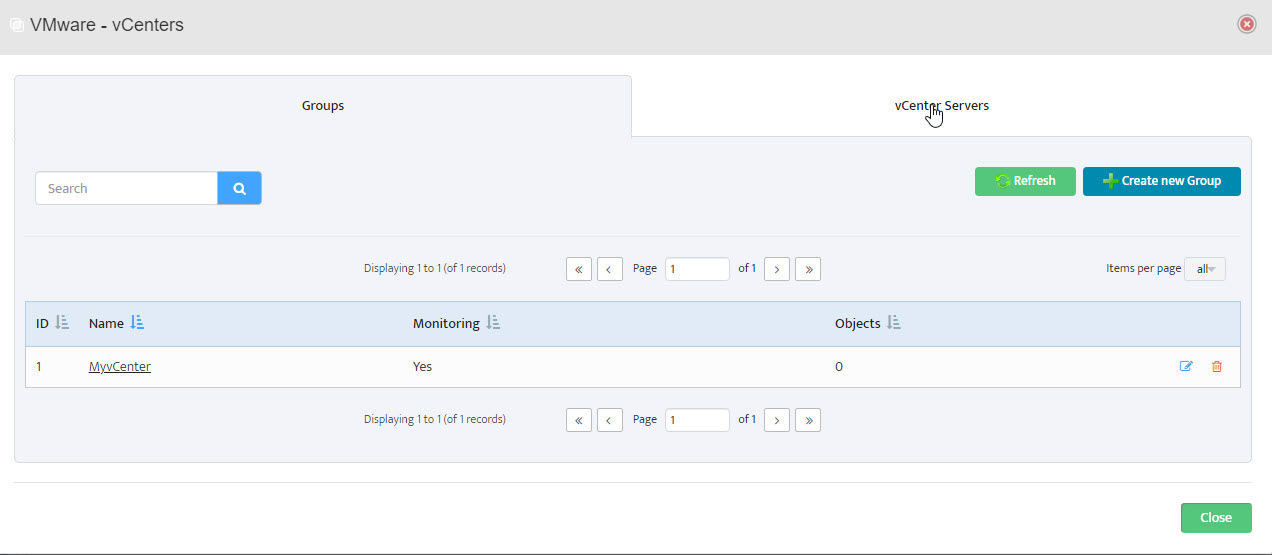 Step 7. In VMware – vCenters window, click on vCenter Servers.
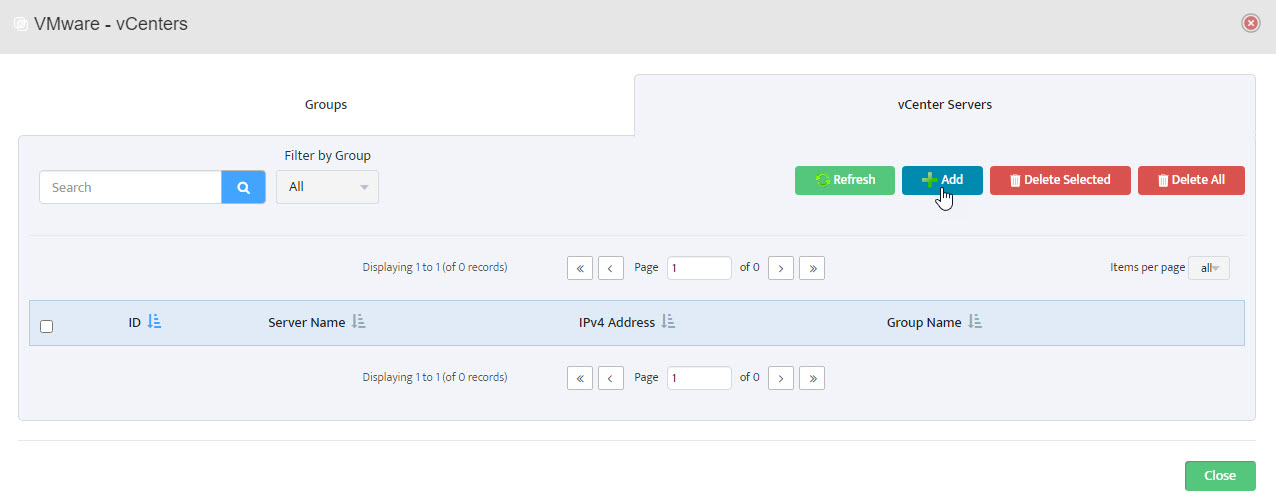
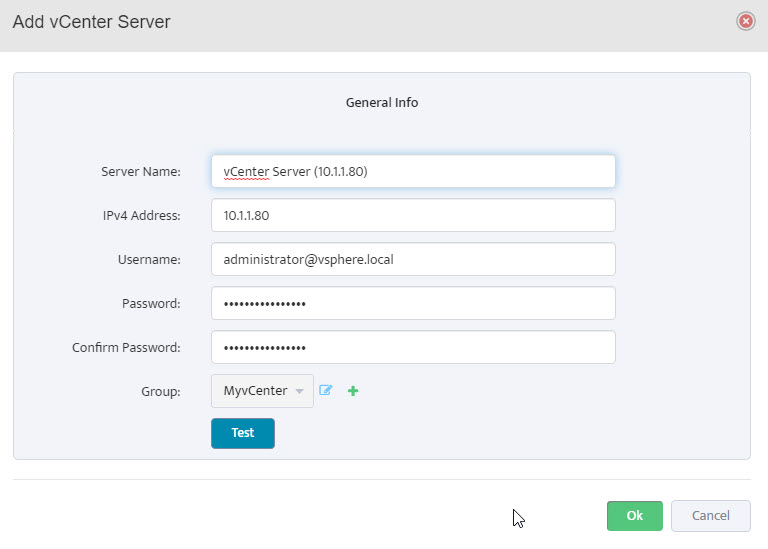
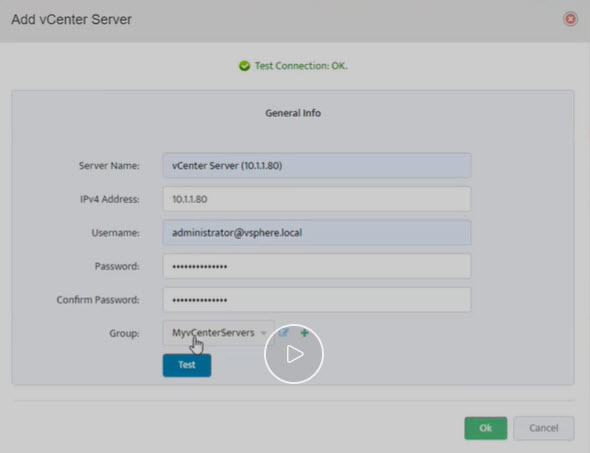
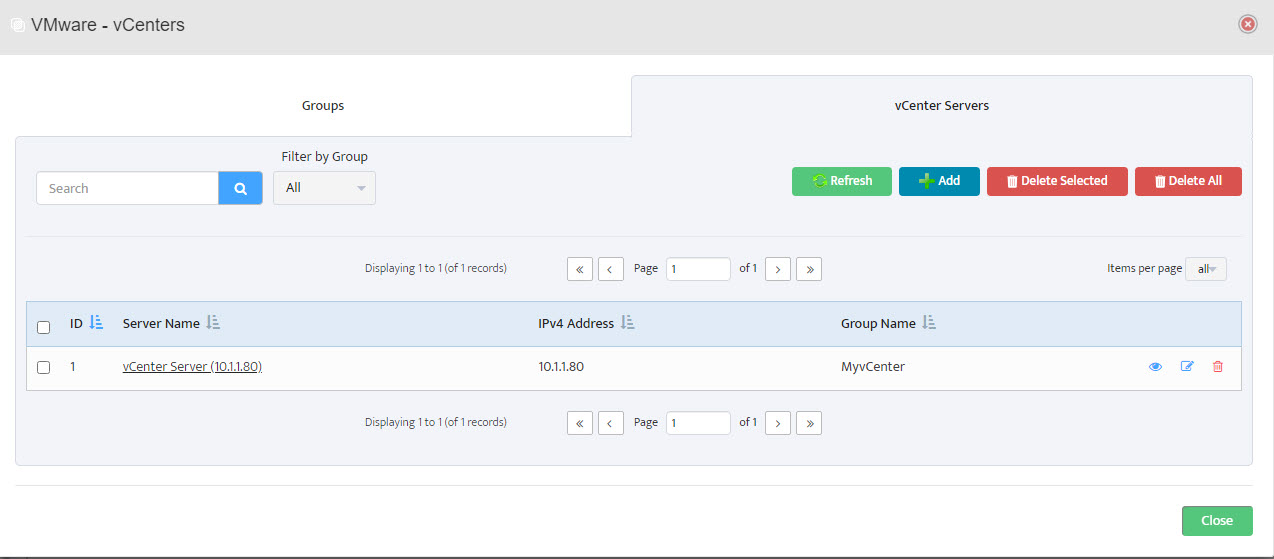 Step 11. Server shows in list of servers in VMware – vCenters window. Click Close.
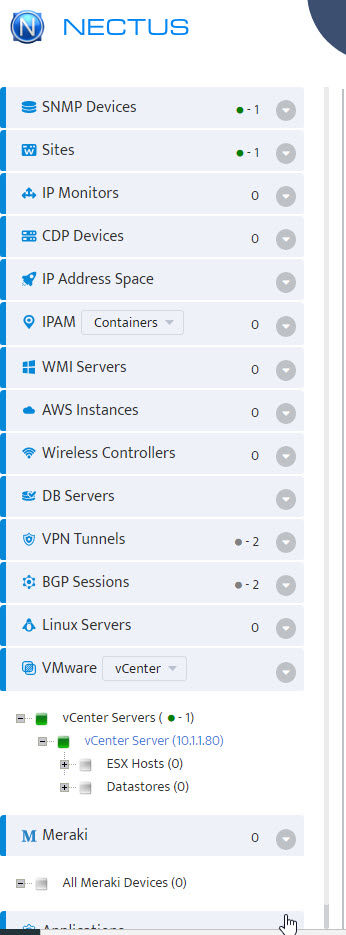
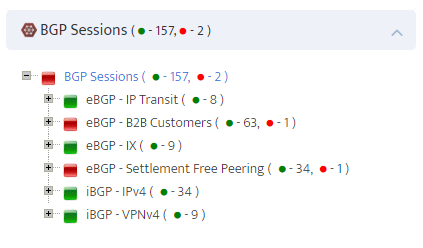
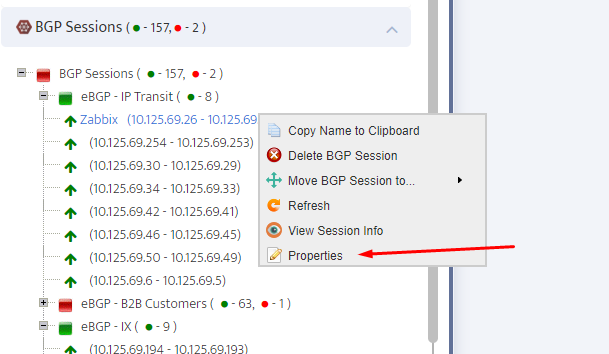
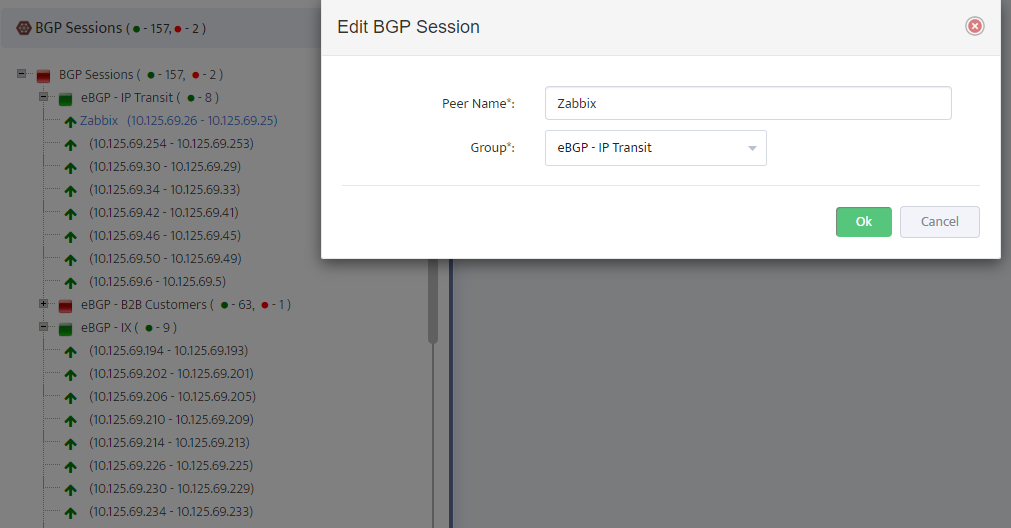
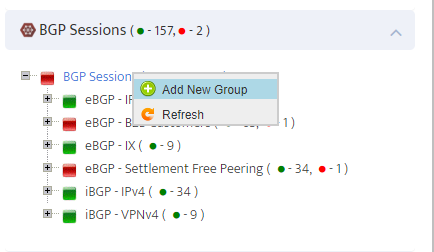
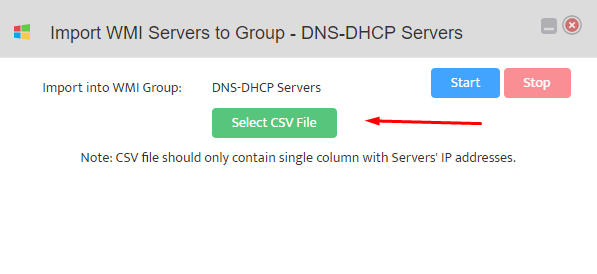
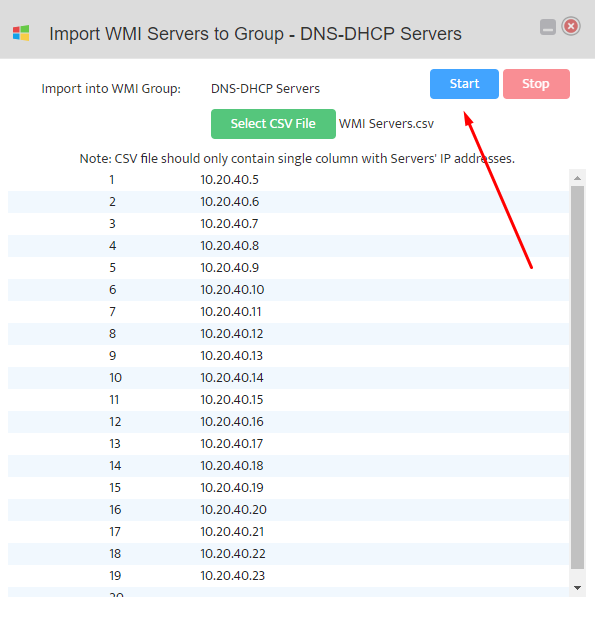
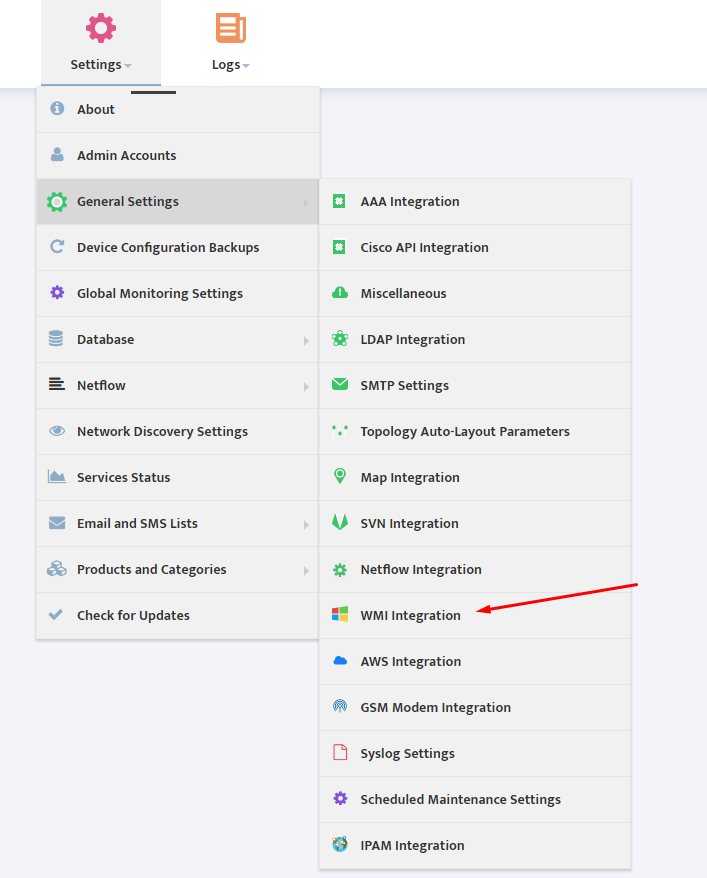
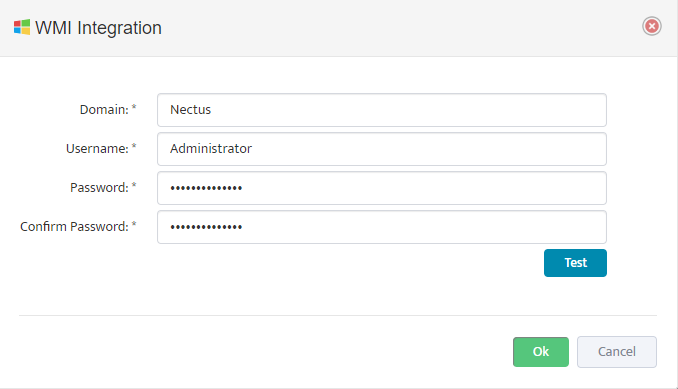
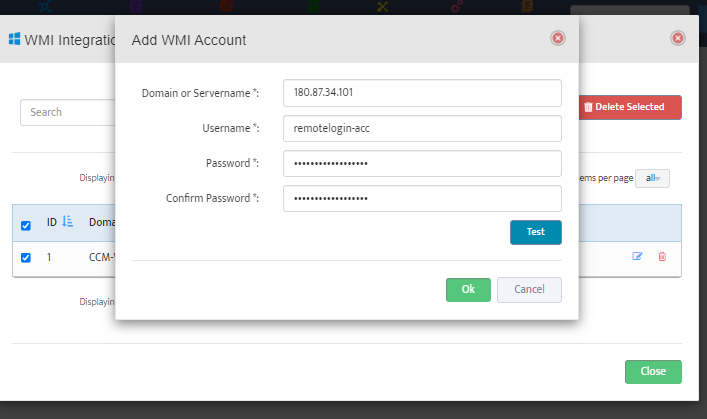
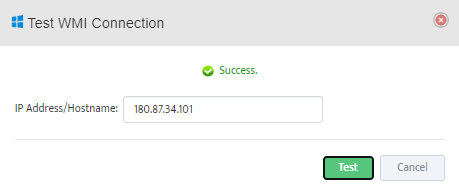
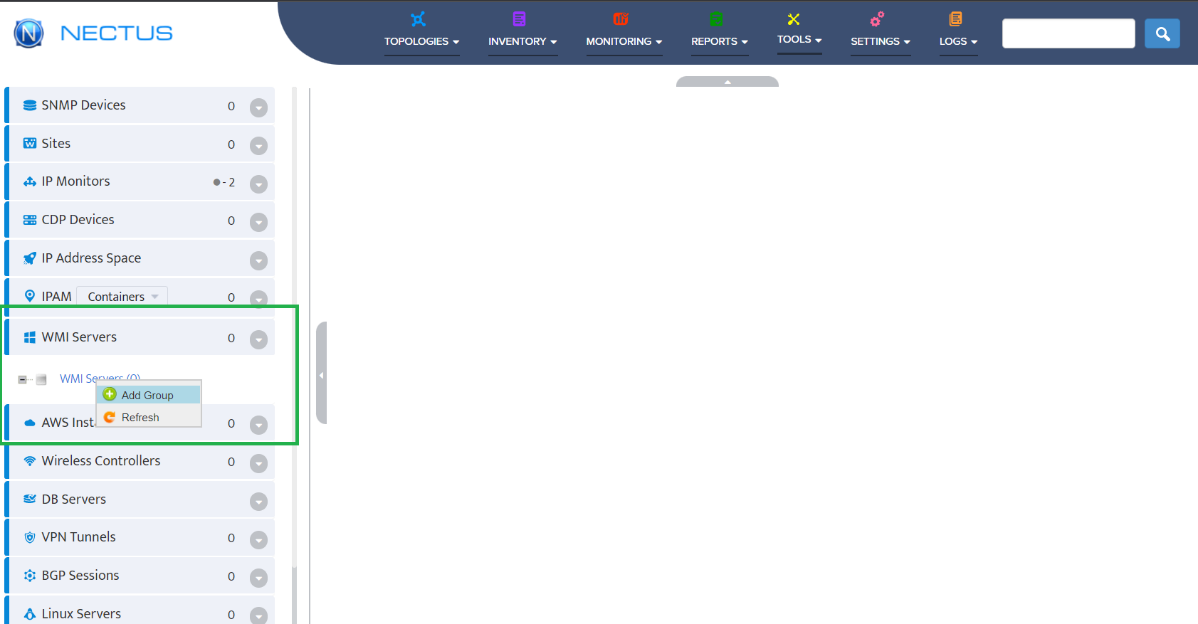
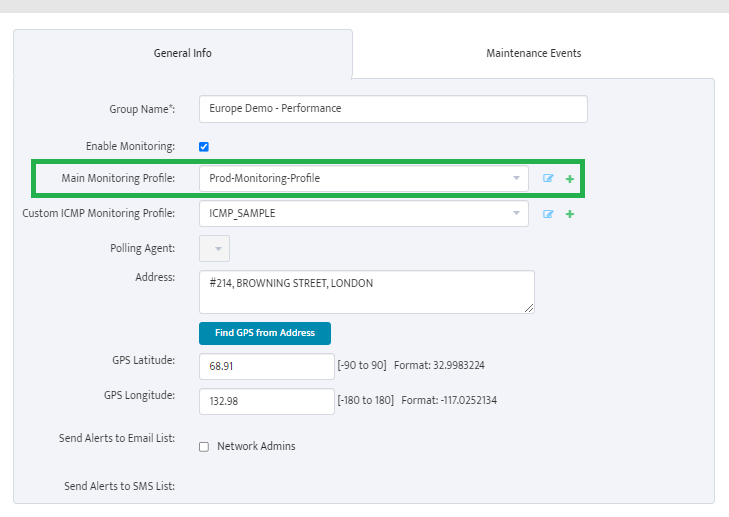
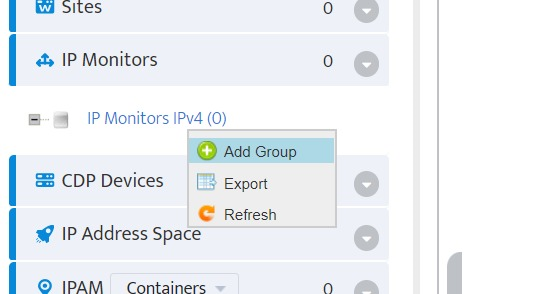
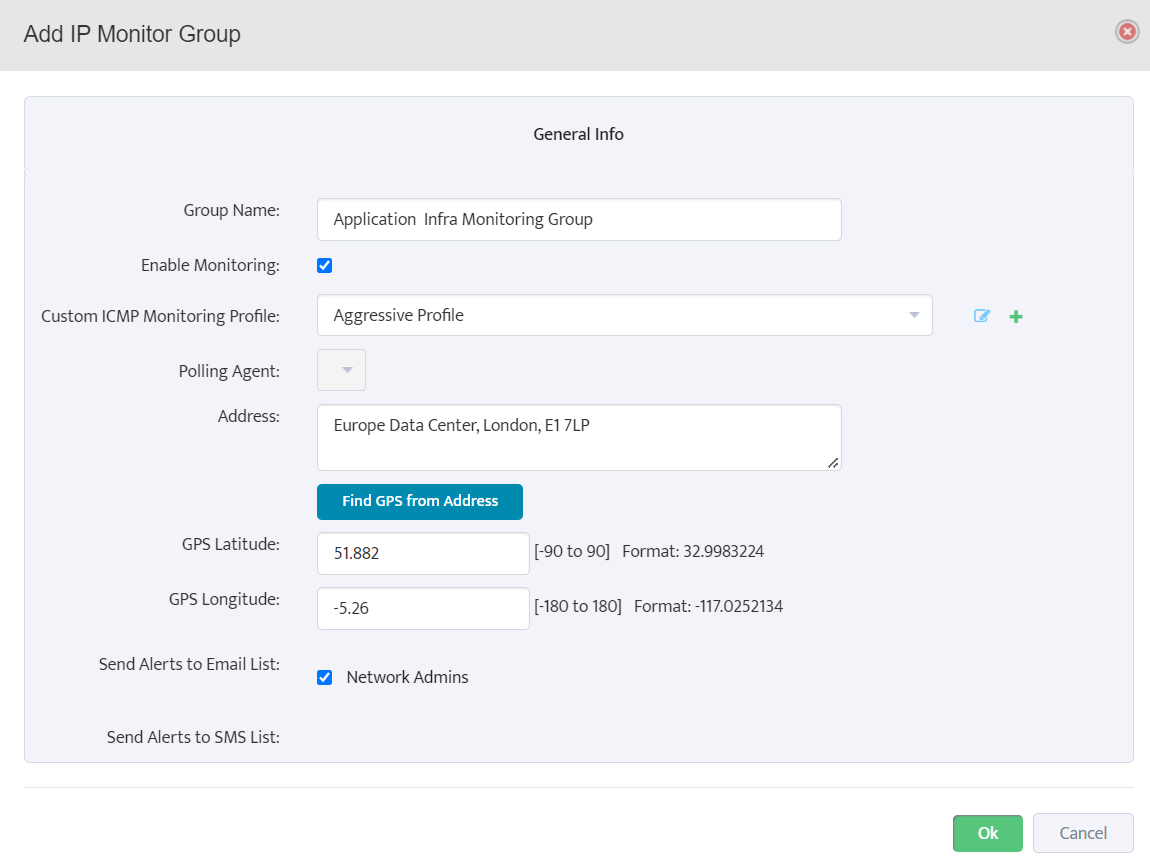
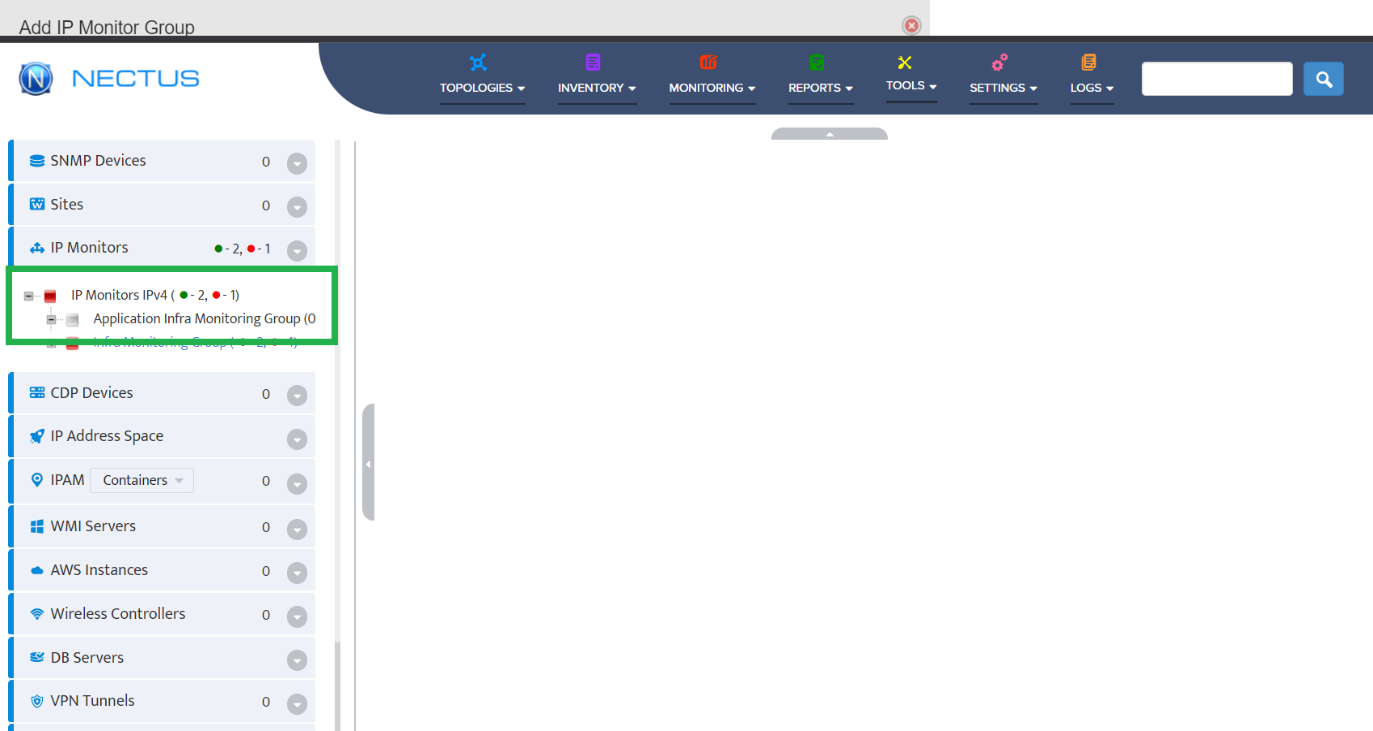
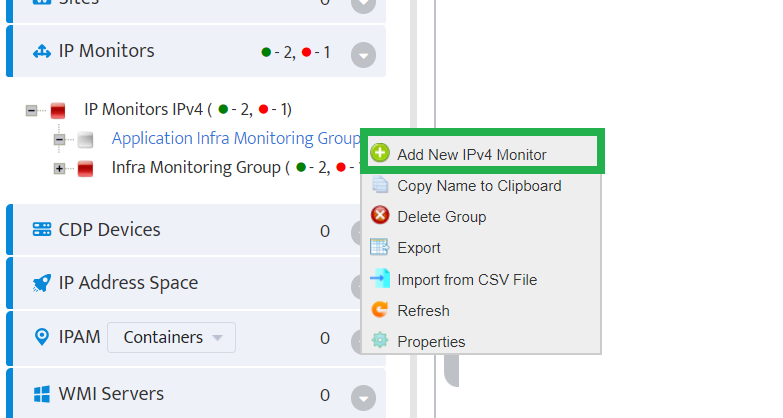
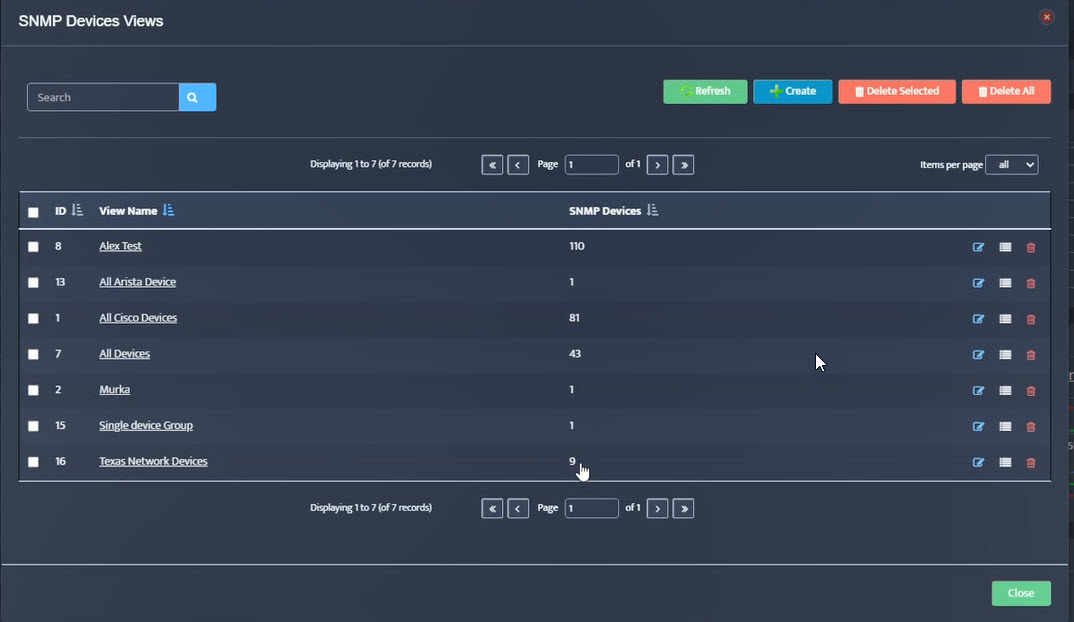
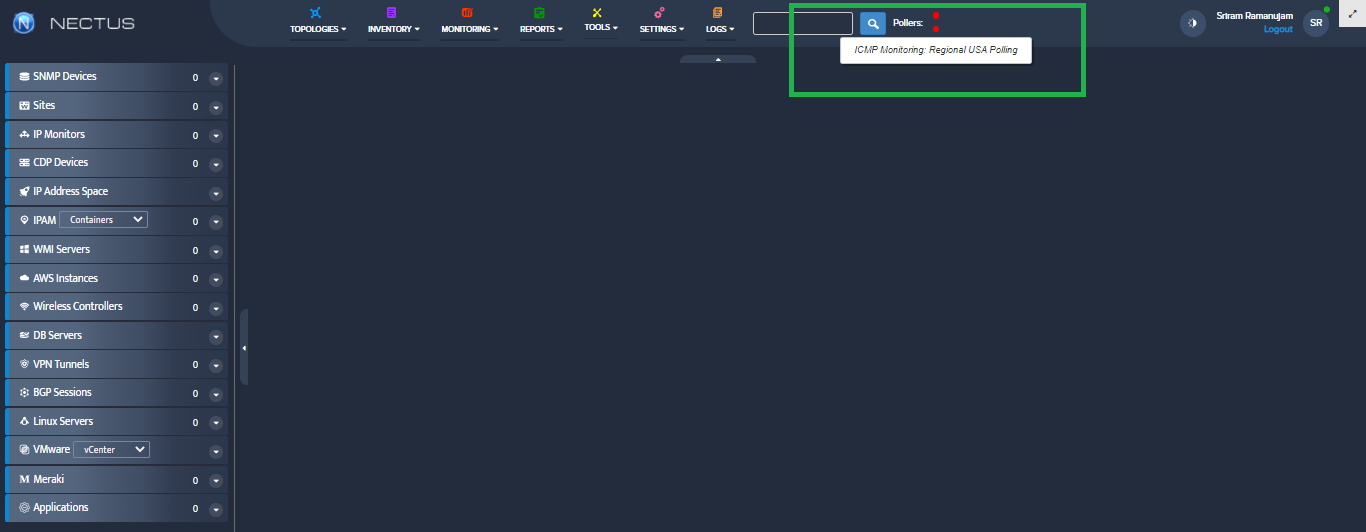
 .
.