Using Graphs in Custom Dashboards
Using Graphs in Custom Dashboards
Nectus offers extensive capabilities of visualizing different aspects of network performance and presenting it in custom dashboards.
This article guides you through the basic step of process of adding graphs to custom dashboards.
Step 1. Prepare Graphs for the Dashboard.
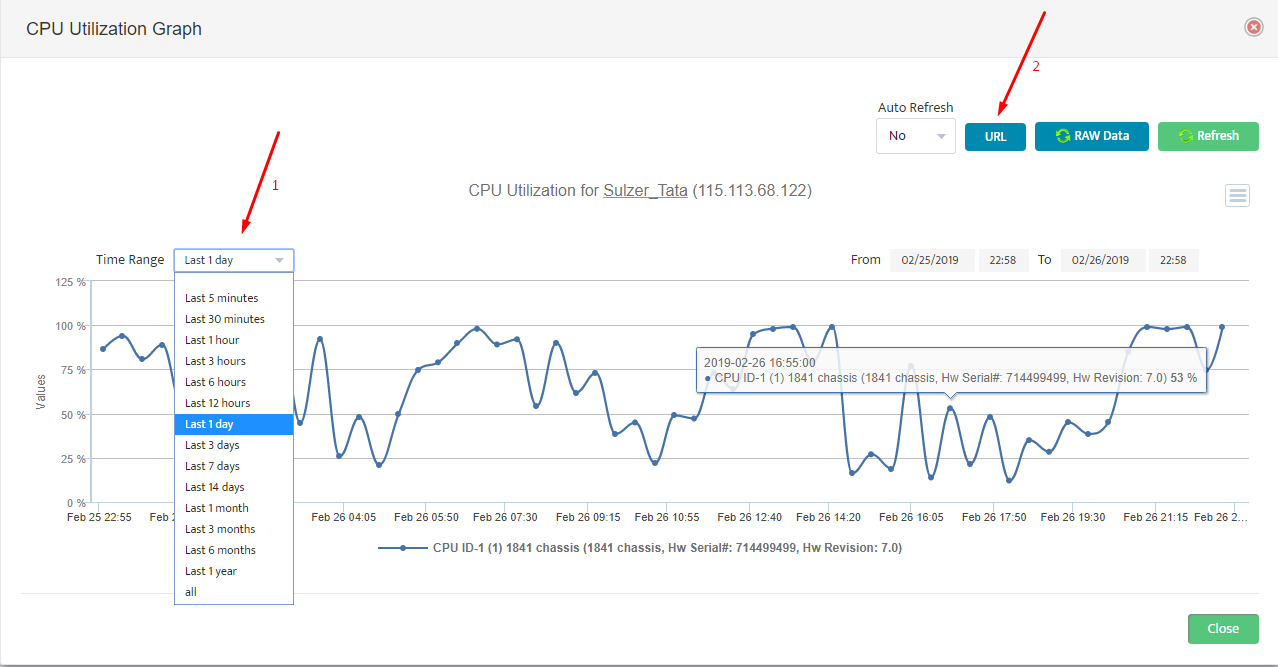
Generate the graph you’d like to include in a dashboard. Make sure to adjust the required time range using the drop-down menu in the left upper corner.
Click URL button to obtain the URL address for the graph.
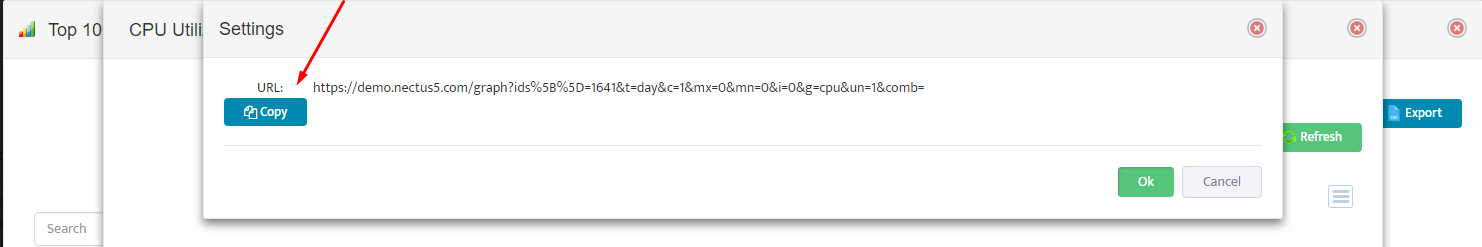
In the URL window, click Copy and save the URL address into Notepad.
If creating a dashboard with multiple different graphs, repeat building graphs and save URLs for every graph that will be included in dashboard.
Step 2. Create Custom Dashboard.
Once you have built the graphs and saved all the URLs, you are now ready to create a custom dashboard.
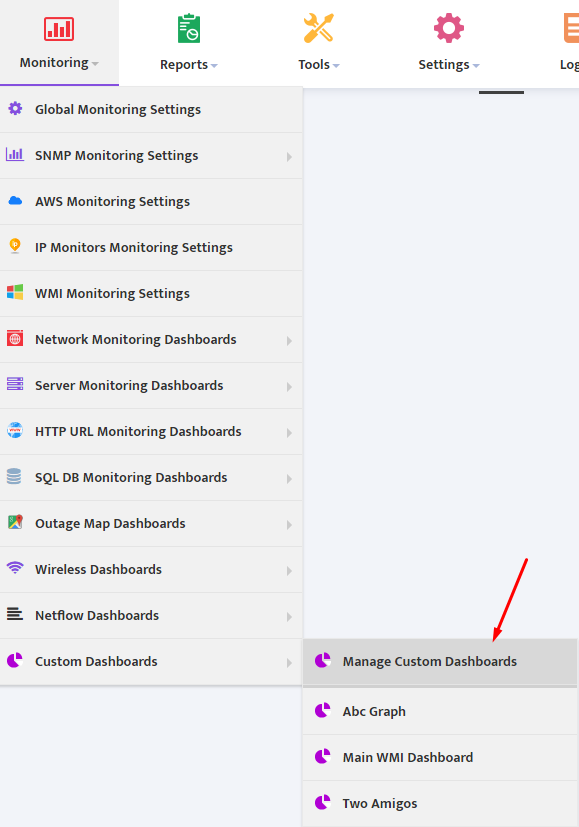
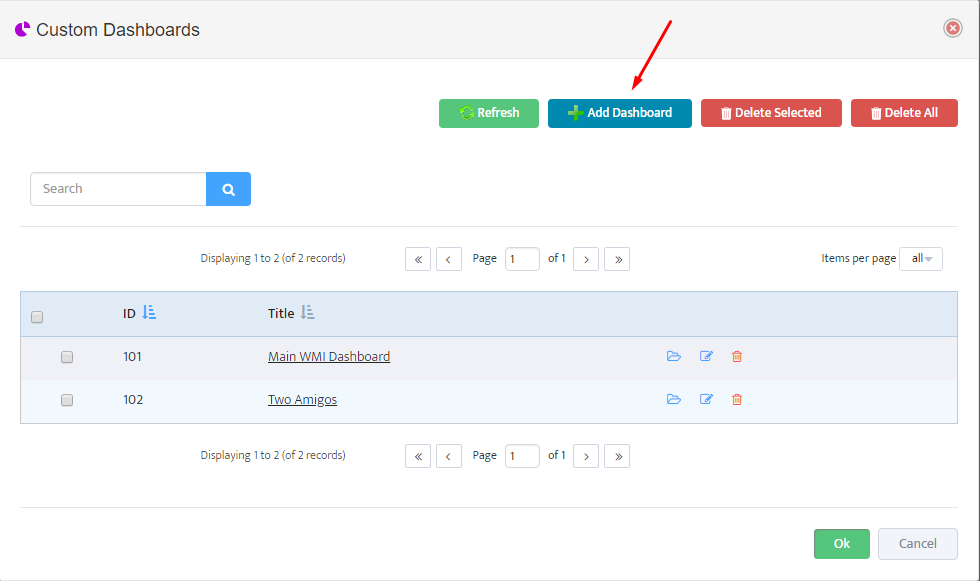
Go to Monitor → Custom Dashboards → Manage Custom Dashboards.
Click Add Dashboard button.
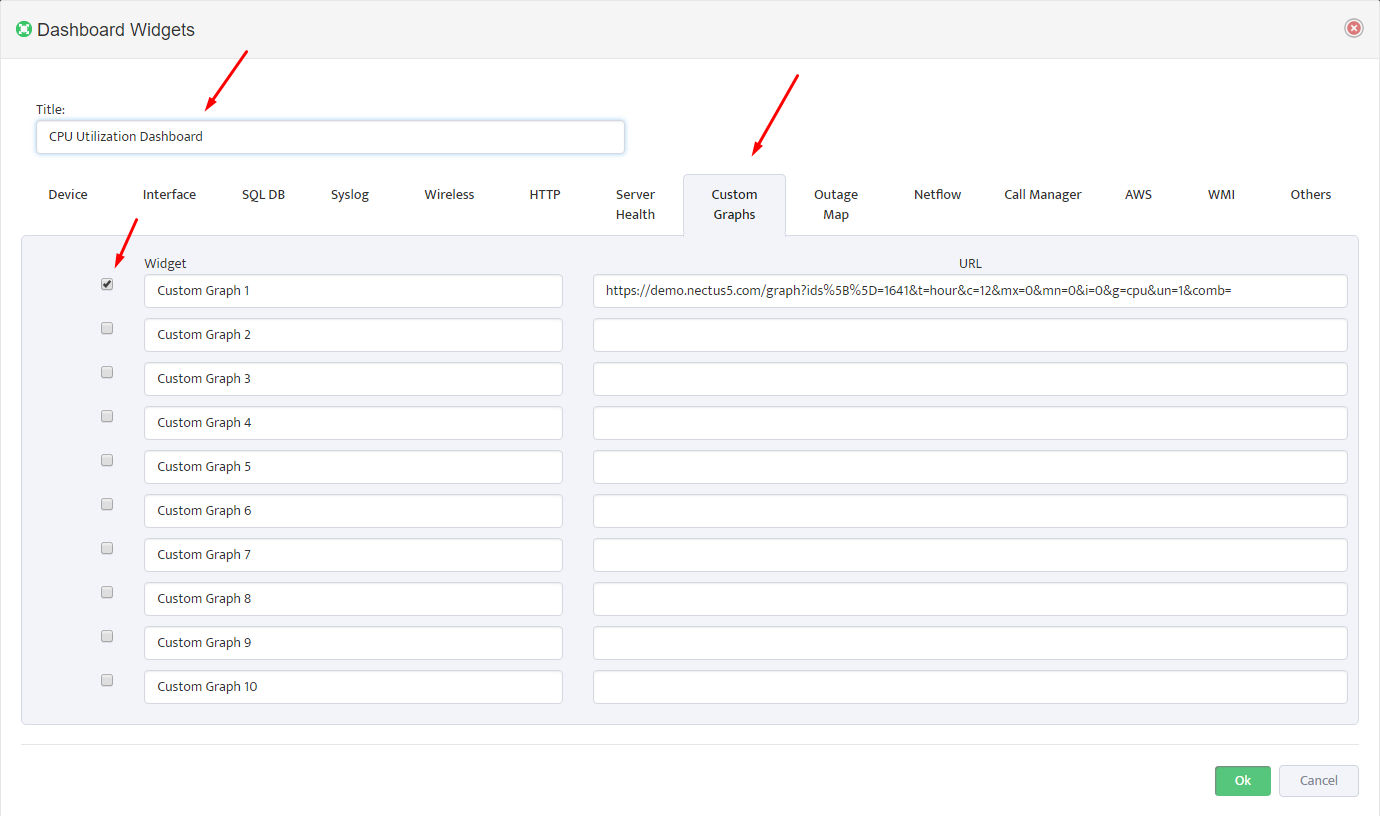
In the “Dashboard Widgets” menu select “Custom Graphs” Tab, select the number of graphs you’d like to display in Dashboard by checking the boxes on the left, and paste the URL addresses that you previously saved.
Give Dashboard a Name and press “Ok”
Your new dashboard is now listed in the Custom Dashboards list. Click on the name to open it.
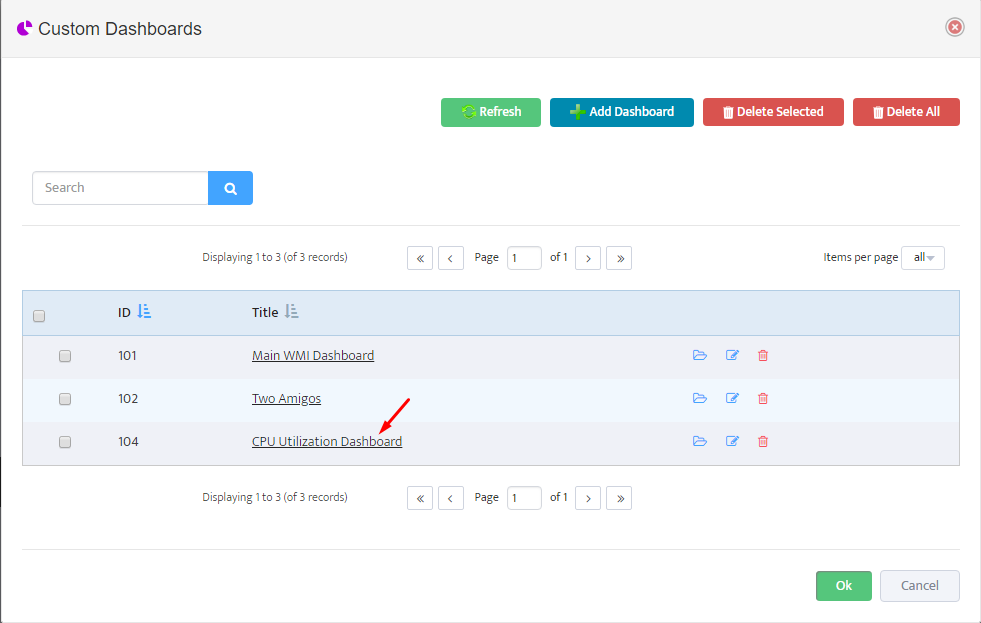
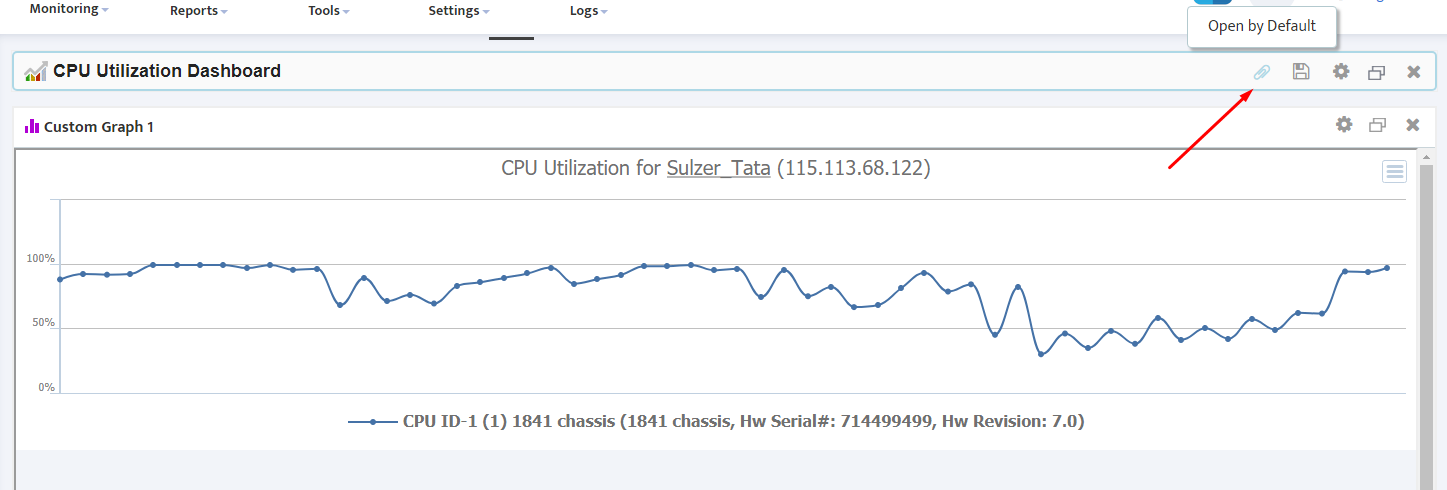
If desired, use paper clip icon in the right upper corner to make this dashboard appear every time you login.